If you're running ecommerce ops, order tracking gets messy fast. Even when sales look “simple” on the front end, the back end usually isn't. Orders can come from your storefront, marketplaces, wholesale invoices, or ad-hoc payment links. Fulfillment may run through your own warehouse, a 3PL, or a mix of both. Returns show up later. Fees often hit later, after payouts. Then someone has to answer the same questions every day: what shipped, what's stuck, what got refunded, and what the real revenue looks like after fees.
A dashboard in Excel can handle this well, as long as you build it around clean inputs and consistent definitions. The goal isn't to create a perfect BI system. The goal is a spreadsheet that gives you an accurate daily view of orders and exceptions without turning into a manual “copy, paste, fix, repeat” routine.
What to include in your order dashboard
A useful tracking dashboard doesn't try to visualize everything. It focuses on the small set of numbers that drive daily decisions, plus a short list of exceptions you can act on.
Start with order volume and order value, then split it the way your team actually operates. Most teams benefit from seeing orders by channel, orders by fulfillment status, and orders by age, because those are the levers that uncover problems early. Once you have that, it's much easier to spot when a single channel is slipping, when a fulfillment provider is falling behind, or when a batch of orders is aging out and creating support tickets.
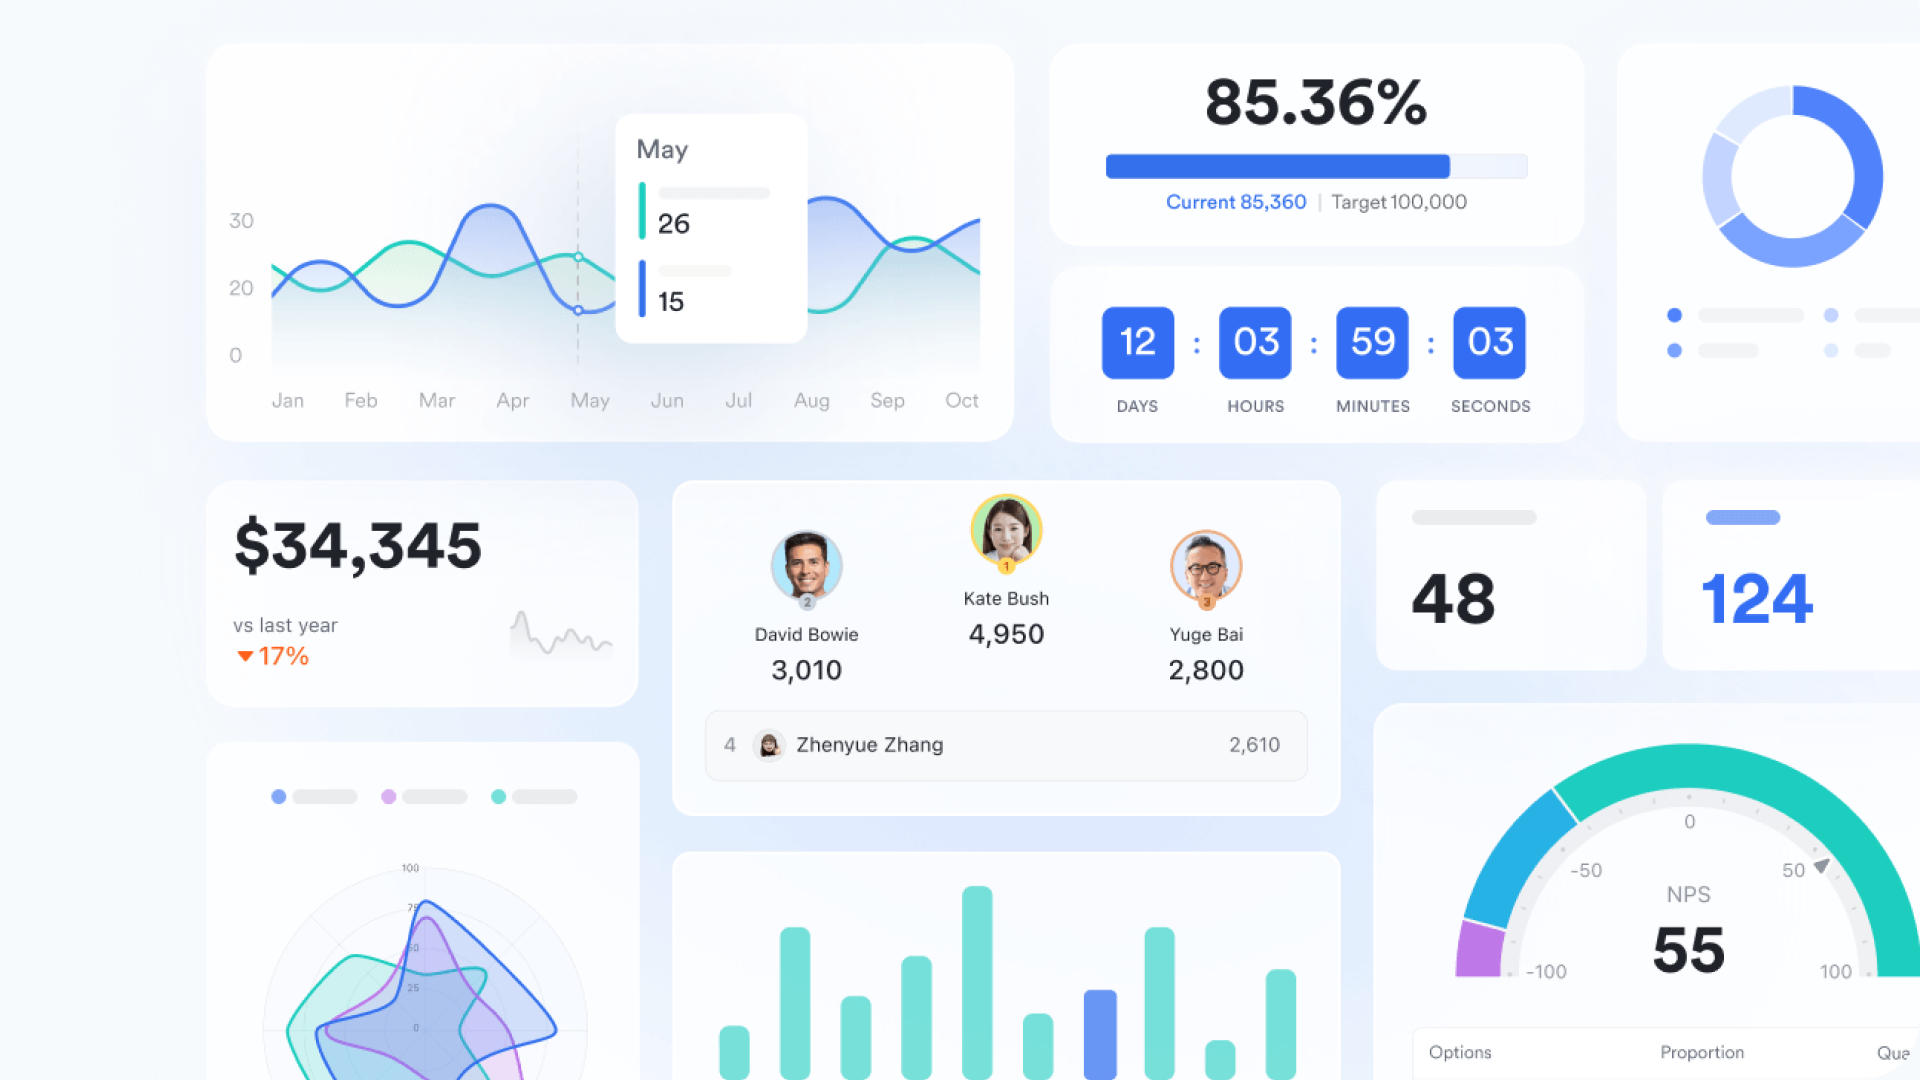
Returns and refunds deserve their own section because they distort your “sales” story if you lump them into one total. You'll want to see the refunded dollars, the return rate, and the time lag between purchase and refund. That lag matters because it affects cash flow and customer experience, and it's usually where operational issues show up first.
Fees and shipping costs should be tracked in a way that matches how money actually lands. For example, marketplace fees may be deducted before payout, while card processing fees might be shown separately. If you can't tie fee totals back to channel and time period, you end up with a dashboard that looks clean but doesn't reconcile.
Explore live dashboards to visualize your ecommerce team
Clean up your order data first
Excel dashboards fall apart when the underlying tables aren't stable. If your exports change format every week, or the same thing is named three different ways across sources, you'll spend your time fixing the sheet instead of reading it.
The simplest way to avoid that is to decide what your “order table” is, and treat everything else as inputs that feed it. Your order table should have one row per order, with consistent columns like order ID, order date, channel, customer region (if you use it), fulfillment status, gross sales, discounts, taxes, shipping charged, and refund amount. If you also need line-level detail for SKU analysis, keep that in a separate table and relate it back to orders, rather than trying to do everything in one massive export.
If your storefront is built on an open, , you usually have more control over how order and catalog data is structured and passed into downstream tools. The dashboard stays easier to maintain when exports use stable identifiers and predictable schemas, because Excel can refresh and reconcile without you re-mapping fields every time you add a channel or adjust the checkout flow.
Set up the workbook to stay clean
A clean workbook structure makes a bigger difference than any single chart type. You want the file to behave like a system, not a one-off report.
Give your raw data its own place and keep it separate from anything “pretty.” The raw data area is where exports land and where your transformations happen. The analysis area is where pivots, measures, and intermediate tables live. The dashboard area is where you place the visuals and summaries that someone can scan in under a minute.
If you've ever built a dashboard that worked for two weeks and then slowly broke, the usual cause is mixing raw exports, calculations, and charts on the same sheet. Separation is what keeps updates safe, and the same layout logic in Lark's keeps refreshes and changes from rippling through your visuals.
Use Power Query for easy refreshes
If you're copy-pasting exports into Excel and cleaning them by hand, your dashboard will eventually become unreliable. It only takes one skipped step or one accidental sort to create numbers that “look right” but don't match reality.
Power Query is the practical fix. It's the layer that imports files, standardizes columns, cleans text, fixes data types, and appends new data in a repeatable way. If you're pulling alongside marketplace exports, that consistency is what lets Excel refresh without breaking totals because a header moved or a date came through in a new format. Once your queries are set up, refreshing becomes a button click instead of a multi-step ritual. That's the difference between a dashboard you trust and one you constantly second-guess.
Where Power Query helps most in ecommerce tracking is normalization. It can standardize channel names, convert dates properly, split combined fields, and enforce consistent numeric formats so your pivots don't treat “100” as text and quietly drop it from totals. If you're pulling exports from multiple systems, it can also append them into a single “Orders” table as long as the columns match.
Try a smarter way to manage ecommerce data with Lark
Split data into separate tables
Ecommerce data naturally wants to be relational. Orders relate to line items. Orders relate to refunds. Orders relate to shipments. If you mash all of that into one flat table, your file becomes huge and your calculations become fragile.
A more stable approach is to keep separate tables and connect them with relationships. That's where Excel's data model and come in. You can keep an Orders table and a Line Items table, relate them by order ID, and build pivots that summarize correctly without duplicating totals.
You don't need advanced DAX to get value here. Even basic relationships reduce the classic ecommerce reporting mistakes, like counting the same order multiple times because it had multiple SKUs, or inflating revenue. After all, refunds were stored as separate rows without clean linking.
Build the dashboard around daily decisions
Once the data is clean and structured, building the dashboard in Excel becomes straightforward. The mistake most people make is starting with charts before they've decided what questions the dashboard should answer.
A practical dashboard usually has three layers. At the top, you have the “today” snapshot: orders, revenue, refunds, and net after fees (if you have that). In the middle, you have breakdowns that show where change is coming from, such as channel splits and fulfillment status splits. At the bottom, you have exceptions that someone can act on right now, like unfulfilled orders older than a threshold, orders with address issues, or refunds that haven't been processed.
If you're choosing between layouts, bias toward clarity over cleverness. It should be obvious what changed, where it changed, and what needs attention. If someone has to hover, filter, and interpret to understand whether you're behind on fulfillment, the dashboard isn't doing its job.
Track exceptions your team can fix
Order tracking becomes valuable when it highlights “what's stuck,” not just what happened. Exceptions are where ops time goes, so your dashboard should make exceptions easy to find and easy to sort.
That typically means an exception view that's basically a table, not a chart. It can list orders that missed an SLA, orders marked delivered but refunded, orders with partial fulfillment, or orders with unusual fee patterns. What matters is that it's filterable by channel and by fulfillment path, because the right owner depends on where the problem started.
If you want a clean way to structure a daily exceptions habit, it helps to pair your dashboard with a lightweight daily cadence so the same questions get answered consistently, like Lark's that keeps owners and follow-ups obvious.
Share the dashboard without breaking it
One of the biggest hidden problems with Excel dashboards is version drift. Someone duplicates the file. Someone edits a formula. Someone filters and saves. Two weeks later you have three “official” dashboards and none of them match.
The best prevention is to design the workbook so it's safe to view but harder to accidentally break. Keep your raw data and query steps away from the dashboard sheet. Use simple slicers and pivot filters that reset cleanly. If you need multiple stakeholders to interact with it, consider distributing a view-only version while keeping a single maintained source file for refreshes and structural changes.
If your team also runs some reporting in Sheets, it's worth keeping parity in how you define metrics so “orders” means the same thing everywhere, using the same breakdown pattern you'd use in Lark's .
When Excel isn't enough
Excel is great for a lot of ecommerce tracking, especially when you're getting your arms around multi-channel data for the first time. But it's not the right tool for everything forever.
If you find yourself maintaining complex joins across multiple exports, or if your refresh depends on manual downloads from several systems, you'll hit the point where the dashboard becomes a maintenance burden. That's usually the signal to improve the upstream data flow first, because no dashboard can compensate for unstable inputs. Even if you stay in Excel, the win comes from making exports consistent, identifiers stable, and definitions shared across systems.
Switch to Lark that makes order tracking dashboards live
Track order for your ecommerce business with Lark: A smart option
is an all-in-one collaboration and productivity platform designed to streamline workflows and enhance communication for e-commerce teams managing order tracking.
At the heart of Lark's powerful capabilities is , a flexible database tool that allows teams to customize order tracking with multiple types of fields—such as text, dates, dropdowns, checkboxes, and attachments—tailored to capture every detail of the order process. This flexibility ensures that teams can manage complex order data efficiently and accurately.
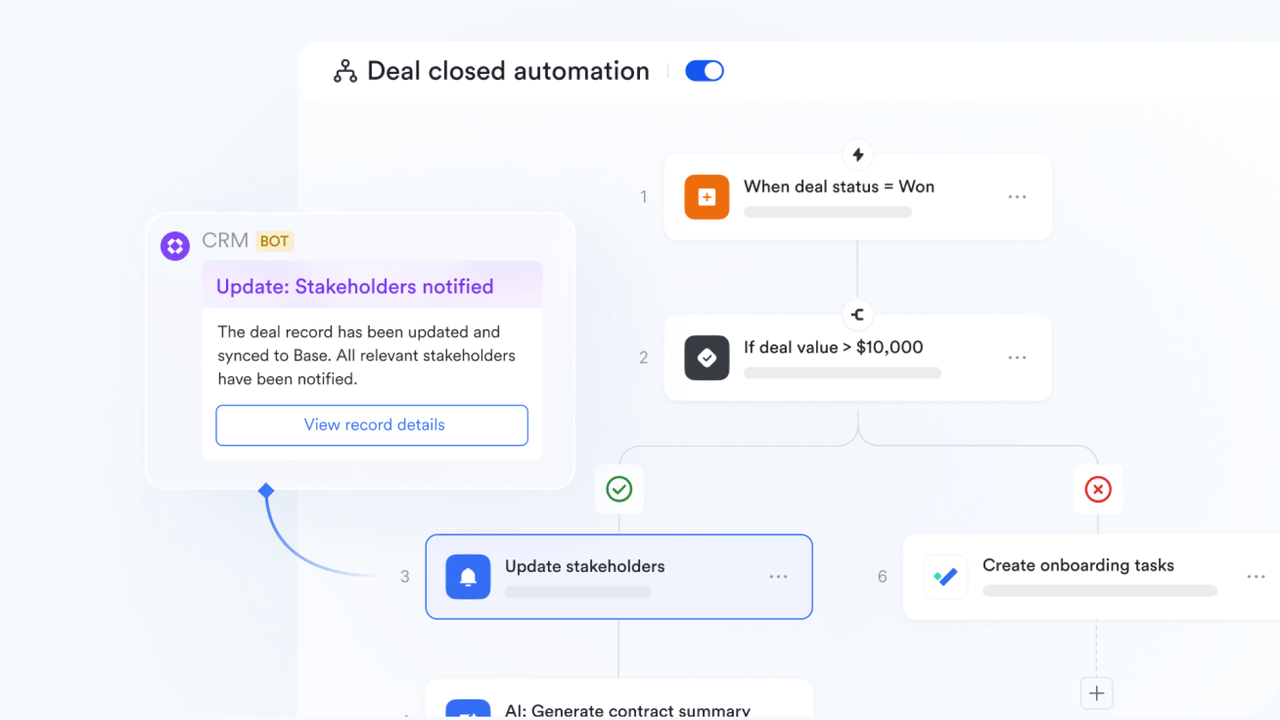
To automate repetitive tasks and keep orders moving smoothly, Lark offers robust within Lark Base. These workflows can trigger notifications, status updates, or task assignments automatically based on order progress, reducing manual work and minimizing errors. Teams can also visualize order statuses and key metrics in real time with visual dashboards, providing instant insights into order volumes, delivery timelines, and bottlenecks, all in one centralized view. 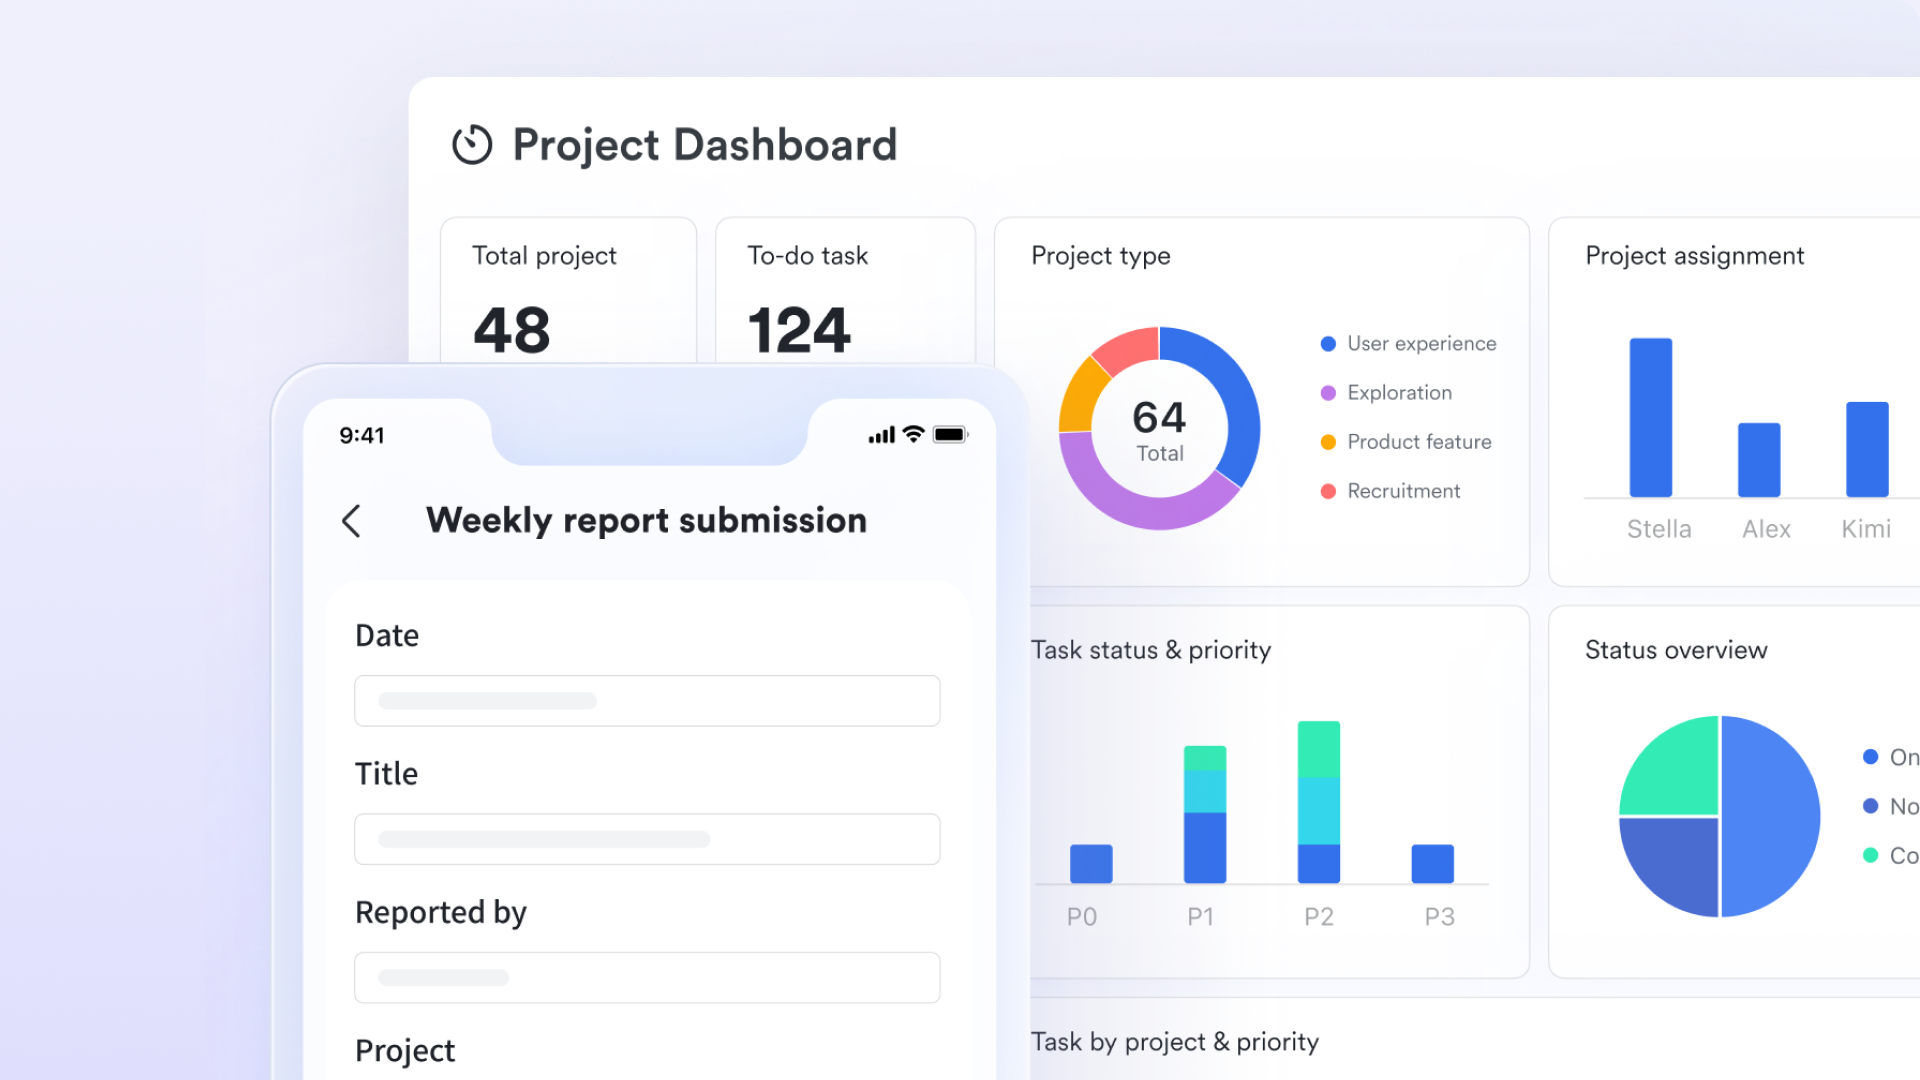
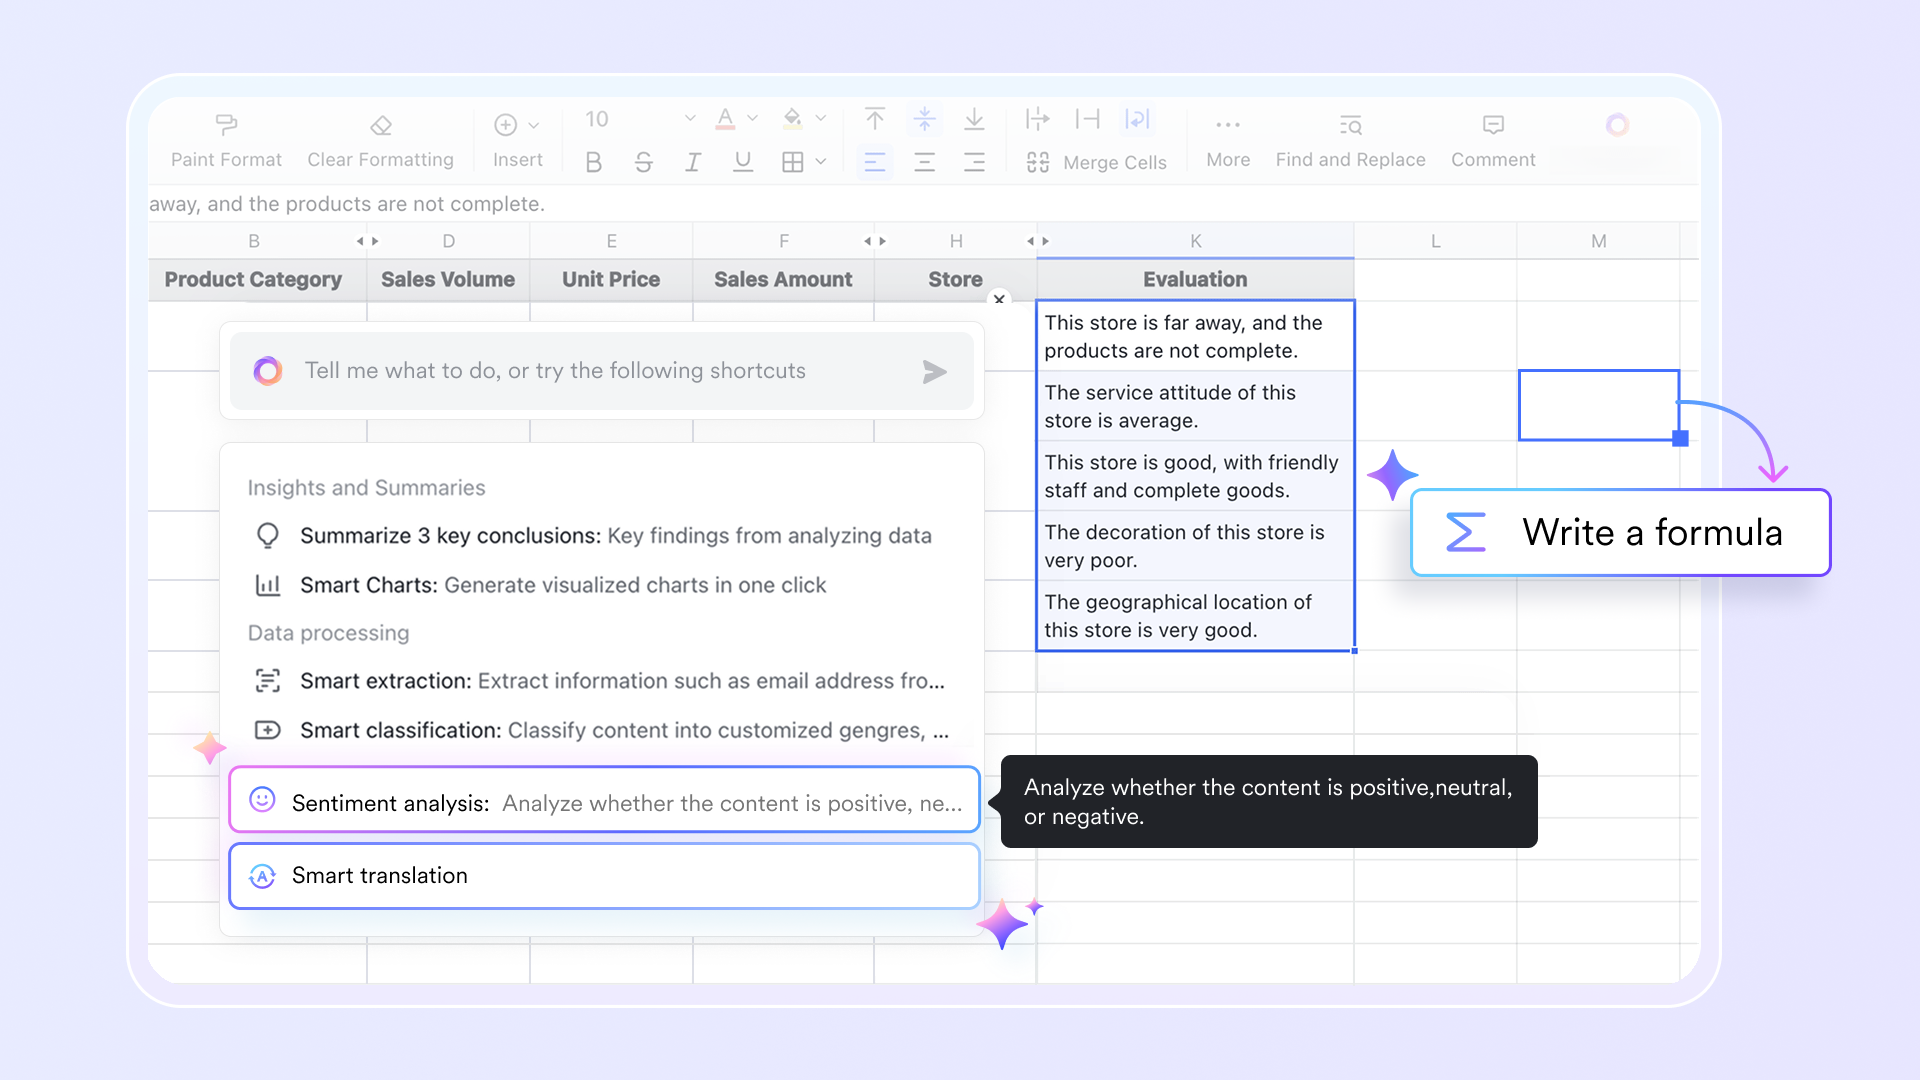
Complementing Lark Base is , a cloud-native spreadsheet tool that is built in seamlessly for detailed data analysis and reporting, allowing e-commerce teams to manipulate order data with familiar spreadsheet functions while staying connected to the broader Lark ecosystem.
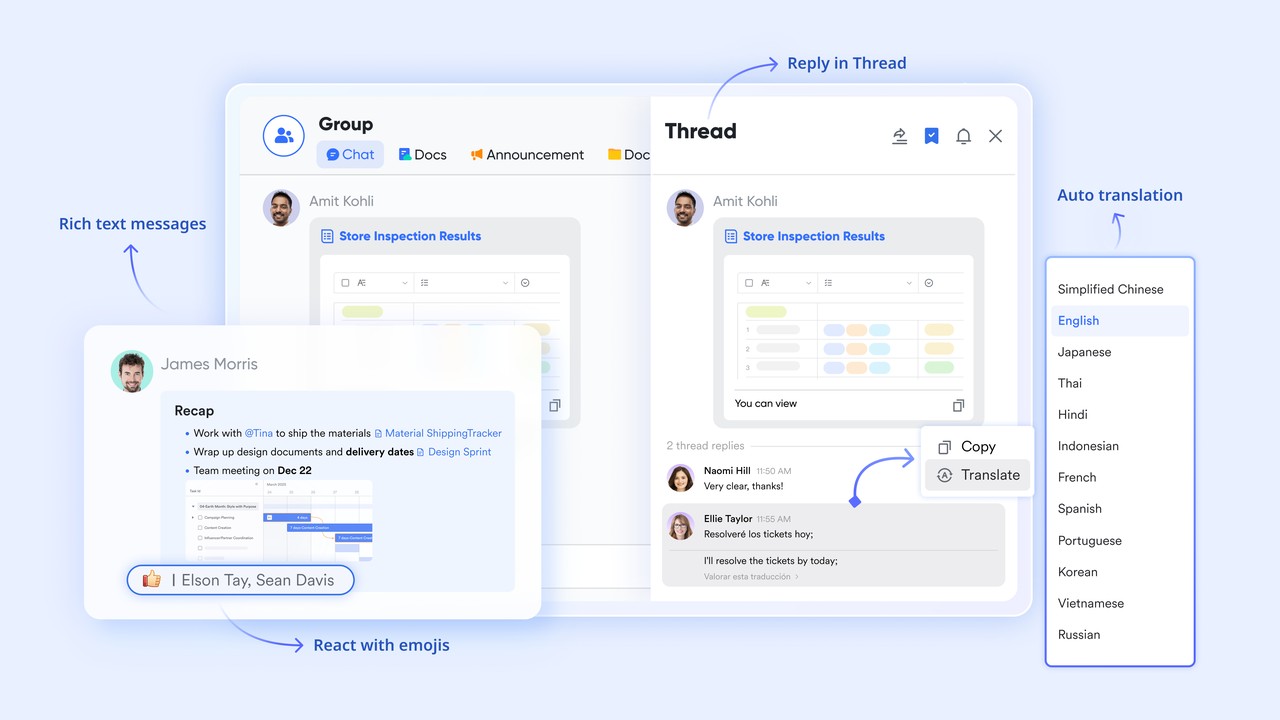
Effective communication is critical in order tracking, and Lark excels here with its Lark Messenger—a real-time chat platform that supports group conversations and direct messaging, enabling team members to quickly discuss order issues, share updates, and collaborate without leaving the workspace.
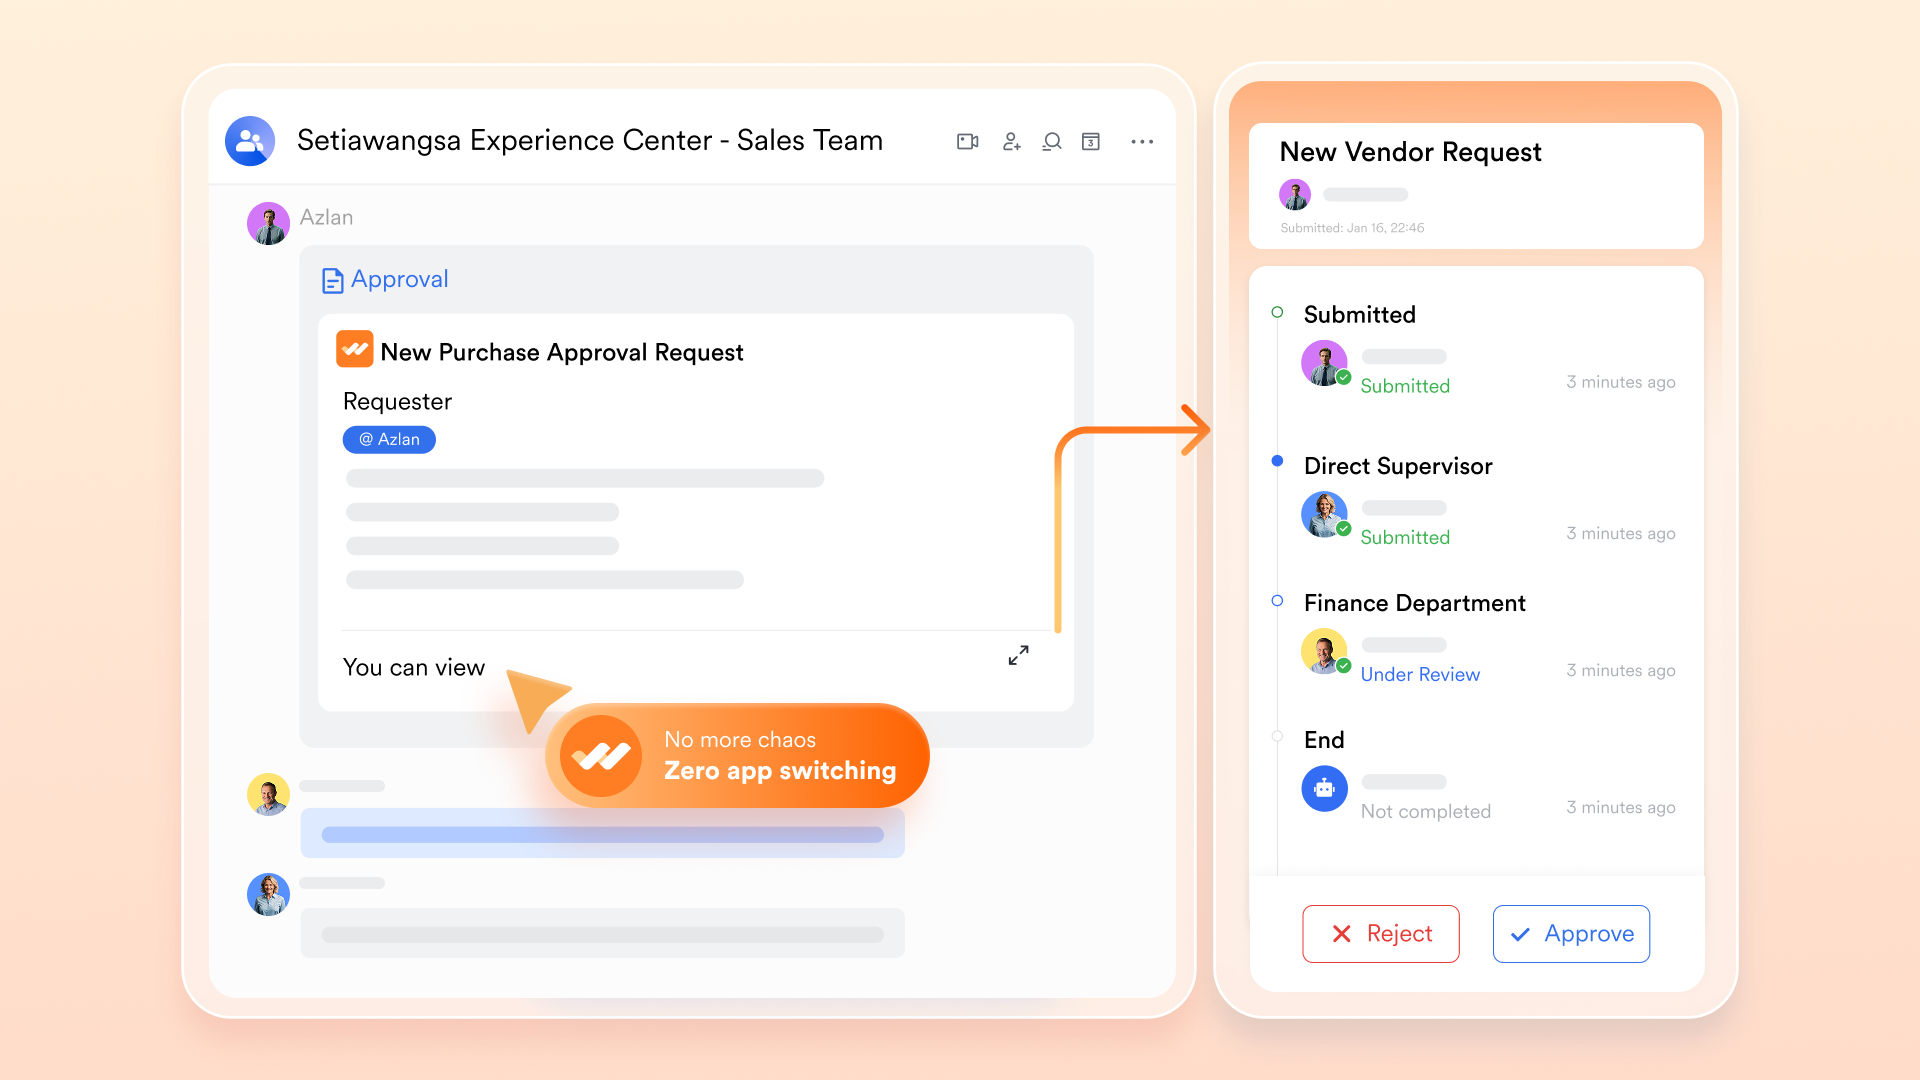
When approvals are required, such as for refunds or special order requests, the function streamlines the process by routing requests to the right stakeholders with customizable approval workflows, ensuring decisions are made swiftly and transparently.
Together, these features make Lark an exceptional project collaboration tool for e-commerce teams, empowering them to manage orders efficiently, improve team communication, and deliver better customer experiences.
:
- Starter plan: that includes 11 powerful tools for up to 20 users. It also comes with 100GB of storage space, 1000 automation runs, AI translations, and more. No credit card needed.
- Pro plan: (billed annually) for up to 500 users. It includes everything in Starter plus group calling for up to 500 attendees, 15TB of storage space, 50,000 automation runs, and more.
- Enterprise plan: for custom pricing. Supports unlimited users and includes even more automation runs and advanced security, compliance, and management features.
For small teams with simple communication needs

18 months message history
1000 Base automation runs/month
2000 rows per table in Base
Most POPULAR
For companies with comprehensive collaboration and management needs
Unlimited message history
500-participant video meetings
50k Base automation runs/month
20k rows per table in Base
For large companies with advanced security and organizational management needs
Get a personalized demo and pricing
Unlimited message history
500-participant video meetings
15 TB storage + 30 GB storage/user
500k Base automation runs/month
50k Base automation runs/month
Most POPULAR
For companies with comprehensive collaboration and management needs
Unlimited message history
500-participant video meetings
50k Base automation runs/month
20k rows per table in Base
Conclusion
A dashboard in Excel for ecommerce order tracking works when it cuts through noise and points to action. Clean inputs, consistent definitions, and repeatable refresh steps matter more than fancy visuals. Once your orders, refunds, and fulfillment status are structured in a stable way, the dashboard becomes something you can rely on every morning, not something you rebuild every week.
If you keep the workbook maintainable, tie it to real operational questions, and track exceptions in a way your team can actually resolve, the dashboard in Excel becomes a calm, reliable layer in your day instead of another moving piece. You can also try new alternatives like Lark that include dashboards and tracker functions to experience seamless collaboration without switching tools.
FAQs
Related reading