


Pipeline Report: Track, Analyze, and Optimize Your Sales Funnel

Ryan Tanner
Product Marketing Specialist
Aug 5, 2026
Ryan Tanner
Aug 5, 2026

16 min read


A pipeline report is an essential tool for sales teams to track deals, monitor performance, and forecast revenue accurately. It provides real-time visibility into every stage of the sales process—from prospecting to closing—helping leaders make informed, data-driven decisions. By analyzing deal values, conversion rates, and probabilities, teams can identify growth opportunities and address bottlenecks before they affect results.
However, traditional pipeline reporting often relies on static spreadsheets or disconnected systems, leading to delays and errors. Modern platforms like Lark simplify this process by combining data management, communication, and automation in one workspace. With real-time updates and collaborative dashboards, Lark helps teams transform their pipeline reports into actionable insights that drive alignment and predictable growth.

What is a pipeline report?
A pipeline report is a visual summary that tracks all active deals within your sales pipeline, showing where each opportunity stands and its potential revenue impact. Often referred to as a sales pipeline report, it helps sales managers and teams monitor progress, analyse deal health, and forecast future revenue. Unlike a simple pipeline report template or spreadsheet, it provides a dynamic view of the entire funnel—from initial contact to closed deals—allowing teams to identify stalled opportunities and optimize performance.
Many businesses use a CRM sales pipeline report to ensure that every stage, probability, and expected close date is accurately captured. Whether you're managing a small sales team or scaling an enterprise operation, a well-structured pipeline report offers the clarity needed to make smarter decisions, prioritize high-value deals, and achieve consistent sales growth with confidence and precision.
Key components of a sales pipeline report
An effective pipeline report breaks down complex sales data into structured, actionable insights. Each component plays a vital role in helping teams track progress, evaluate performance, and forecast revenue with confidence. Understanding these key elements ensures that your reporting remains accurate, consistent, and strategically useful across all sales operations.
- Deal stages: Deal stages represent the specific steps a lead takes from first contact to closing the deal. Common stages include prospecting, qualification, negotiation, and contract signing. Clearly defining these stages helps teams measure conversion rates and identify where deals are stalling.
- Deal value: Deal value indicates the potential revenue tied to each opportunity in the pipeline. Tracking this metric helps sales managers prioritize high-impact deals and focus resources where they matter most. It also supports accurate revenue forecasting.
- Probability: The probability field estimates how likely a deal is to close based on its current stage. Assigning percentages to each stage provides weighted forecasting, enabling teams to anticipate revenue with greater accuracy and precision.
- Owner and activity data: Every deal should have a clearly defined owner responsible for updates and follow-ups. Tracking activities like calls, emails, and meetings helps measure engagement and ensures accountability across the sales team.
- Expected close date: The expected close date indicates when a deal is likely to convert. This timeline helps teams forecast revenue for specific months or quarters and manage workloads efficiently. It also signals when deals need re-engagement.
- Cumulative pipeline value: This represents the total potential and weighted value of all deals in the funnel. By monitoring cumulative pipeline value, leaders can gauge the overall health of the sales process and assess whether targets are achievable.
Common types of pipeline reports
A sales pipeline report is only as effective as the data it captures. To turn numbers into actionable insights, every report should include key components that reflect deal progress, value, and ownership. These elements help teams track opportunities accurately, forecast revenue confidently, and maintain full visibility across the sales funnel.
How to create an effective pipeline report
Building an effective pipeline report requires more than just tracking deals—it's about creating a clear, dynamic view of your entire sales process. A well-designed report helps sales teams identify bottlenecks, improve forecasting accuracy, and keep every department aligned around shared goals. Here's how to create one that delivers real business impact:
- Define your pipeline stages: Start by mapping your sales pipeline report to reflect your actual sales process. Each stage—from prospecting to closing—should represent a meaningful milestone in the buyer's journey. Clearly defined stages make it easier to measure conversion rates, track deal progress, and identify where opportunities tend to slow down.
- Capture the right data: Ensure your pipeline report template includes essential fields like deal value, probability, stage, and owner. Comprehensive data allows teams to analyze performance, forecast revenue, and assign accountability. Consistency is key—every record should be updated regularly and follow the same data standards.
- Use automation to reduce manual updates: Manual reporting often leads to errors and outdated information. Implement automation rules to keep your CRM sales pipeline report accurate and up to date. Automation can trigger follow-up reminders, update deal stages based on activity, or alert team members when deals remain idle for too long. This saves time and improves data reliability.
- Visualize data clearly: Numbers alone don't tell the full story. Use charts, dashboards, and color-coded visuals to highlight key trends and performance metrics. A well-visualized report allows stakeholders to quickly interpret insights, spot risks, and make timely decisions without sifting through spreadsheets.
- Share reports across teams: A sales pipeline report shouldn't live in isolation. Sharing it across marketing, operations, and leadership ensures everyone has access to consistent insights. When teams collaborate around the same data, strategies align, and sales performance improves collectively.
- Review and iterate: Your pipeline report should evolve as your business grows. Regularly review performance metrics, evaluate forecasting accuracy, and refine stages or probabilities to reflect real outcomes. Continuous improvement keeps your reporting relevant, reliable, and aligned with changing sales dynamics.
Challenges in traditional pipeline reporting
Traditional pipeline reporting often struggles to keep pace with the speed and complexity of modern sales operations. While the goal is to maintain visibility into deals and performance, outdated methods and disconnected systems can make the process time-consuming and error-prone. Here are some of the most common challenges sales teams face when managing pipeline reports manually.
- Manual data entry errors leading to unreliable forecasts: When reports rely on manual updates, human error becomes inevitable. Incomplete entries, outdated deal statuses, or incorrect probabilities can distort revenue forecasts and mislead decision-making. Over time, this creates gaps between projected and actual results, making it difficult for leaders to trust the data.
- Lack of visibility across teams using separate systems: Many organizations use different platforms for CRM, communication, and document management, leading to fragmented information. When sales, marketing, and operations track data in separate systems, teams lose the ability to see the full picture. This disconnect reduces efficiency and often causes misalignment between departments.
- Delayed updates due to siloed reporting processes: When data flows through multiple tools and approvals, updates become slow and inconsistent. By the time a report is reviewed, it may already be outdated. These delays make it hard for sales leaders to respond quickly to changes in the pipeline or adjust strategies in real time.
- Limited collaboration between sales, marketing, and operations: Pipeline reports are most effective when all departments contribute to and use them. However, in many businesses, these reports are built and maintained by sales teams alone. Without shared access, marketing and operations lack visibility into pipeline health, making it harder to align campaigns, budgets, and resource planning.
- Overly complex tools that make adoption slow and reporting inconsistent: Some CRM and reporting platforms are powerful but overly complicated. When tools require advanced technical skills, adoption rates drop and updates become inconsistent. Teams may revert to spreadsheets or informal tracking, resulting in disorganized data and incomplete insights that hinder strategic planning.
Meet Lark: Collaborative solution for real-time pipeline reporting
Lark transforms traditional pipeline reporting into a live, connected experience where data, communication, and action come together seamlessly. Instead of relying on static spreadsheets or delayed updates, teams can monitor sales progress, project milestones, and performance metrics in real time—all within one workspace.
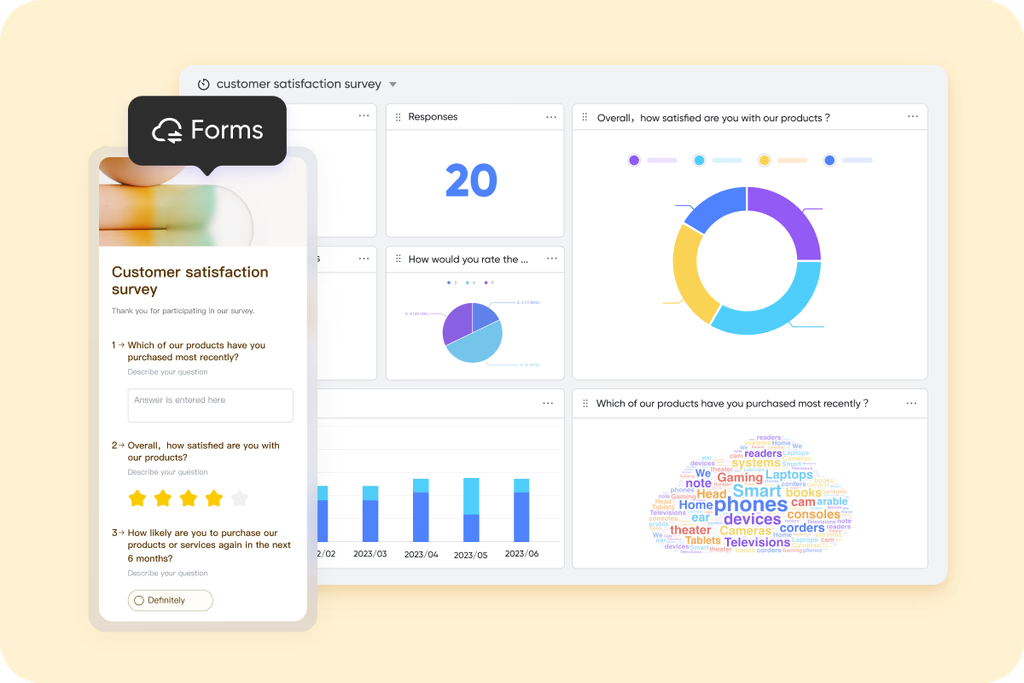
Lark Forms: Capture leads and data with streamlined flow
Lark Forms support pipeline reporting by capturing lead and opportunity data in a clean, structured format that flows directly into Lark Base. Submissions can automatically create or update pipeline records through automations, reducing manual entry and ensuring accuracy. Standardized fields help sales teams maintain consistent qualification criteria, improving forecast reliability. Form responses can then feed into Base dashboards, giving real-time visibility into deal stages, volume, and movement. This creates a smoother, data-driven workflow for building and updating pipe reports.
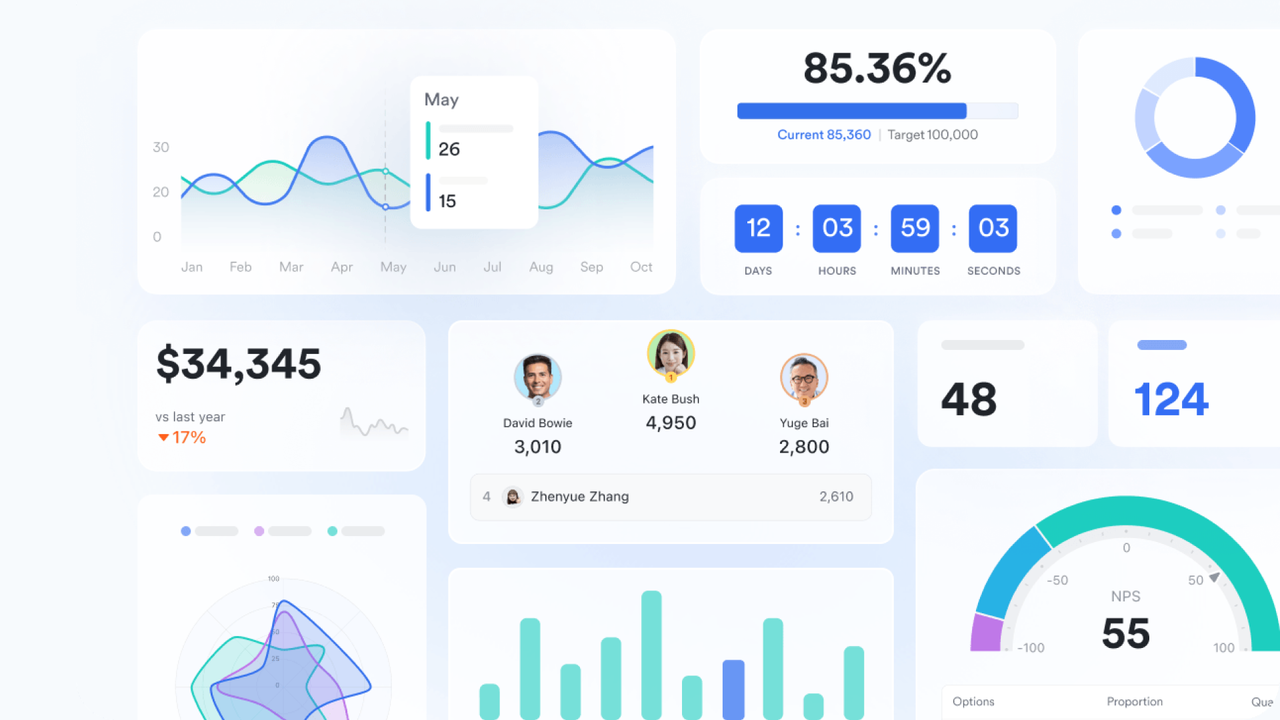
Lark Base dashboards: Real-time data visualization and analysis
Lark Base enables real-time reporting through interactive dashboards that turn raw data into actionable insights. Teams can analyze information using column, bar, line, and combo charts, viewing performance from multiple perspectives. Metrics blocks make it easy to monitor essential KPIs, such as sales revenue, conversion rates, or project progress, in one centralized view; Ranking blocks display real-time leaderboards for members, teams, or projects.
Also, the dashboard includes area charts, radar charts, and NPS charts. These views enable teams to analyze multidimensional data—from customer satisfaction scores to workload distribution—making complex analytics easier to comprehend and share.
Lark Docs: Kick off your reports with templates and handy elements
Lark Docs supports pipeline reporting by providing ready-made templates that standardize how teams capture daily, weekly, or monthly sales updates. Teams can use formats like Weekly Reports to log pipeline movements, with form responses feeding directly into embedded tables for organized tracking. Additional deal notes, blockers, or context can be added inline to give managers deeper visibility. With real-time collaboration, comments, and shared editing, sales teams maintain a single, transparent document that keeps pipeline progress aligned and up to date.
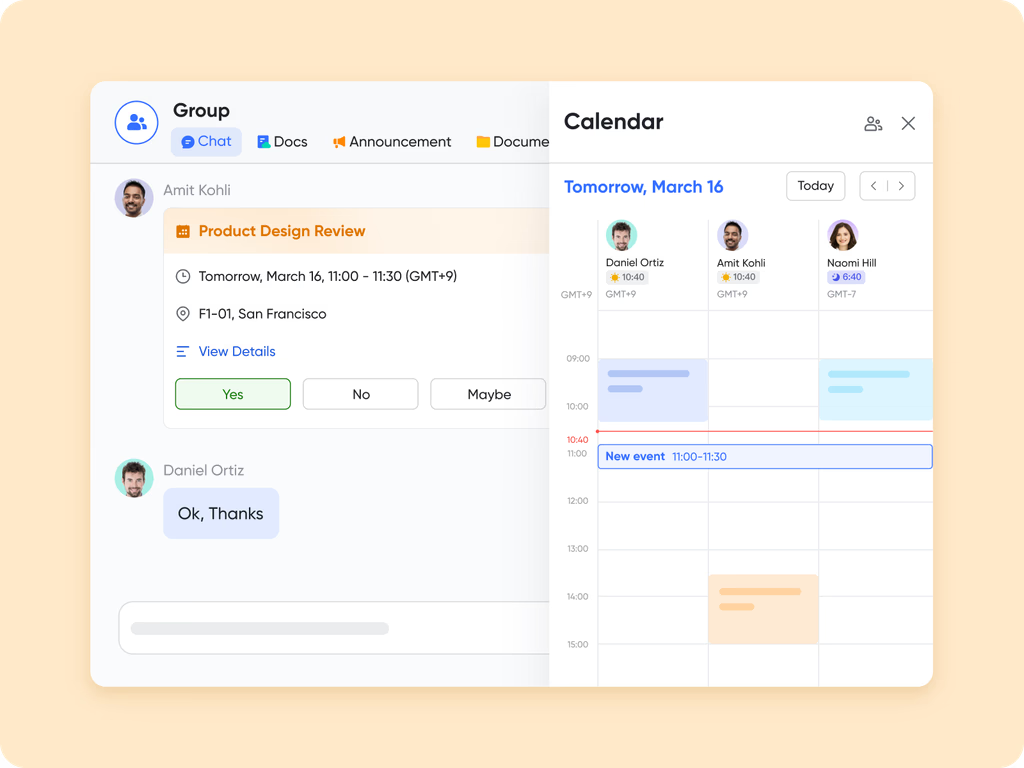
Lark Calendar: Schedule your reports and arrange key milestones
Lark Calendar supports pipeline reporting by making key sales milestones visible and trackable across teams. You can create a shared project calendar to mark stage deadlines, forecast reviews, and deal-closing targets, ensuring everyone understands upcoming commitments. Publishing these milestones promotes accountability and keeps progress aligned across sales, marketing, and operations. Teams can subscribe to the calendar for full visibility, while scheduled check-ins—such as weekly pipeline reviews—help maintain consistent communication and ensure the pipeline stays on track.
- Starter plan: Free forever plan that includes 11 powerful tools for up to 20 users. It also comes with 100GB of storage, 1000 automation runs, AI translations, and more.
- Pro plan: $12/user/month (billed annually) for up to 500 users. It includes everything in Starter plus group calling for up to 500 attendees, 15TB of storage, 50,000 automation runs, and more.
- Enterprise plan: Contact sales for custom pricing. Supports unlimited users and includes even more automation runs and advanced security, compliance, and management features.
Bonus: Ready-to-use Pipeline report templates
Creating a pipeline report from scratch can be time-consuming, especially when consistency and accuracy are key. Ready-to-use templates help teams get started quickly with structured fields, visual dashboards, and automated tracking. These templates make it easier to organize deals, monitor progress, and maintain real-time visibility across the entire sales funnel.
Daily sales forecast report template
The Daily sales forecast report template is a comprehensive tool designed to help businesses track, analyze, and forecast their daily sales. It provides a clear and concise overview of your sales data, allowing you to identify trends, monitor performance, and make informed decisions. The template includes sections for recording daily sales figures, comparing them against targets, and analyzing the data to forecast future sales. It also includes visual aids such as charts and graphs to help you better understand your sales trends.
Sales funnel template
Managing your sales pipeline and tracking deals can be a complex process. That's why we've created this sales funnel template to help you streamline your sales process and effectively manage your deals. With Lark's powerful features, you can easily track the progress of each deal, assign tasks to team members, and monitor the overall performance of your sales team. Whether you're a small business owner or a sales manager in a large organization, this template will provide you with the tools you need to close deals faster and increase your revenue.
Analytics dashboard template
An analytics dashboard template is a powerful tool that allows you to visualize and track key metrics in one central location. With Lark's intuitive features, you can easily create custom dashboards that display real-time data on total sales, new subscribers, website traffic, customer satisfaction, product returns, production volume, operational costs, and inventory levels. Whether you're a data analyst, marketing manager, or business owner, this template will help you make informed decisions based on accurate and up-to-date information.
Project pipeline template
Keeping track of multiple projects can be a daunting task. With our Project pipeline template, you can easily manage all your projects in one place. This template allows you to track project IDs, names, descriptions, stages, priorities, team members, estimated and actual start and end dates, progress, and notes. It provides a clear overview of all your projects, making it easier to monitor progress and make necessary adjustments.
Why pipeline reporting is important for sales teams
A well-structured pipeline report is more than just a sales tracking tool—it's a performance engine that drives clarity, accountability, and growth. By offering real-time visibility into deals, team activities, and revenue potential, pipeline reporting helps sales leaders make data-backed decisions that improve forecasting accuracy and overall team efficiency. Here's why it's essential for every sales organization:
- Improved forecasting: A sales pipeline report helps teams predict revenue with greater accuracy by tracking deal stages, values, and probabilities. This ensures leaders can anticipate outcomes and plan resources effectively.
- Performance visibility: Pipeline reporting provides transparency into team activity, highlighting top-performing reps and stalled deals. It helps identify sales cycle bottlenecks and areas for coaching or process improvement.
- Resource allocation: By analyzing pipeline report data, managers can adjust marketing focus, reassign leads, or prioritize follow-ups. This ensures effort and budget are directed toward the most promising opportunities.
- Strategic planning: Regular pipeline reviews align short-term actions with long-term business goals. Teams can compare real-time progress against quarterly targets, improving strategy, focus, and accountability.
Conclusion
A well-structured pipeline report is one of the most powerful tools a sales team can have. It provides real-time visibility into deals, helps forecast revenue accurately, and aligns departments around shared performance goals. However, traditional reporting methods often struggle with manual data entry, limited collaboration, and disconnected systems that slow progress. As sales environments evolve, businesses need flexible, integrated solutions that simplify data tracking and promote cross-functional visibility.
Platforms like Lark address these challenges by connecting communication, data management, and automation in one unified workspace. Teams can create dynamic dashboards, update reports in real time, and turn insights into immediate actions—all without switching tools. Whether used alongside an existing CRM or as a collaborative reporting hub, Lark enables a more efficient, transparent, and data-driven approach to sales management, ensuring that every opportunity moves forward with clarity and purpose.
FAQs
What is the difference between a pipeline report and a sales forecast?
A pipeline report tracks all ongoing deals and their progress through various sales stages. A sales forecast, however, focuses on predicting future revenue based on deal probabilities and expected close dates. Together, they provide a complete view of sales performance and potential growth.
How often should you review your pipeline report?
Sales teams should review their pipeline report weekly to maintain accuracy and identify changes early. Regular reviews help spot stalled deals, update probabilities, and adjust strategies promptly. Monthly or quarterly reviews are ideal for strategic planning and long-term trend analysis.
Can Lark replace a traditional CRM for pipeline management?
Lark isn't a traditional CRM but can complement or simplify CRM workflows. Its collaborative dashboards, automation, and shared data tools make it ideal for real-time pipeline visibility. Teams can track deals, assign tasks, and generate reports seamlessly within one workspace.
How do automation and AI improve pipeline reporting accuracy?
Automation reduces human error by keeping deal data updated automatically and triggering reminders for follow-ups. AI enhances accuracy through predictive insights, suggesting next actions or flagging risks. Together, they make reporting faster, more reliable, and less dependent on manual input.
What are the most common mistakes teams make when building pipeline reports?
Common mistakes include inconsistent data entry, unclear stage definitions, and overcomplicated report structures. Many teams also fail to update deals regularly or align metrics with actual sales goals. Avoiding these issues ensures accurate, actionable insights from every pipeline report.
Related reading
Table of contents
Start using Lark today

Manage all your work in one place
Boost team efficiency by 10x
Save up to 70% on software costs
Table of contents
Start using Lark today
Manage all your work in one place
Boost team efficiency by 10x
Save up to 70% on software costs
Keep reading









2026 Lark Technologies Pte. Ltd.
Headquartered in Singapore with offices worldwide.






Explore: