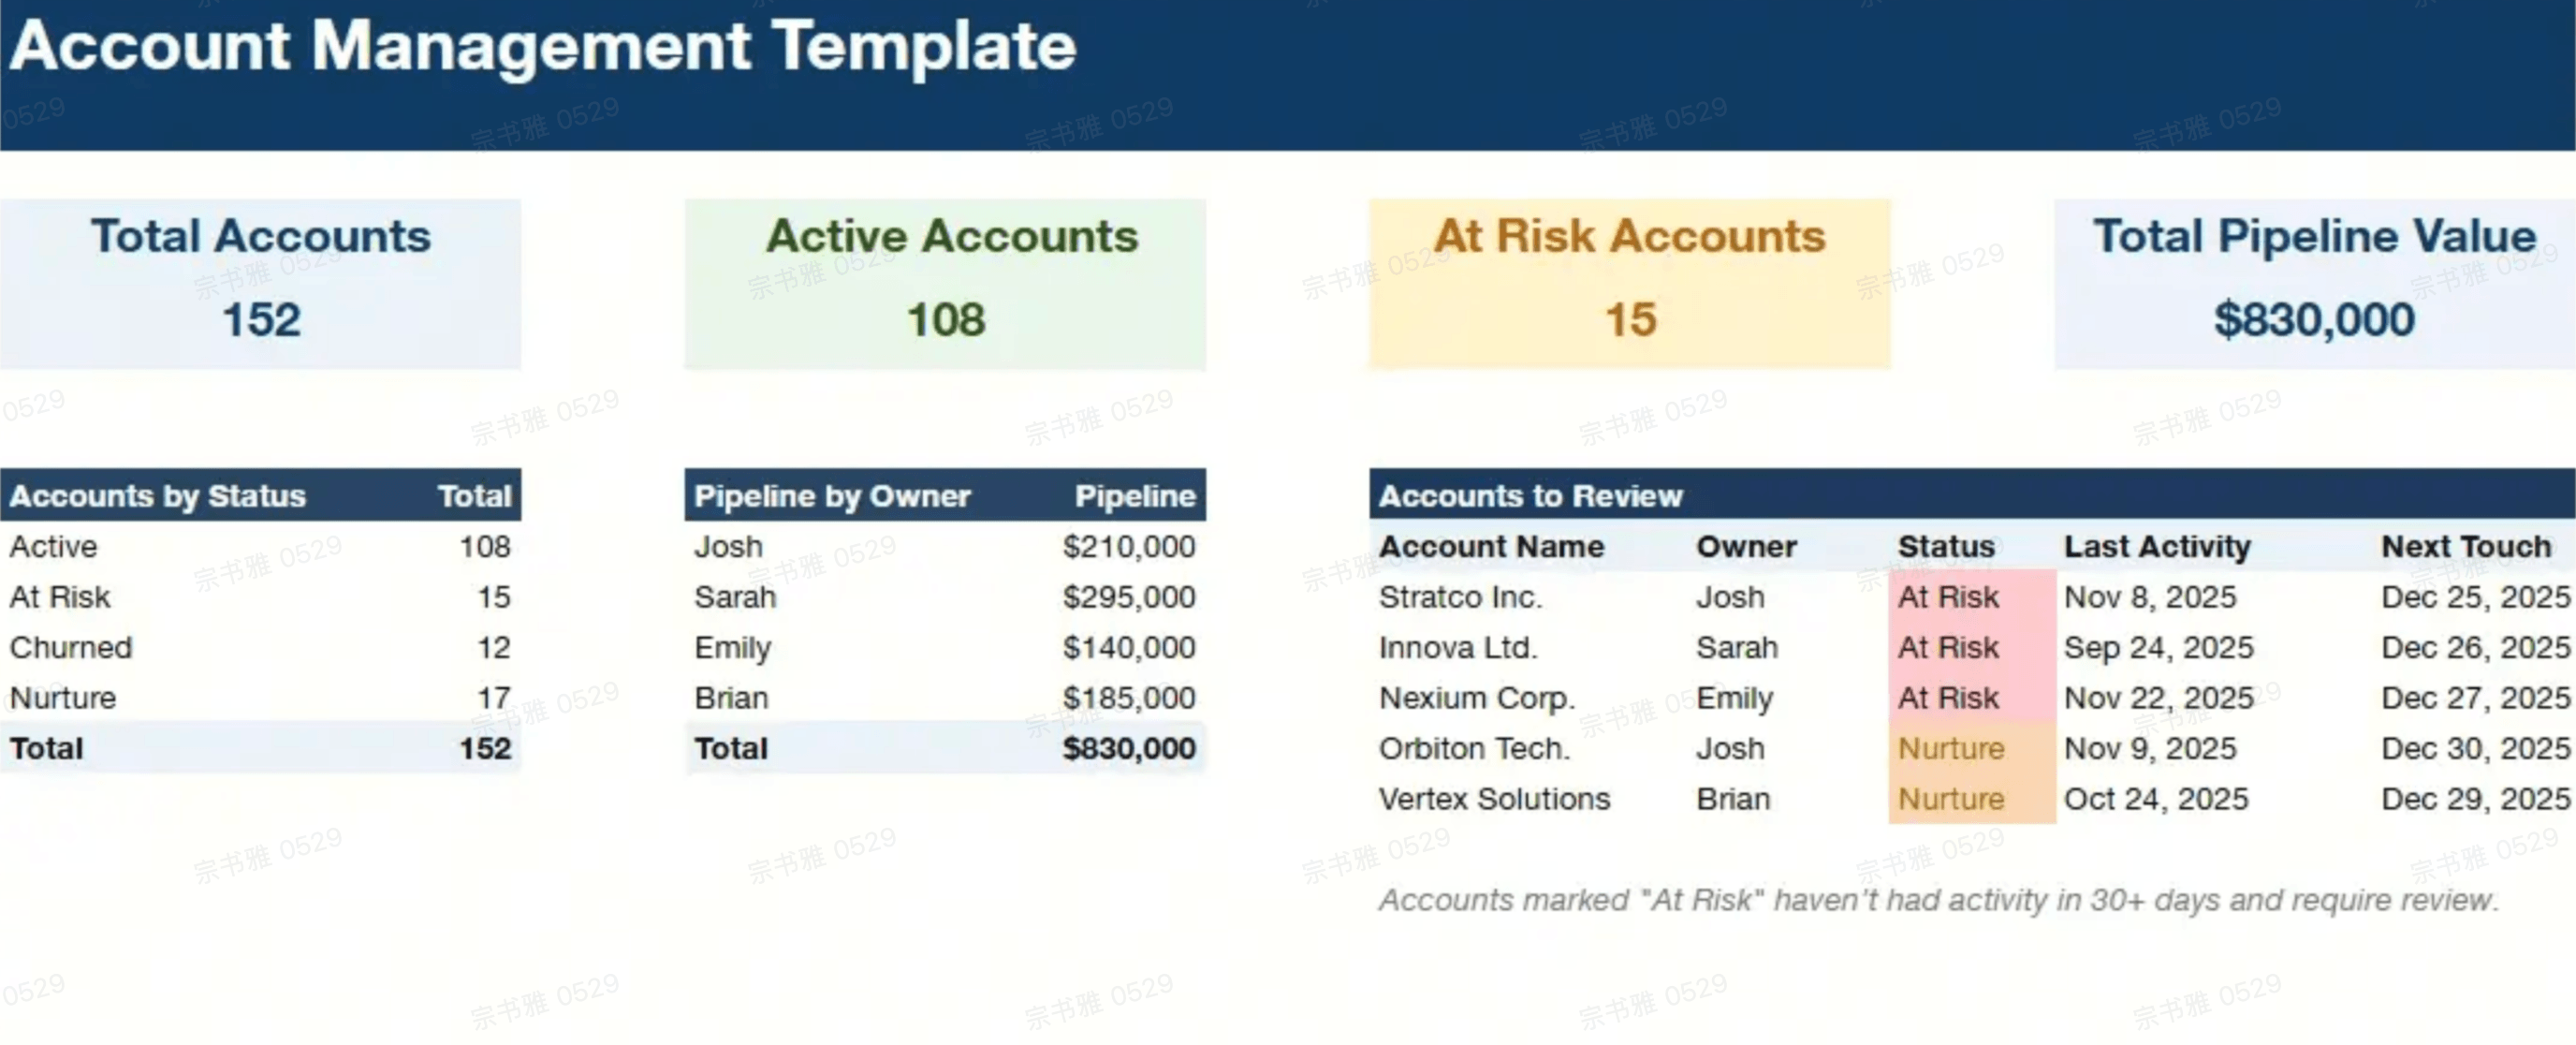
Finding the right KPI template Excel is where most businesses start their performance tracking journey. The format of a Microsoft Excel workbook is familiar, the setup is fast, and the initial cost is zero. However, while a KPI Excel template or a pre-built KPI dashboard template Excel works perfectly for small teams, the real challenge begins two weeks after launch. Data entry is falling behind, the dashboard shows last month's numbers, and the team that was supposed to act on a Red metric never received an alert.
An KPI Excel template works when someone commits to maintaining it. This guide covers what a complete Excel KPI template should include, how to build an automatically updating dashboard, the best free downloads by department, and when Excel is no longer the right foundation for the work.
What is a KPI template Excel and why use it?
A KPI template is a structured tool for tracking and measuring against defined business goals. It typically includes fields such as KPI name, target value, actual performance, status (e.g., Red/Amber/Green), owner, and reporting period.
An Excel KPI template is one of the most common formats because it is easy to set up, customizable, and widely accessible. Teams use it to monitor performance across functions like sales, marketing, operations, and finance.
The purpose of a KPI template is to create consistency in how and reviewed. It helps teams quickly identify gaps, track progress over time, and make data-driven decisions.
However, while Excel templates are a good starting point, they often require manual updates and lack real-time visibility, making tools like Lark more effective for continuous KPI tracking and action.
3 types of Excel KPI templates for performance tracking
KPI templates vary across business functions because each team tracks performance differently based on its goals and responsibilities. Sales teams focus on revenue and conversion metrics, while marketing and engagement. Operations and HR rely on efficiency, productivity, and people-related indicators to measure success.
Dashboard templates
Dashboard templates are designed to visualize KPI data through charts, graphs, and summary indicators, making performance easy to understand at a glance. They typically include elements like trend lines, comparison charts, and RAG (Red-Amber-Green) status indicators.
Scorecard templates
Scorecard templates focus on structured performance tracking against predefined targets, often aligned with strategic objectives. They include detailed KPI listings, targets, actual values, and performance ratings across categories like financial, customer, and .
Executive report templates
Executive report templates summarize KPI performance into concise, presentation-ready formats for leadership teams. They highlight key achievements, risks, and areas requiring attention, often combining narrative insights with selected visuals.
5 free Excel KPI dashboard template examples across departments
KPI templates in Excel vary by department because each function tracks performance through . A well-designed kpi template in Excel ensures that every team measures what truly impacts its outcomes.
Sales performance templates
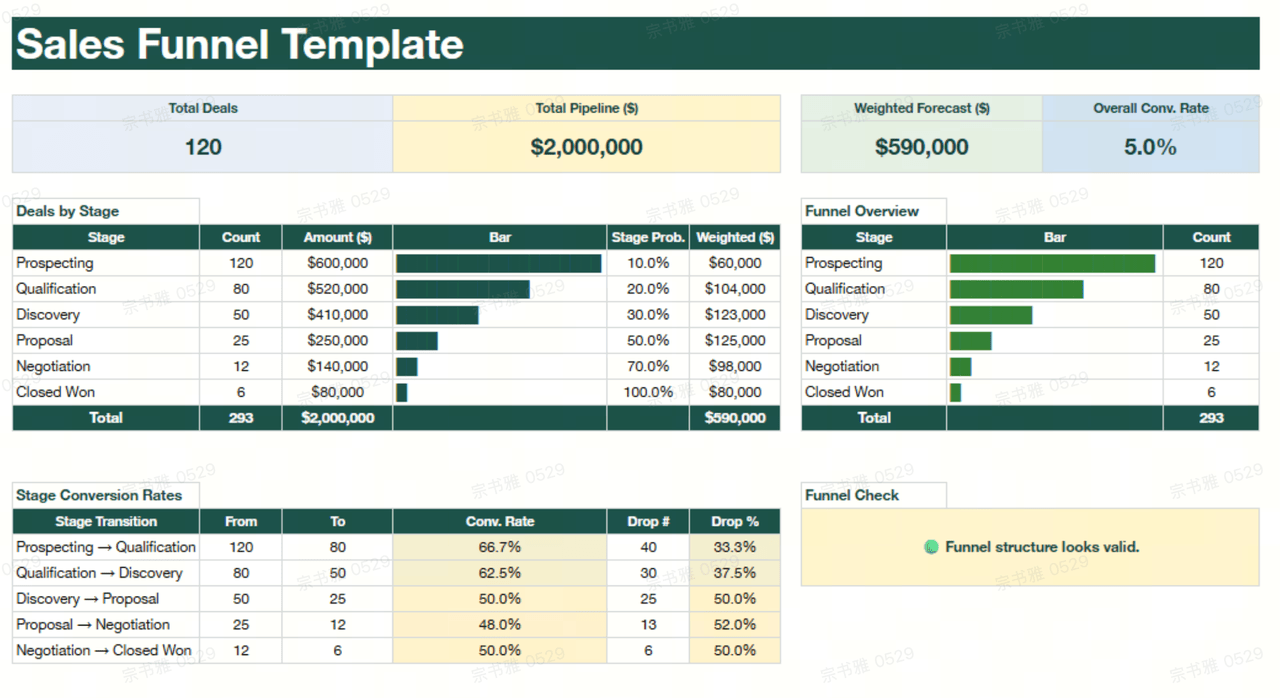
Sales KPI templates track revenue, conversion rates, pipeline value, and deal closure timelines to measure sales effectiveness. They help teams monitor individual and team performance against quotas and identify gaps in the sales funnel. An Excel KPI dashboard template for sales ensures clear visibility into growth and forecasting.
Image source: xappex.com
Marketing performance templates
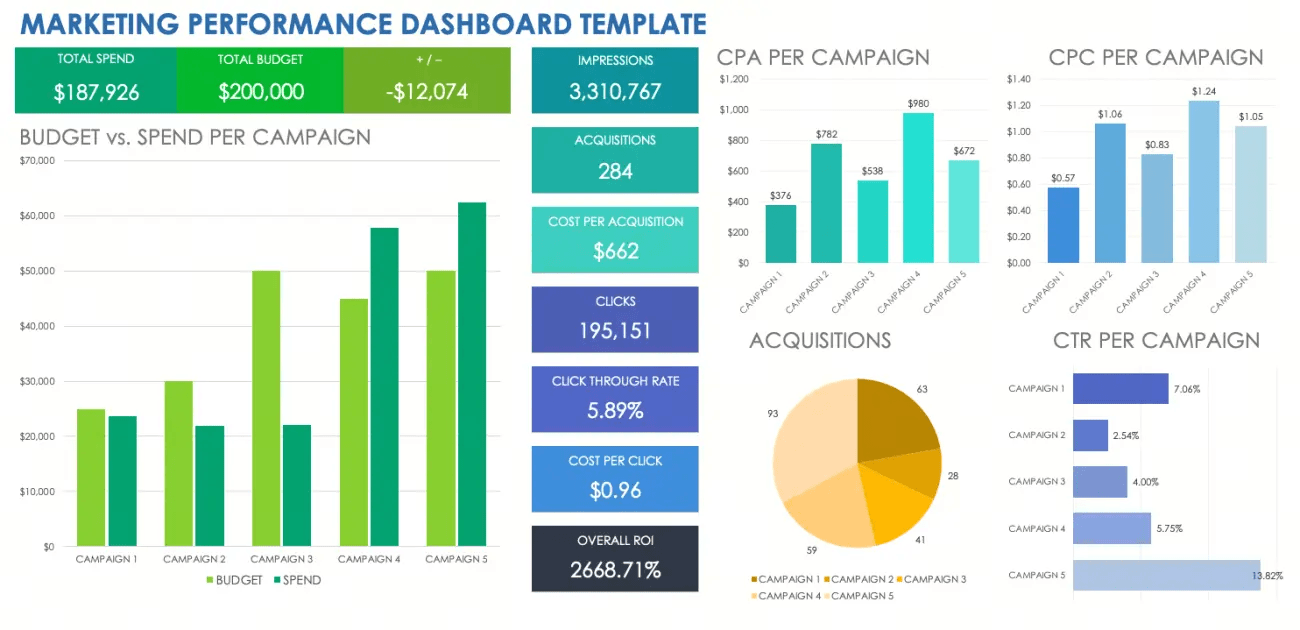
Marketing KPI Excel templates focuses on campaign performance, traffic, and customer acquisition cost (CAC). By using an Excel KPI dashboard template, the marketing team can track operational metrics and optimize budget spend in seconds.
Image source: smartsheet.com
Operations excellence templates
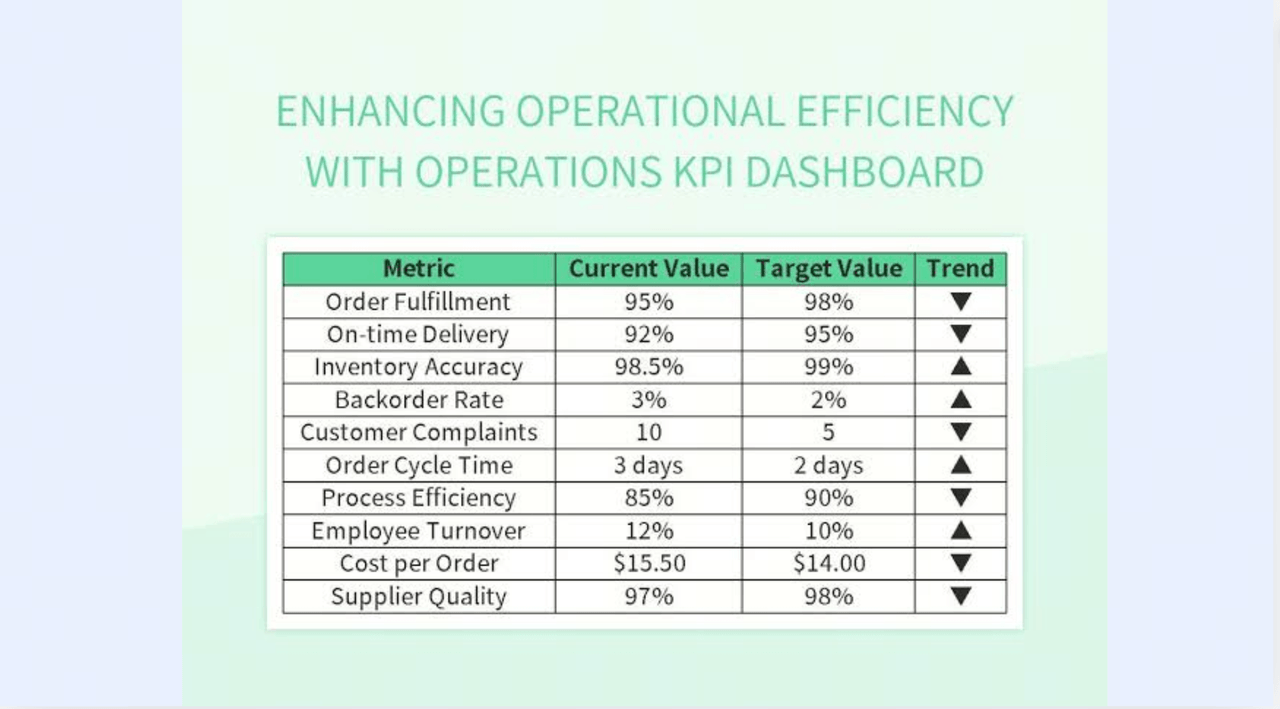
Operations KPI Excel templates measure operational efficiency, productivity, turnaround time, and resource utilization across processes. They help identify bottlenecks and improve workflow performance over time. An Excel KPI tracking template ensures of operational efficiency.
Image source: slidesdocs.com
HR performance templates
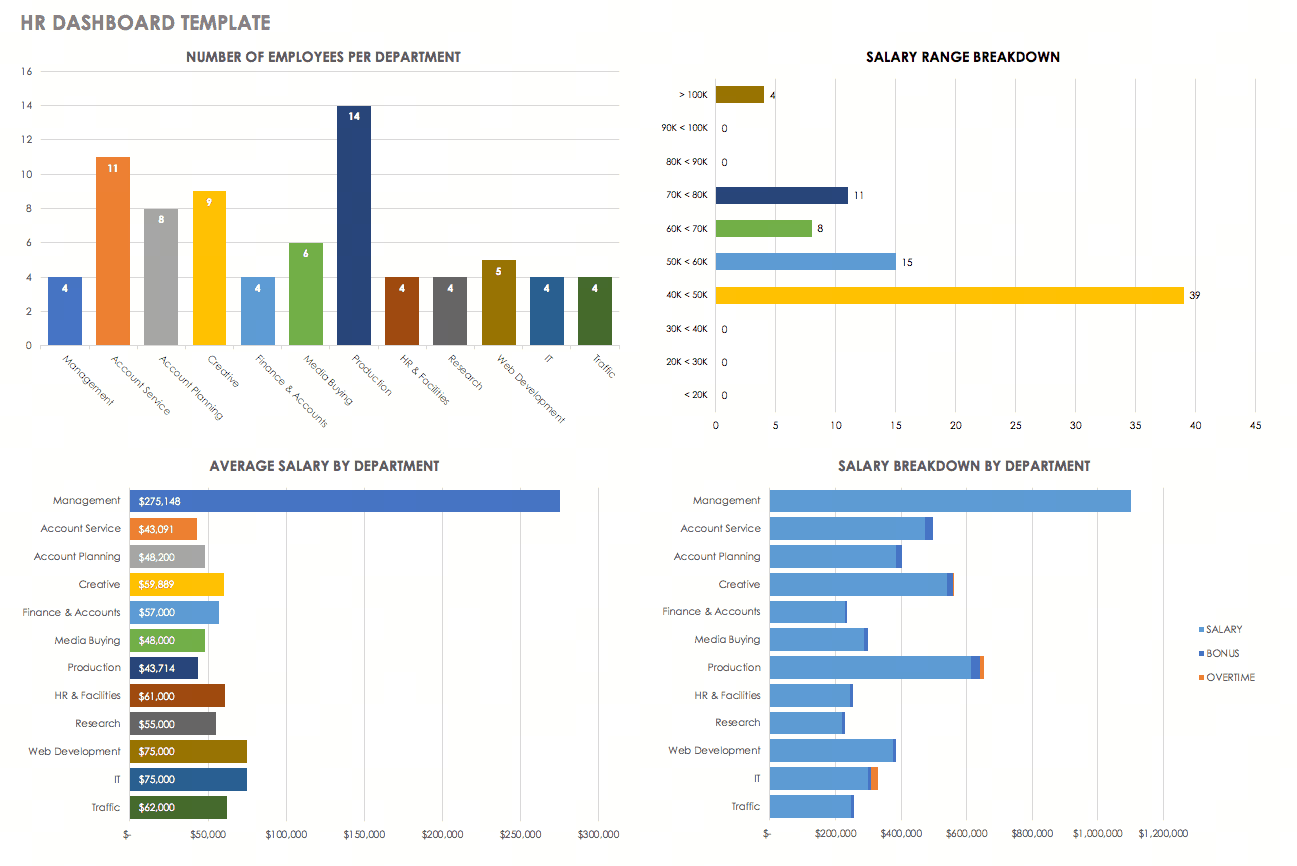
HR Excel KPI templates track employee metrics such as retention rate, hiring time, training effectiveness, and engagement levels. They support better workforce planning and performance management decisions. A KPI Excel template helps HR teams align people's metrics with organizational goals.
Image source: smartsheet.com
Financial performance templates
Financial Excel KPI templates focus on metrics like profit margins, cash flow, expenses, and budget variance. They provide a clear view of the and sustainability. A KPI dashboard template in Excel enables better financial analysis and decision-making.
Image source: xappex.com
Step-by-step: Building your own KPI dashboard in Excel
Creating dynamic Excel KPI dashboard templates from scratch helps you transform raw data into actionable insights for project managers and executives.
Step 1: Clean and structure your raw data
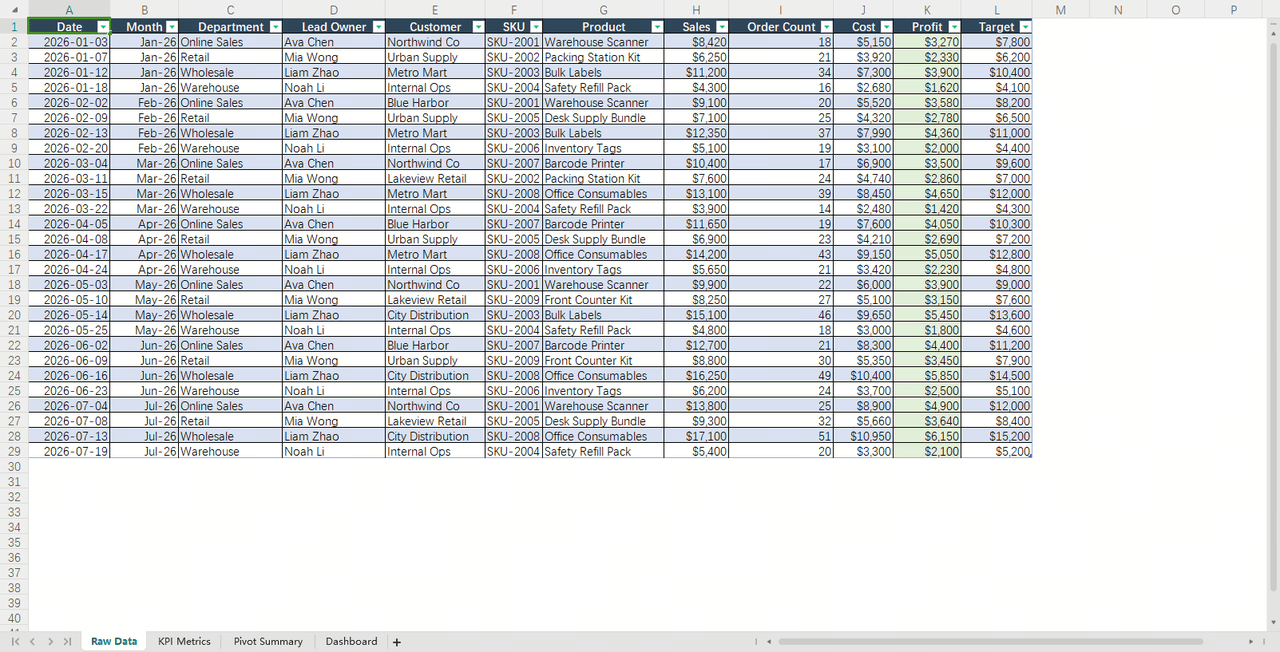
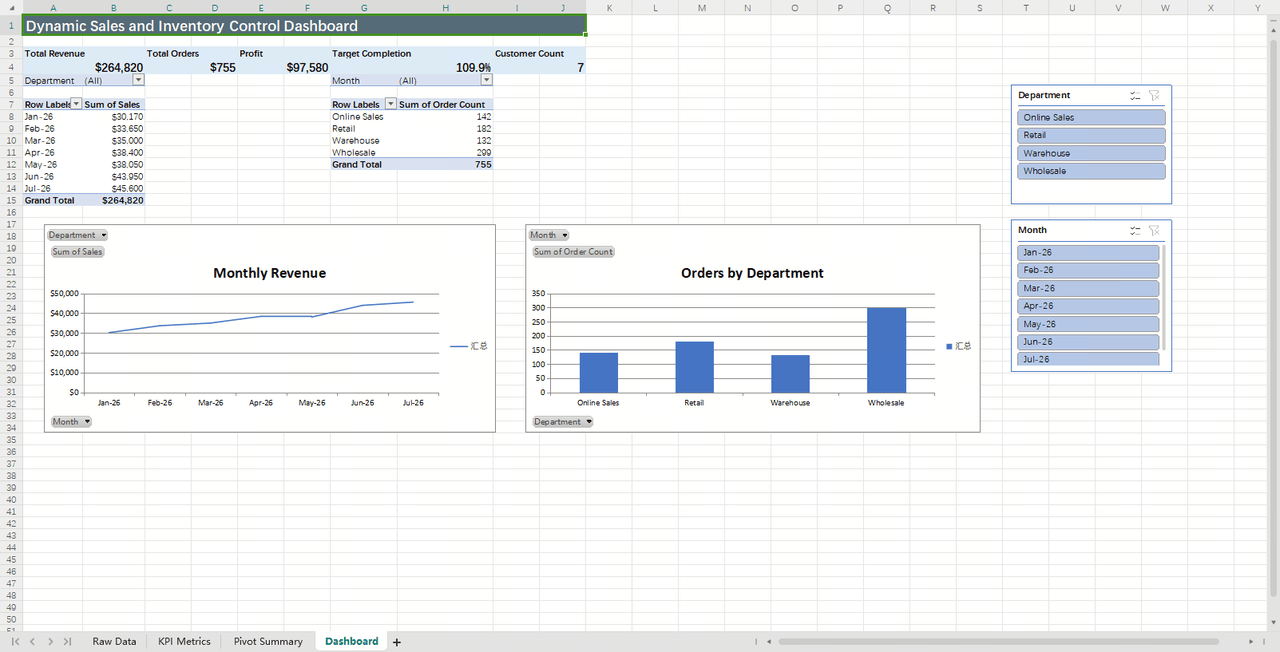
Before building any dashboard, you must prepare your source data. Consolidate all records onto a single worksheet. The first row must feature clear, descriptive headers (e.g., Date, Department, Sales, Order Count, and Cost), with each subsequent row representing a single transaction. To ensure your formulas work flawlessly, avoid merged cells and never insert blank rows or manual subtotals. Standardized formatting is essential to keeping your Excel template for inventory control or sales performance accurate.
Step 2: Define your core KPI metrics
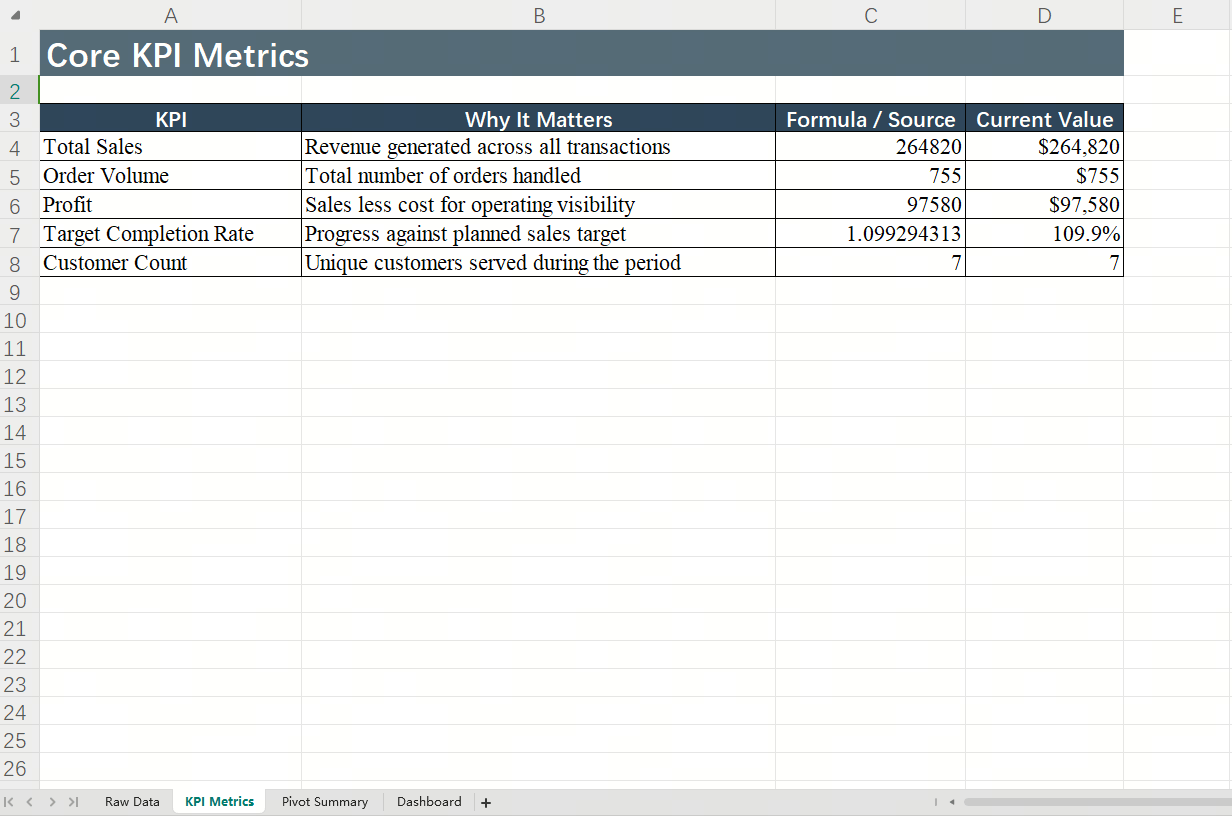
Identify the key performance indicators (KPIs) that matter most to your daily operations. If you are a beginner setting up your inventory stock control Excel template or sales tracker, start with 3 to 5 essential metrics to avoid clutter. For example, on a sales or warehouse dashboard, you might focus on Total Sales, Order Volume, Profit, Target Completion Rate, and Customer Count. Selecting these key parameters early ensures your workbook remains highly focused.
Step 3: Summarize data using PivotTables and charts
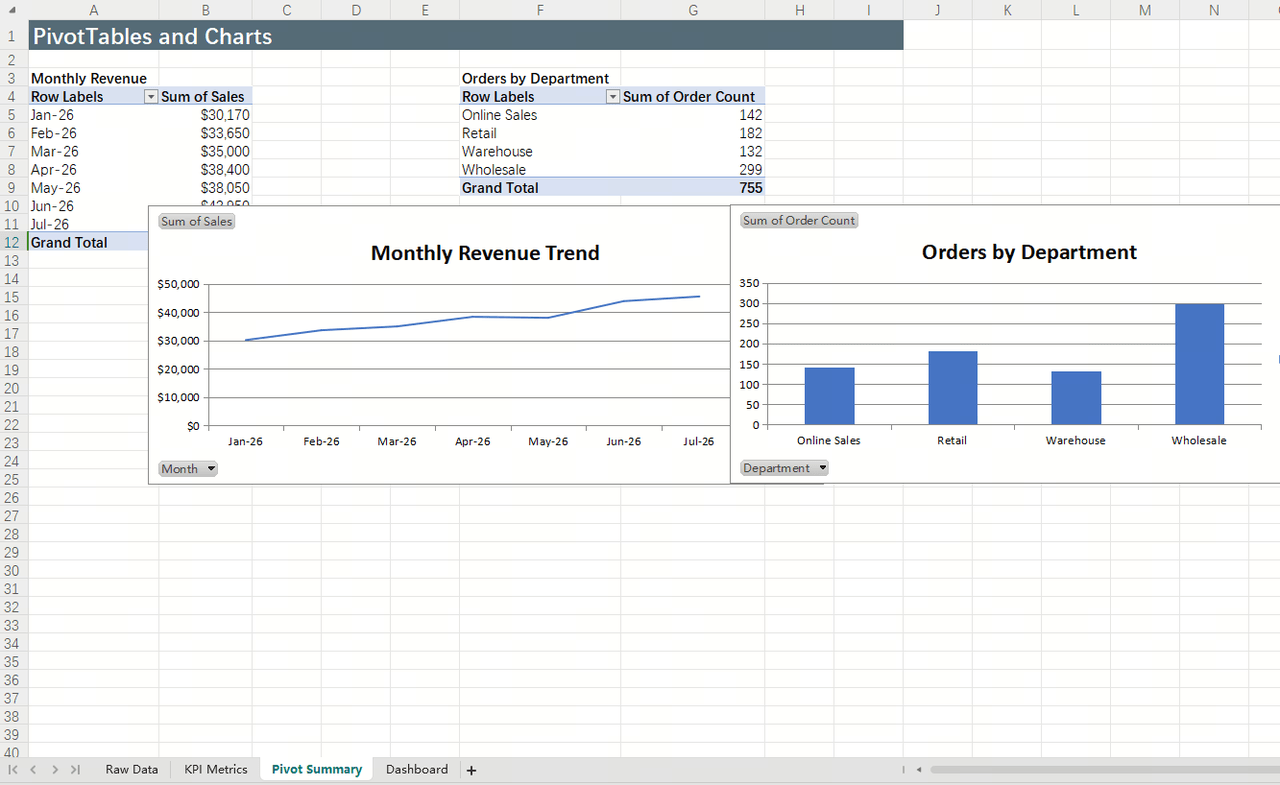
Once your data is clean, select your dataset and go to Insert → PivotTable to aggregate your numbers by month, department, or lead owner. This allows you to automatically calculate summaries such as "Monthly Revenue" or "Orders by Department". To make this data easily digestible in your Excel inventory control template, insert complementary charts—such as line graphs to track trends over time or bar charts to compare department performance.
Step 4: Build a dynamic dashboard page
Create a new worksheet and name it Dashboard to serve as your central hub. Position your most critical KPI cards (e.g., Total Revenue and Total Orders) at the top of the page for high visibility, and place your visual charts directly below them. Finally, insert Slicers (filters) so you can filter the entire screen by month or department with a single click. This transforms a static spreadsheet into an interactive, professional inventory control template Excel layout.
Inevitable shift: Why teams outgrow Excel for KPI tracking
A KPI tracking template Excel is a great starting point, but it often struggles to sustain performance tracking as teams grow and data complexity increases. Understanding these limitations helps teams recognize when Excel is no longer enough for effective KPI management.
- Data is always delayed: Every number in an Excel KPI template reflects the last manual entry, not the current state. A weekly sales KPI entered on Friday morning reflects Thursday's close. By the time a , the data is already hours or days old.
- No alert when a KPI turns Red: Conditional formatting highlights the cell. It does not notify the KPI owner, their manager, or the team responsible for the corrective action. The alert is passive and exists only for the person who opens the file at the right moment.
- Review log discipline collapses under workload; The review log tab is the only record of what the team committed to doing when a KPI was Red. In practice, it is the first tab to be abandoned. Within a month, the log is empty, and the only evidence of past reviews is whatever someone remembers from the meeting.
- Multi-team KPI tracking requires multiple files: A company where sales, marketing, HR, and finance each maintain their own Excel KPI template has four files, four update cadences, and no consolidated view for leadership without manual aggregation.
- No connection between KPI status and action: A Red KPI in an Excel template requires the PM to notice it, communicate it separately, assign a corrective action to a different tool, and track whether the action was completed in yet another system. The template and the are permanently disconnected.
As these limitations begin to affect data accuracy and decision-making, teams often seek a more reliable and scalable solution. This is where platforms like move beyond static tracking and enable real-time performance management. Instead of maintaining spreadsheets, teams can focus on acting on KPIs as they change.
Hear from one of our customers:

"Lark transforms manual processes into seamless, automated workflows, empowering teams to act with efficiency and precision, driving operational excellence across departments."

Yasmine Arifah Azizah Liling
Customer & Operation Coordinator
Centralize your team's KPI tracking on one platform
Modern choice: Turns Excel KPI templates into systematic workflows in Lark
Excel KPI templates become truly effective only when it moves beyond static tracking into a system that drives real-time action. Marketing and ops teams moving off static Excel tabs often land on a , rather than a file only one person remembers to update. Traditional spreadsheets capture data, but they often fail to connect insights with timely decisions.
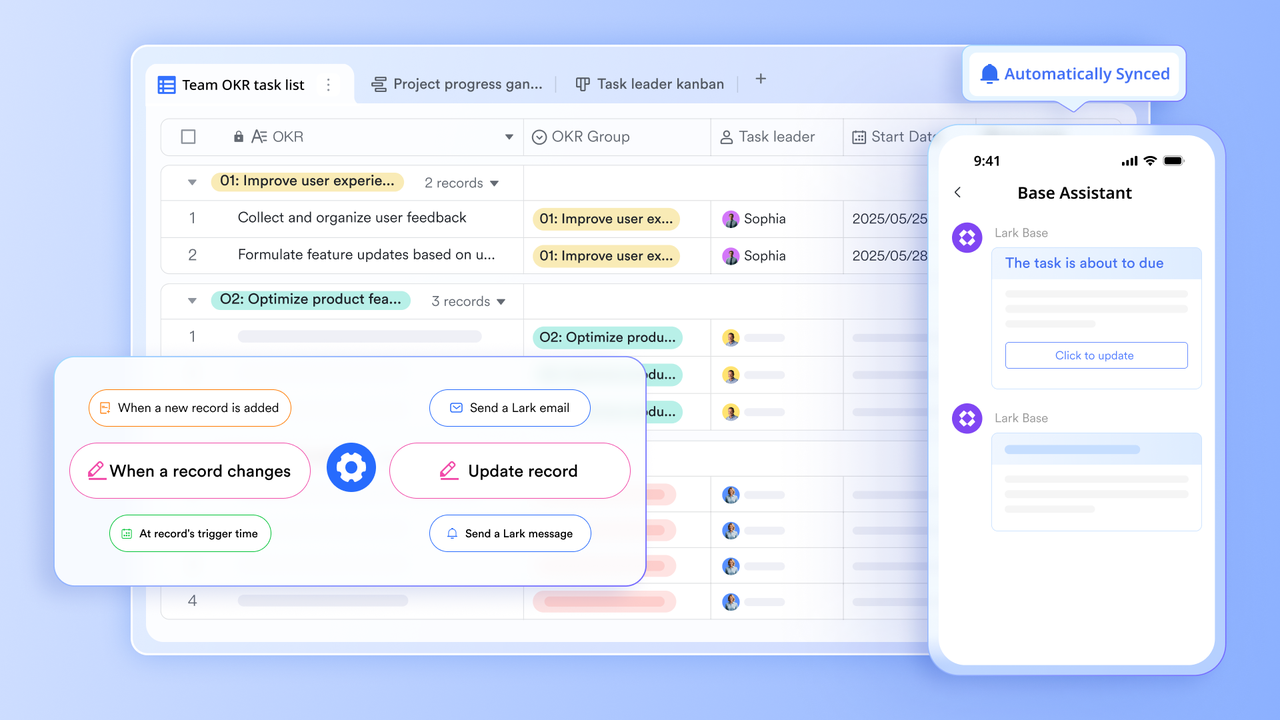
Unlike a traditional Excel workbook where data visualization remains static, — as an all-in-one collaboration platform — provides a live database () for your KPI register. It eliminates the need for manual data analysis and dashboard creation. When input data changes, Lark’s interactive charts update in real-time, instantly notifying owners in chat groups when a metric slips. It brings data, ownership, and communication into a single connected workspace. A live database for KPI register
stores the KPI register with number fields for , formula fields that auto-calculate performance gap and trend, single-select status fields with conditional coloring, and member fields for ownership. Every field update is reflected instantly across all users, with a full, timestamped change history stored automatically.
No manual compilation
Lark Base dashboard generates live charts directly from the KPI register fields—a RAG status , a performance gap bar chart sorted by largest deficit, and a period-over-period trend chart. Every chart updates the moment a KPI owner enters a new result, with no scheduled refresh required. 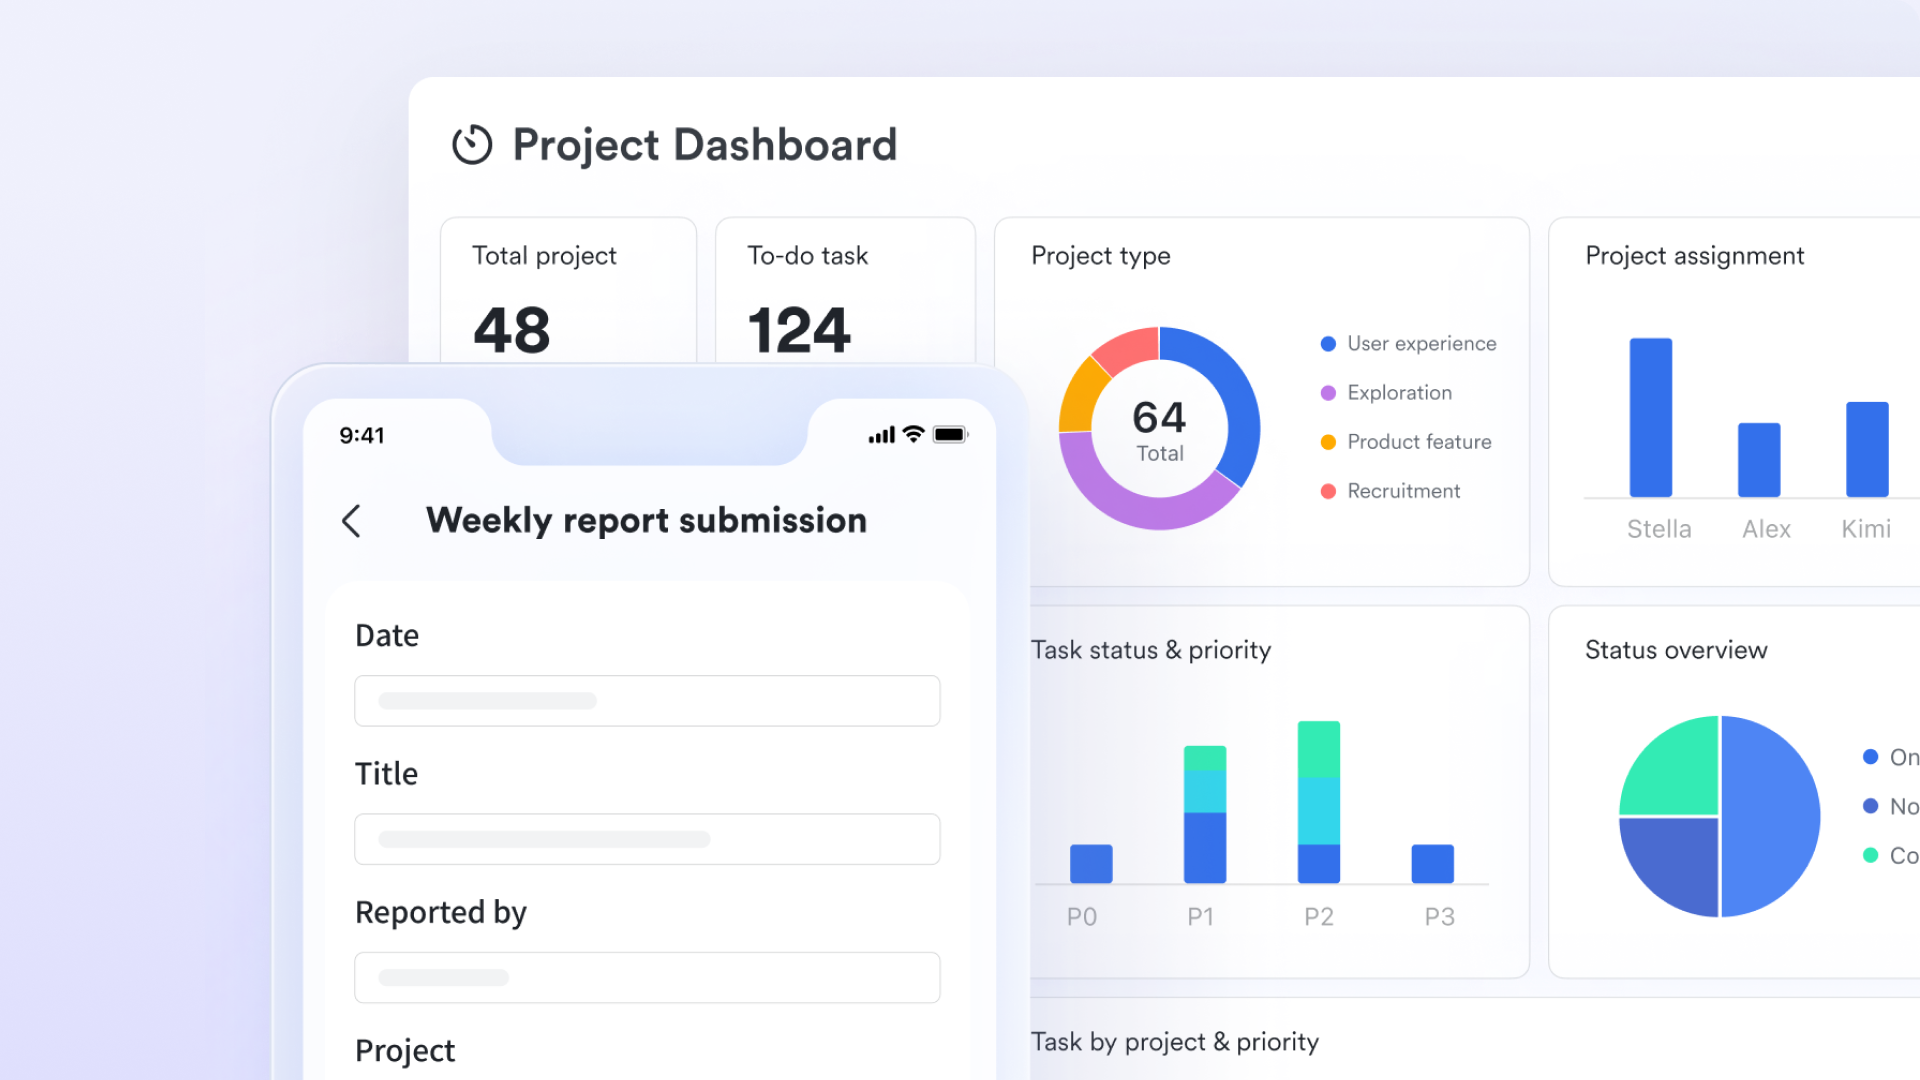
Red KPI alerts fired instantly
When a KPI status field changes to Red, Lark Base Automation sends a notification to the owner, attaching the indicator name, current result, target, and performance gap. When the same KPI remains Red for two cycles, the to the owner's manager. 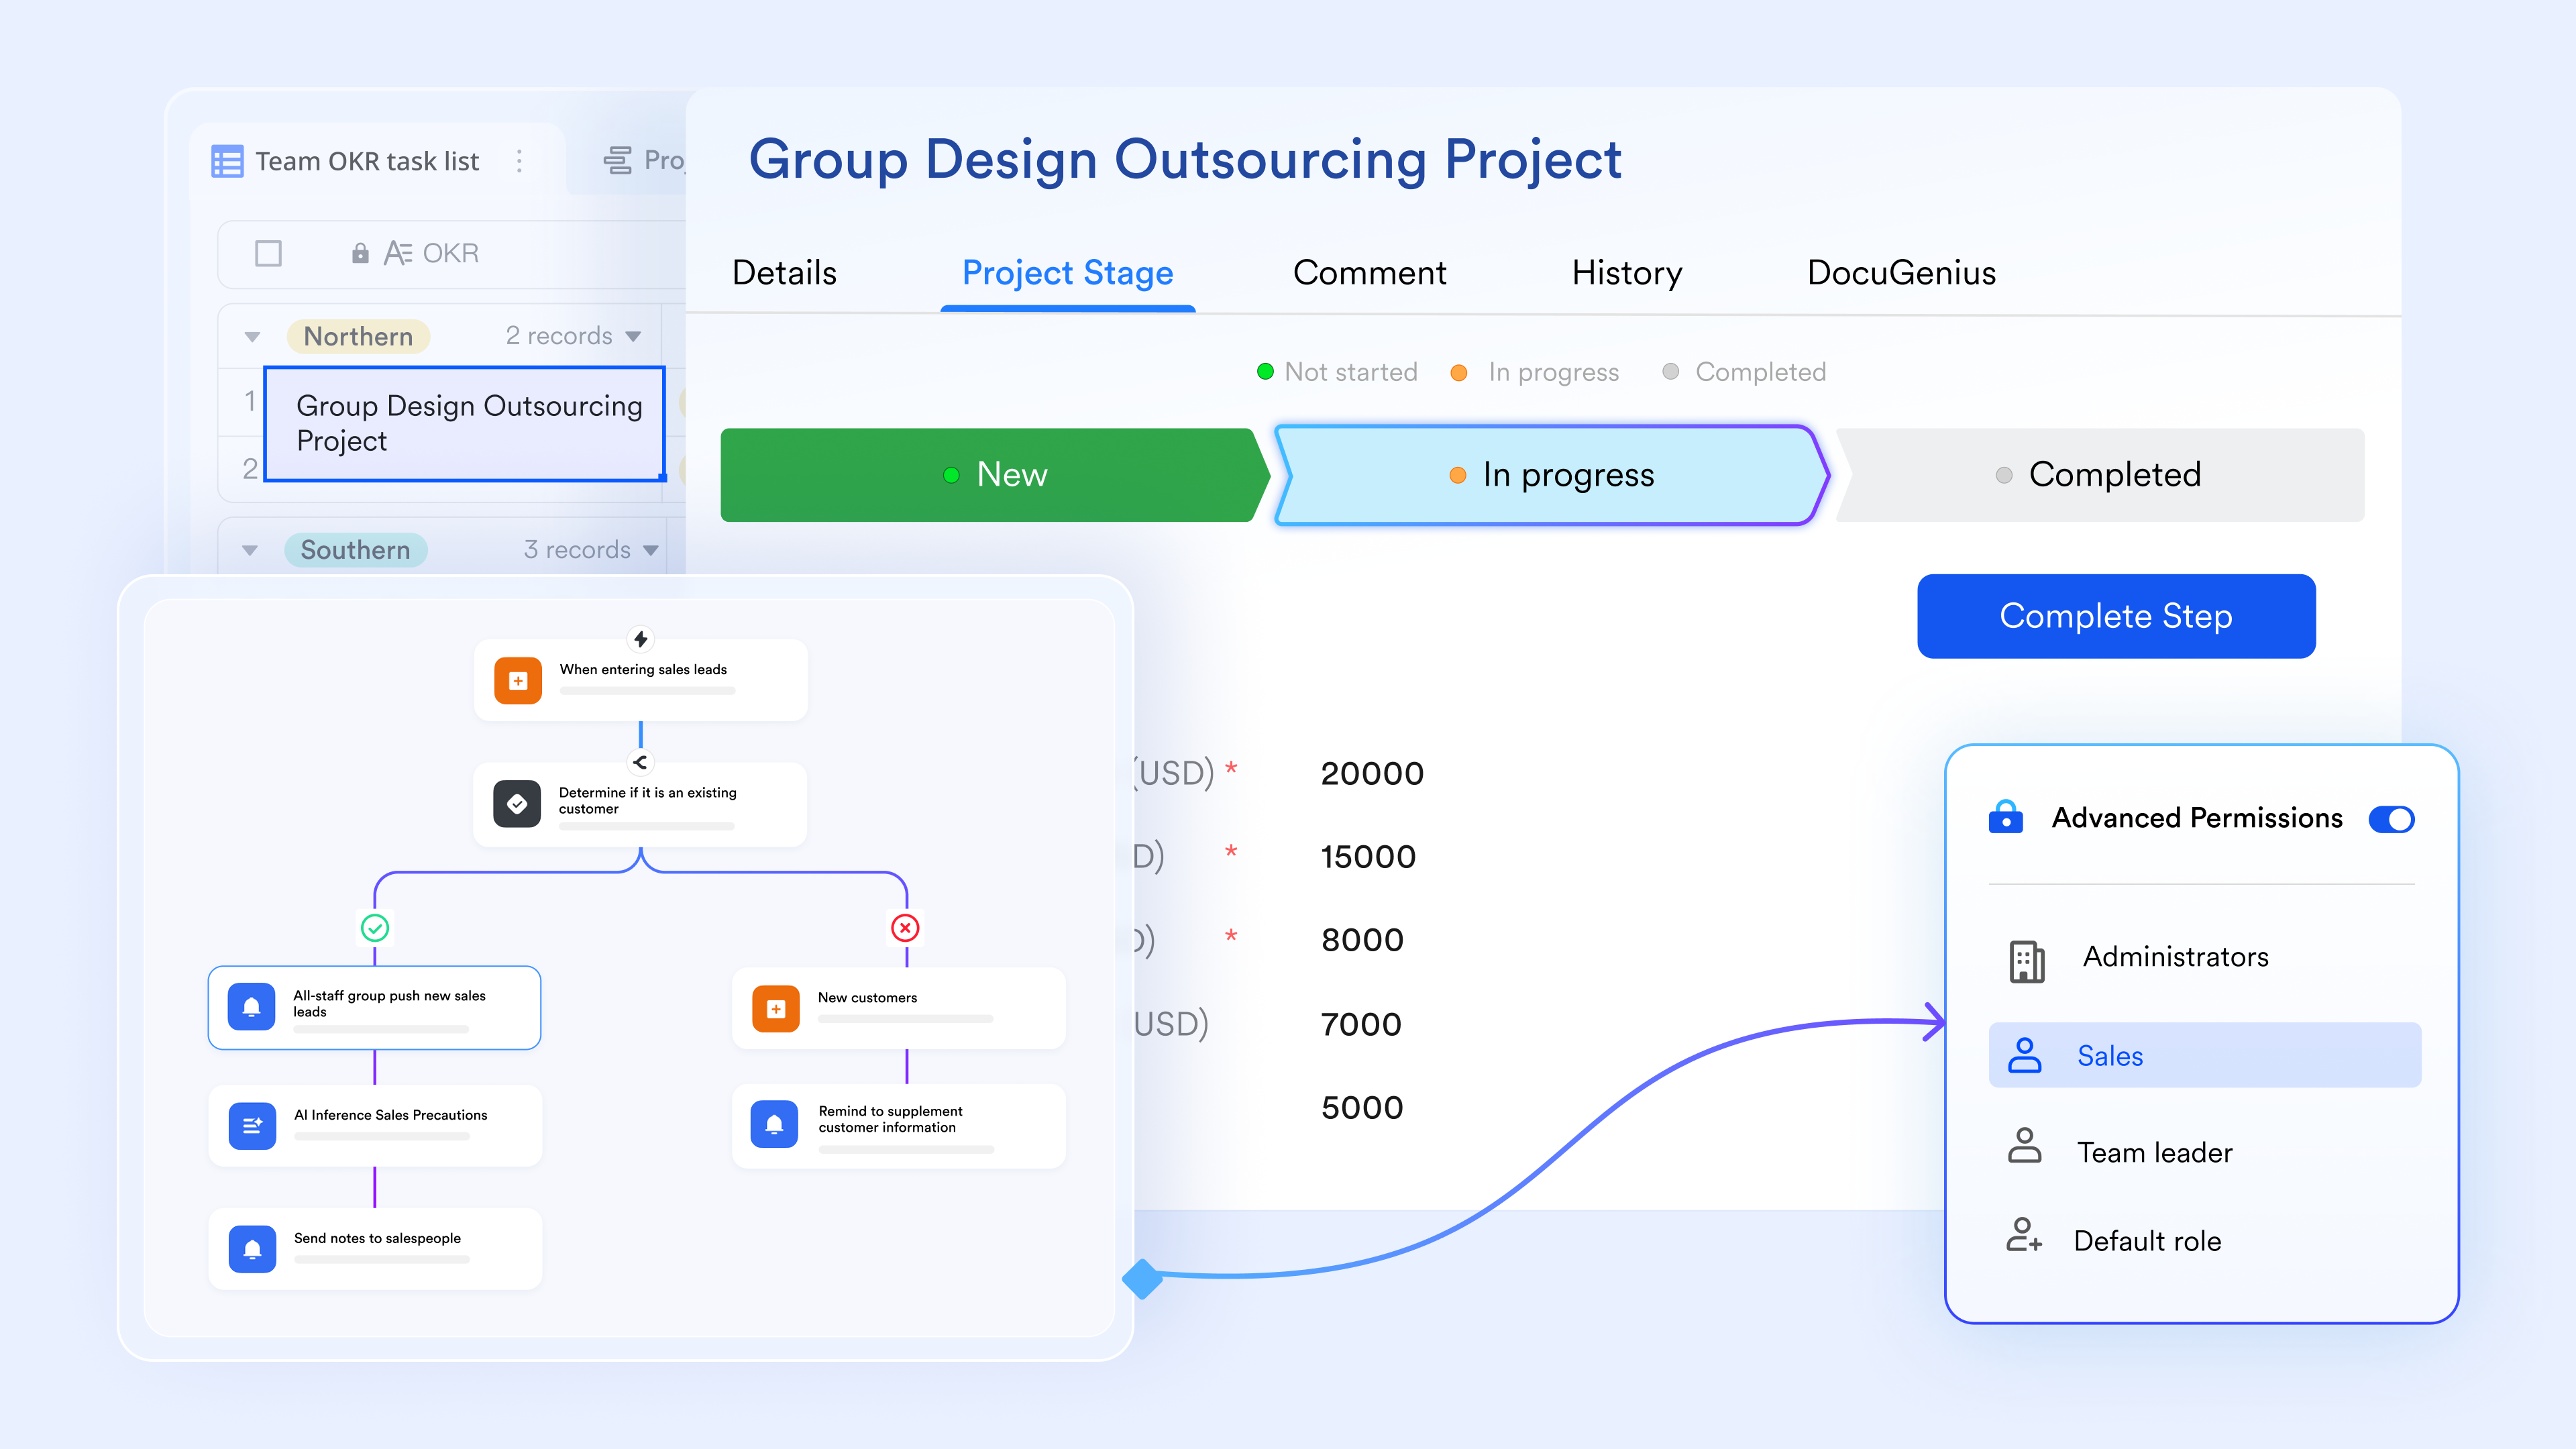
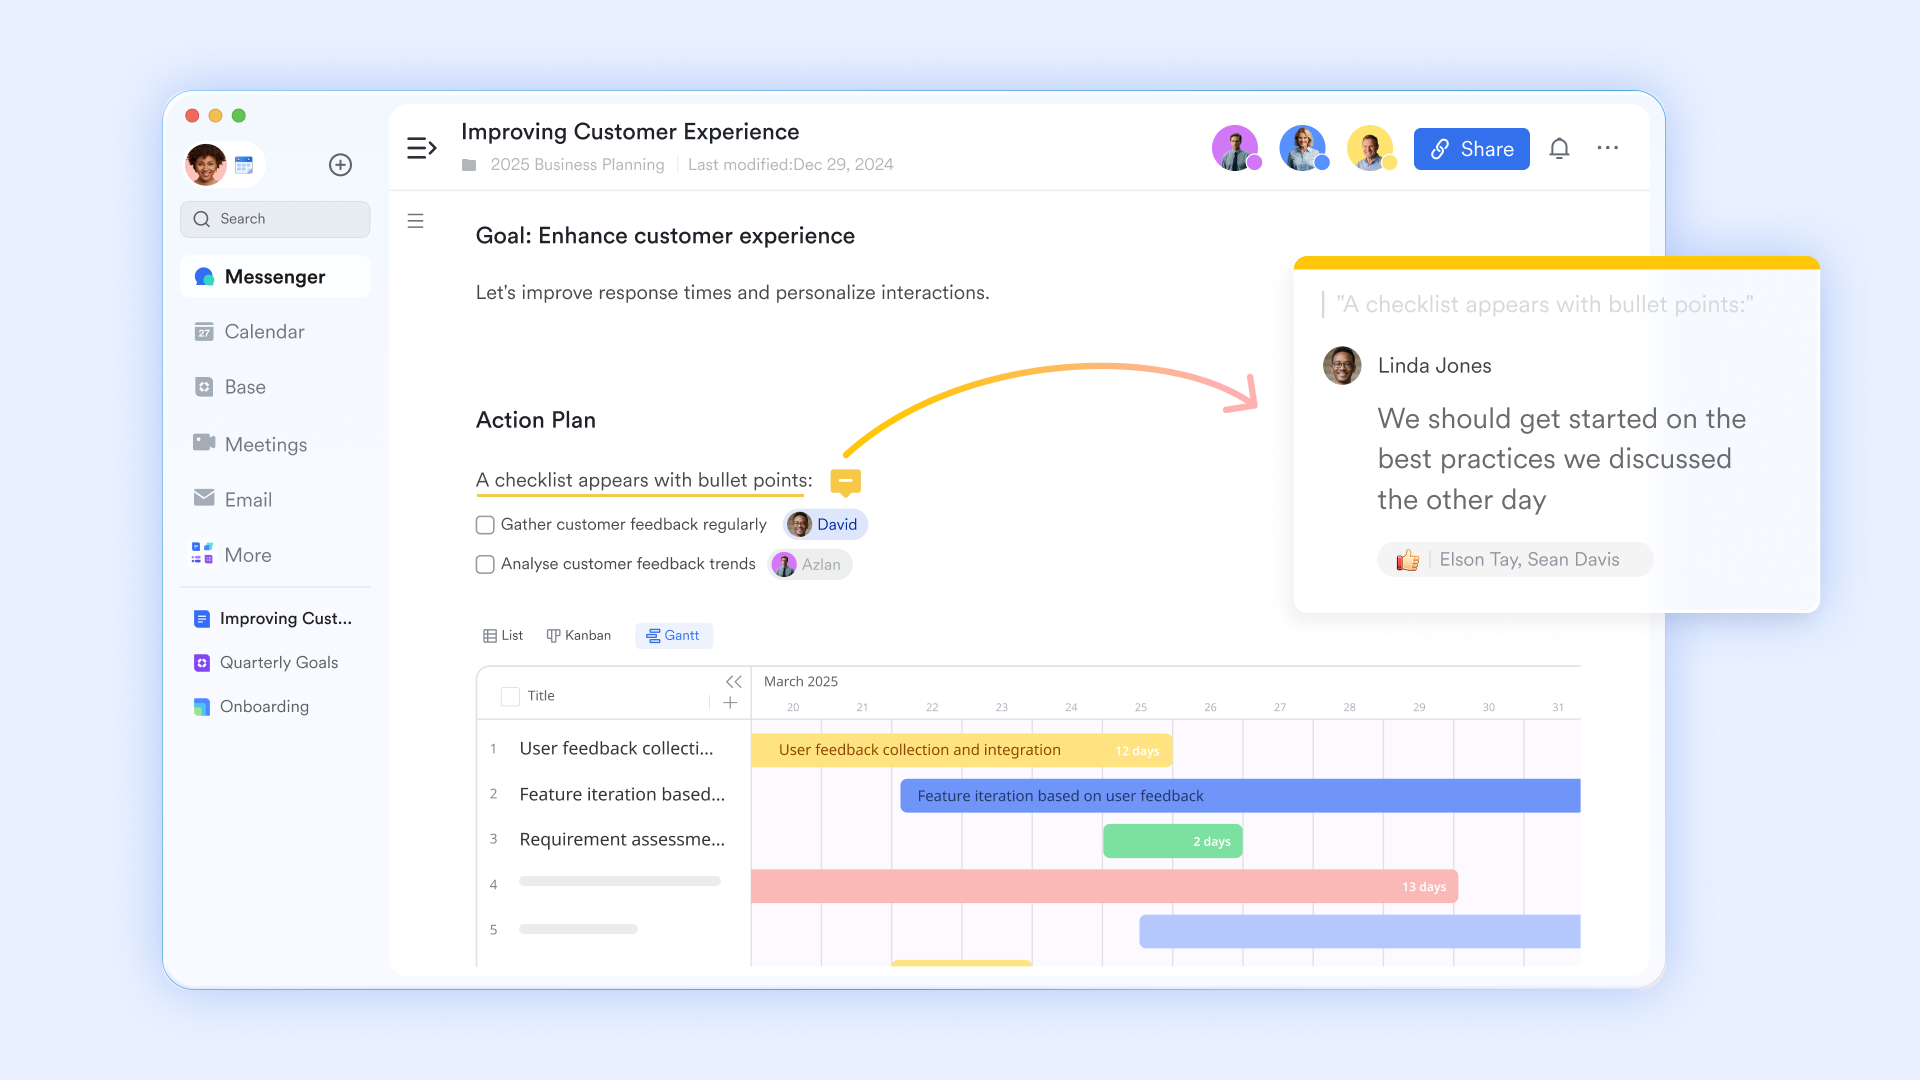
KPI definitions linked to every record
stores KPI definitions, target rationale, and review notes with and version history. Each document links directly to the corresponding Lark Base record. When a target is revised, the Lark Docs edit history records who changed it and when, giving every stakeholder a traceable record.
Review decisions tied to the KPI record
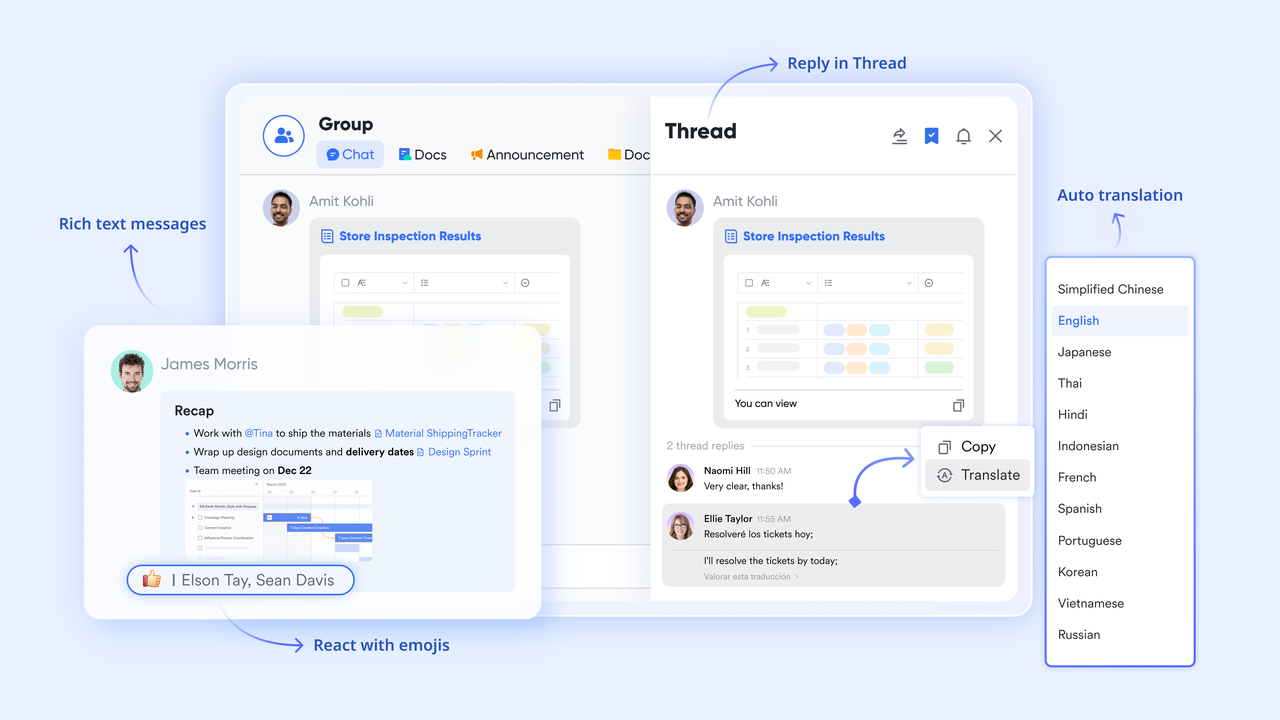
When Lark Base Automation fires a Red KPI alert, it arrives in as a structured notification with the KPI record embedded as a card. The , assigning a corrective action. Decisions are stored in threads linked directly to the specific record they reference.
:
- Starter plan: Free forever plan that includes 11 powerful tools for up to 20 users. It also comes with 100GB of storage, 1000 automation runs, AI translations, and more.
- Pro plan: $12/user/month (billed annually) for up to 500 users. It includes everything in Starter plus group calling for up to 500 attendees, 15TB of storage, 50,000 automation runs, and more.
- Enterprise plan: for custom pricing. Supports unlimited users and includes additional automation runs, as well as advanced security, compliance, and management features.
For small teams with simple communication needs

18 months message history
1000 Base automation runs/month
2000 rows per table in Base
Most POPULAR
For companies with comprehensive collaboration and management needs
Unlimited message history
500-participant video meetings
50k Base automation runs/month
20k rows per table in Base
For large companies with advanced security and organizational management needs
Get a personalized demo and pricing
Unlimited message history
500-participant video meetings
15 TB storage + 30 GB storage/user
500k Base automation runs/month
50k Base automation runs/month
Most POPULAR
For companies with comprehensive collaboration and management needs
Unlimited message history
500-participant video meetings
50k Base automation runs/month
20k rows per table in Base
Ready-to-use Lark KPI templates
These templates are built on , so every KPI is a live, collaborative record connected to the team that owns it. Update a result, trigger a Red alert, or log a review action—the change reflects instantly across the dashboard and sends the right notification automatically. No stale spreadsheet, no manual report, no chasing owners for updates.
KPI evaluation management
A KPI evaluation management template helps teams assess performance by comparing actual results against defined targets and benchmarks. It provides a structured way to review progress, identify gaps, and document feedback for each KPI.
KPI-performance review system
A KPI performance review system template helps track and evaluate individual or over a defined period. It combines KPI results with qualitative feedback to support structured performance reviews and goal alignment.
Financial performance tracker
A financial performance tracker template helps monitor key financial metrics, including revenue, expenses, profit margins, and cash flow. It provides a clear view of financial health by comparing actual performance against budgets or forecasts.
Scorecard
A scorecard template helps track performance across multiple KPIs by comparing actual results against predefined targets. It into categories such as financial, customer, and operational performance for a balanced view.
Performance evaluation
A performance evaluation template helps assess individual or team performance based on defined KPIs and qualitative feedback. It provides a structured format for reviewing achievements, identifying gaps, and setting improvement goals.
Employee performance evaluation template
An employee performance evaluation template helps assess individual performance based on defined KPIs, goals, and competencies. It combines quantitative results with qualitative feedback to provide a well-rounded review of each employee.
OKR task management
An OKR template helps teams align daily tasks with broader objectives and key results. It connects individual responsibilities to measurable outcomes, ensuring that work contributes directly to strategic goals. This improves focus, accountability, and progress tracking across teams.
Personal OKR execution and review
A personal OKR execution and review template helps individuals plan, track, and evaluate their progress against defined objectives and key results. It provides a clear structure for monitoring achievements, reflecting on outcomes, and adjusting goals as needed.
Executive project status report
An executive project status report template provides a high-level overview of project progress, , risks, and overall performance. It highlights critical updates in a concise format for leadership review and decision-making.
Weekly status report
A weekly status report template helps track progress, completed tasks, upcoming priorities, and any blockers over a defined week. It provides a consistent format for teams to share updates and maintain alignment. This ensures transparency, accountability, and timely issue resolution.
Free KPI resources: When to use Excel KPI templates vs. Lark
Both free Excel templates and Lark's free Starter plan can coexist. The right choice depends on your team's maturity and needs.
Stick with Excel when:
- Your team has under 5 people
- You're tracking a limited number of KPIs (5–10 key metrics)
- Monthly reporting cadence is sufficient, mostly for internal summaries
- You're prototyping: defining KPI definitions, chart types, and data visualization layouts before committing to a platform
Move to Lark when:
- Cross-functional teams (sales, marketing, operations) need shared visibility into the same KPI dashboard template metrics
- Daily or near real-time monitoring of essential metrics matters for continuous improvement
- You need comment threads, approvals, and OKR alignment directly linked to KPIs
- Automated alerts for at-risk metrics would save response time and track progress more reliably
The hybrid approach works best for most teams. Start with a free Excel KPI template to define your right KPIs, validate your data sources, and settle on chart layouts. Once the metrics are stable, import the structure into . The transition is low friction-same data, same definitions, better infrastructure for dashboard creation and collaboration. HubSpot's KPI dashboard template sets up in 20 minutes; replicating it in Lark takes about the same, with the added benefit of live updates and .
From static Excel KPI template to live Lark Base
Migrating your existing template is straightforward:
1. Import your Excel sheets into Lark Sheets or Base. The file structure carries over.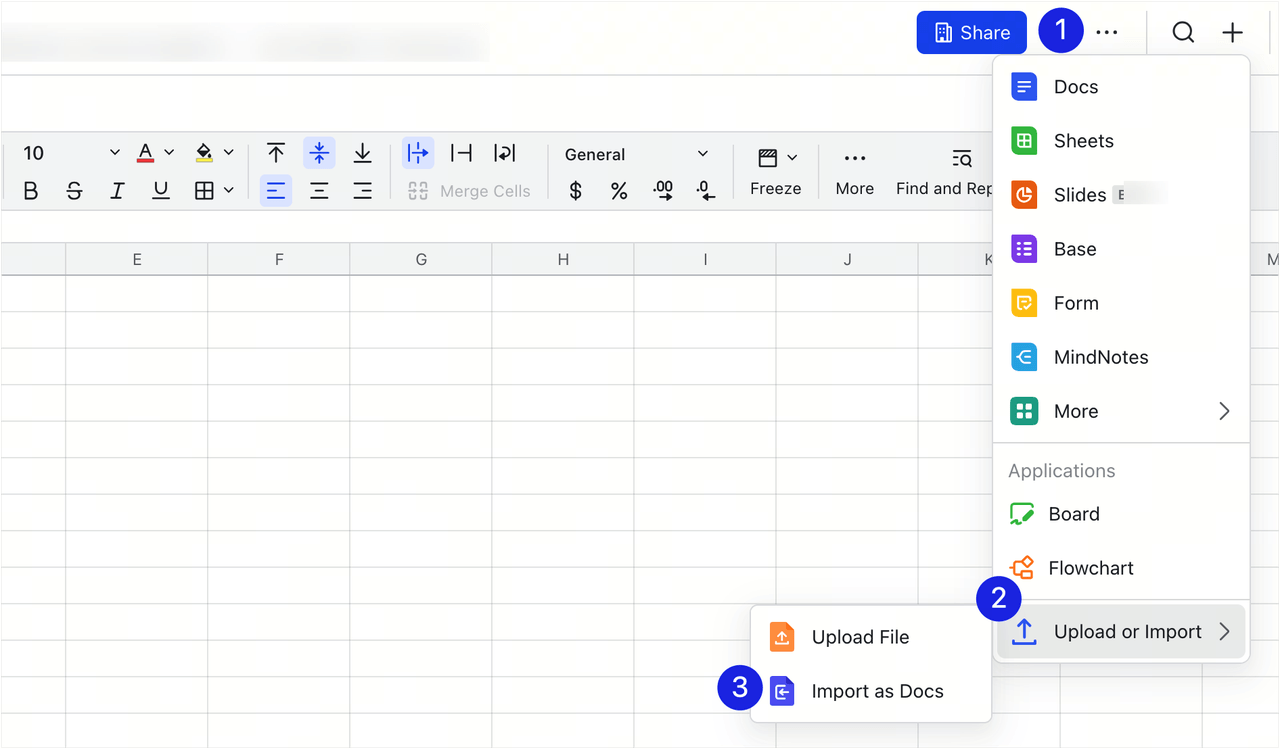
2. Map columns (KPI name, owner, frequency, 2025–2026 values) to structured fields-formula fields for % to target, single-select fields for RAG status, member fields for owners. 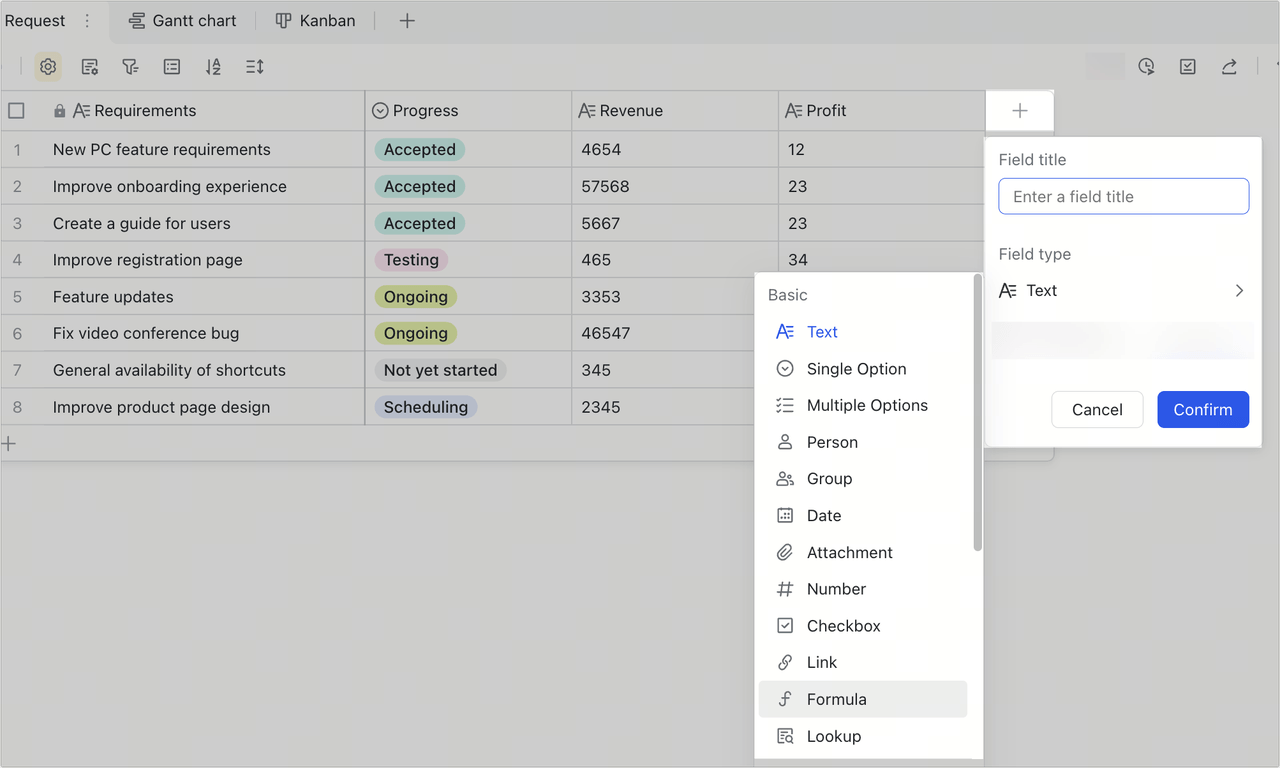
3. Rebuild charts as live dashboard views that update automatically. No more manual chart refreshes. For example, a marketing team could import their campaign performance tracker, map "Cost per Lead" and "MQL-to-SQL Conversion" to formula fields in Base, and have a live showing overall performance within the hour. Automatic change history means every update is auditable-who changed what, and when.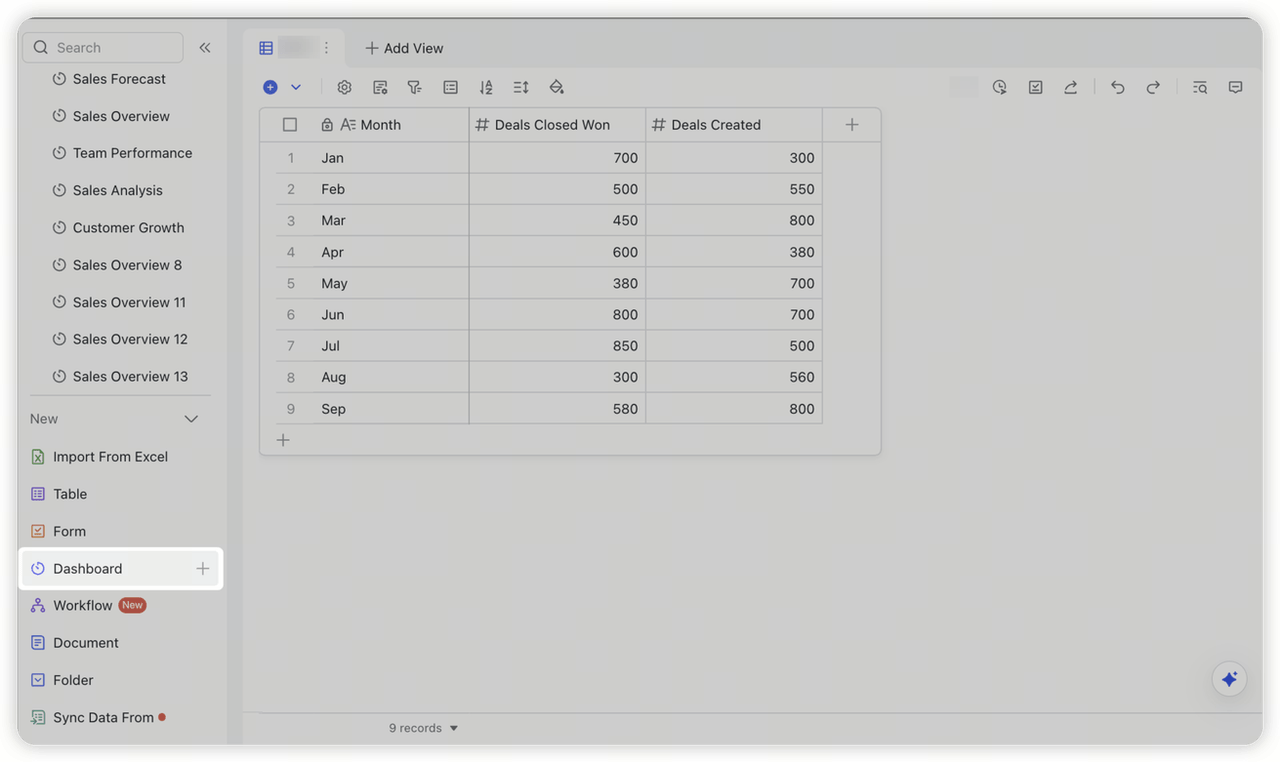
Learn more about the migration from Excel to Lark
Best practices for maintaining KPI accuracy and accountability
Maintaining KPI accuracy and accountability is essential for ensuring that performance data leads to meaningful decisions. Even the best KPI template in Excel can fail if the data is inconsistent or ownership is unclear. Following best practices helps teams keep their KPI tracking reliable, actionable, and aligned with .
- Assign clear ownership for every KPI: Each KPI should have a defined owner responsible for updating data and taking action when performance deviates. This eliminates confusion and ensures accountability across the team. Clear ownership also improves follow-through on corrective actions.
- Standardize KPI definitions and formulas: All KPIs should have clear definitions, calculation methods, and data sources documented in the template. This prevents inconsistencies and ensures everyone interprets the metrics in the same way. Standardization improves trust in data.
- Set a consistent update schedule: Define how often each KPI should be updated—daily, weekly, or monthly—based on its relevance. Regular updates keep the data fresh and useful for decision-making. Without a schedule, KPI tracking quickly becomes outdated.
- Use validation and error checks: Incorporate data validation rules, dropdowns, and formula checks to reduce manual entry errors. This improves data accuracy and minimizes the risk of incorrect reporting. Reliable data is critical for making informed decisions.
- Review and act on KPIs regularly: to discuss KPI performance and identify necessary actions. Tracking alone is not enough—teams must respond to insights and address gaps. Consistent reviews ensure KPIs drive real outcomes.
Conclusion
A KPI template Excel is a practical starting point for tracking performance, offering structure, flexibility, and ease of use across teams. In this guide, we covered what a KPI template includes, how it differs from dashboards, the types used across functions, and a step-by-step approach to building one. We also explored real examples and the common limitations that prevent Excel-based systems from sustaining long-term performance tracking.
As teams grow, the need shifts from static tracking to real-time visibility, , and clear accountability. This is where transforms KPI management into a live performance system by connecting data, dashboards, and team communication in one place. Instead of chasing updates or working with outdated reports, teams can act on insights instantly. If you're ready to move beyond manual spreadsheets and build a system that drives action, try Lark for free and experience smarter KPI tracking.
Get a real-time view of your team's performance with Lark
FAQs about KPI template Excel
How do you keep a KPI dashboard in Excel up to date consistently?
Set a fixed update schedule and assign clear ownership for every KPI to ensure accountability. Use reminders and simple validation rules to reduce missed or incorrect entries. Teams often use Lark to automate updates and reduce the burden of manual tracking.
Why do most KPI Excel templates fail after initial setup?
They rely heavily on manual data entry, which becomes inconsistent as workloads increase. Over time, outdated data and a lack of accountability reduce trust in the system. Lark helps overcome this by providing real-time updates and automated workflows.
Can Excel KPI templates support multi-team performance tracking?
Excel can support multiple teams, but it often requires separate files or complex consolidation efforts. This makes it difficult to maintain a unified view of performance across departments. Lark enables centralized tracking where all teams update and view KPIs in one place.
How do you connect KPI tracking to real actions and outcomes?
An Excel KPI dashboard template shows performance but does not directly trigger actions or workflows. Teams must manually communicate issues and assign follow-ups, which slows response time. Lark connects KPI changes to instant alerts, task assignments, and real-time collaboration.
Related reading