














KPI Dashboard Guide: Examples, Templates & How to Build One

Ryan Tanner
Product Marketing Specialist
Sep 18, 2026
Ryan Tanner
Sep 18, 2026

15 min read


A KPI dashboard is most valuable when it connects people, data, and action within everyday workflows. With it, teams can view key results, discuss insights, and record actions seamlessly. If you are searching for KPI dashboard templates for quick use, or want to learn how to set one up and make it your own, this guide is right here to help. Let's dive in and attain your KPI goals step by step.

What is a KPI dashboard?
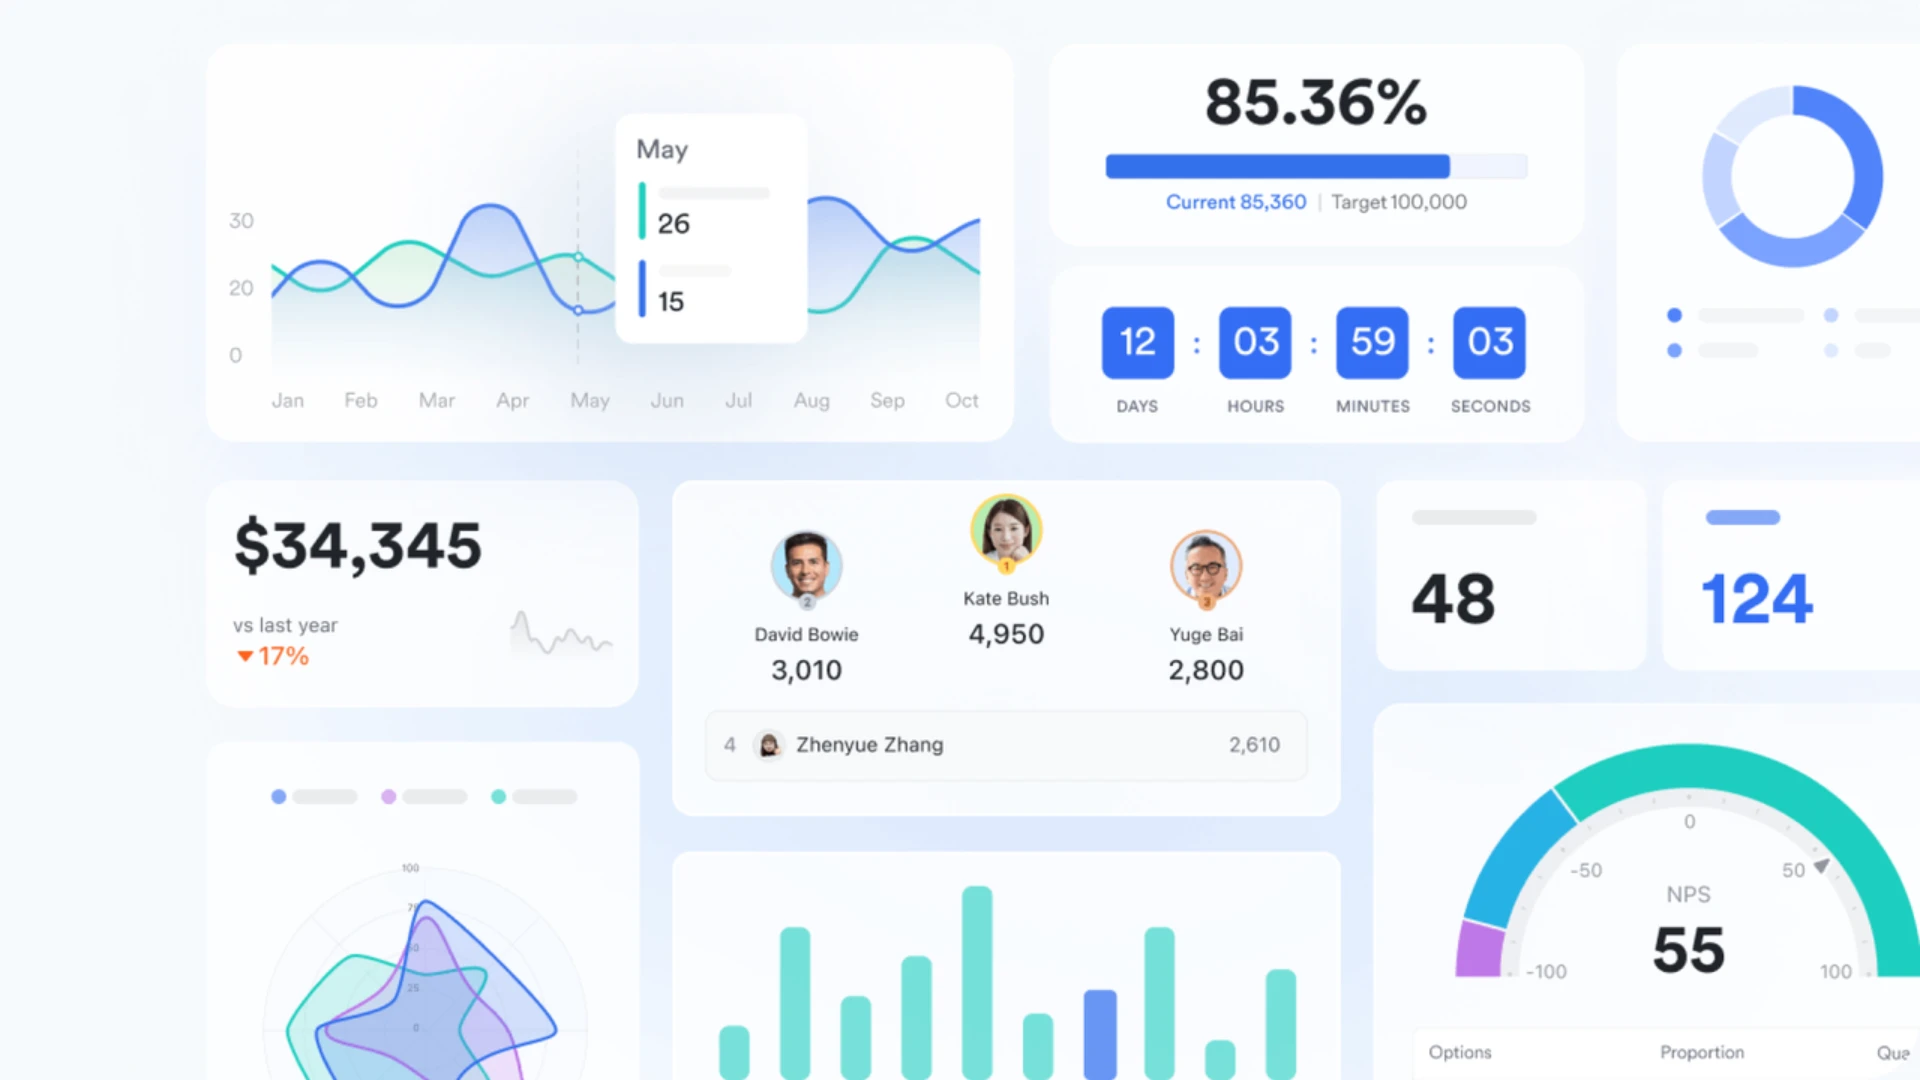
A KPI dashboard (Key Performance Indicator dashboard) is a visual tool that tracks and displays the most important metrics for achieving business objectives. It helps teams monitor progress, identify trends, and make data-driven decisions faster. Unlike static reports or Excel sheets, modern KPI dashboards update in real time, pulling information directly from operational systems such as sales, marketing, HR, finance, or supply chain platforms.
By presenting data through charts, graphs, and scorecards, a KPI dashboard turns complex information into clear insights that anyone can understand at a glance. It highlights what's working, what needs attention, and how performance aligns with company goals. Whether it's a sales KPI dashboard tracking win rates or a marketing KPI dashboard measuring ROI, these visual reports keep teams aligned, accountable, and focused on measurable outcomes, helping organizations move from data observation to strategic action.
How to set up a KPI dashboard that improves decision-making
Step 1: Define clear business goals
Begin by identifying what you want to improve revenue growth, customer retention, operational efficiency, or experience. Your KPIs should directly connect to these objectives. Clear goals ensure your dashboard measures what truly matters.
Step 2: Select meaningful KPIs and owners
Focus on metrics that influence decisions, not vanity statistics. Assign ownership to each KPI so accountability is built in from the start. When every metric has a responsible owner, progress becomes consistent and measurable.
Step 3: Ensure trustworthy data and consistent updates
Define the data source, calculation method, and update frequency for each KPI. Consistency and accuracy build confidence in decisions. Reliable data turns your KPI dashboard into a trusted tool, not a guessing game.
Step 4: Design a simple, outcome-focused dashboard
Group KPIs by goals or workflow stages to make insights intuitive. Use clear visual cues and minimal clutter to highlight priorities. A clean, outcome-driven layout helps teams focus and act faster.
Step 5: Turn insights into action immediately
Use your dashboard as a live decision-making hub, not a static report. Discuss trends in meetings, assign follow-up tasks, and monitor impact over time. Turning data into action keeps improvement continuous and visible.
Ready to use KPI dashboard templates
Each department measures success differently, so KPI dashboards should reflect those unique goals. A well-designed dashboard highlights the most relevant metrics for each team, from sales performance to operational efficiency. These tailored views turn complex data into clear insights, helping teams act quickly and stay aligned. Explore the examples below to see how different functions use KPI dashboards to drive results.
Sales KPI dashboard
Sales KPIs balance pipeline quality and execution speed. Examples include qualified leads, conversion rate by stage, win rate, sales cycle length, and average purchase per deal. Post‑sale indicators such as customer churn rate and expansion velocity ensure focus on long‑term value, not just short‑term bookings. When these metrics are tied to explicit targets and actions, sales teams can prioritize high‑impact work and track progress reliably.
Marketing KPI dashboard
Marketing KPIs reveal funnel health and efficiency. Core examples are marketing qualified leads (MQLs), sales qualified leads (SQLs), campaign ROIs, customer acquisition cost (CAC), website traffic quality, and conversion rate to revenue. Channel‑specific indicators across social media, search, and email clarify attribution and guide budget allocation. Aligned to strategic goals, this mix supports revenue growth while protecting brand equity and unit economics.
Operations & supply chain KPI dashboard
An operations KPI dashboard provides real-time visibility into delivery performance, logistics efficiency, and resource utilization. It tracks on-time delivery (OTD), order accuracy, inventory turnover, production lead time, and supplier reliability. With these metrics, teams can identify bottlenecks, reduce waste, and enhance fulfillment speed. By comparing performance across regions or suppliers, operations leaders can make informed sourcing and logistics decisions. The dashboard turns supply chain management into a proactive, data-driven process.
HR KPI dashboard
An HR KPI dashboard captures workforce metrics that define organizational health. It measures time-to-hire, cost per hire, employee turnover rate, engagement scores, and training effectiveness. HR leaders can visualize hiring pipeline efficiency, track retention trends, and assess workforce satisfaction. By connecting data from recruitment to performance reviews, the dashboard ensures people initiatives align with business strategy. This helps HR build stronger, more engaged teams while reducing hiring friction.
Finance KPI dashboard
A finance KPI dashboard brings clarity to financial performance and operational spending. It includes KPIs like revenue growth, profit margins, expense ratios, cash flow, and days sales outstanding (DSO). These insights allow finance teams to manage liquidity, control costs, and forecast accurately. Real-time visibility into spending trends helps prevent overspending and improve budgeting precision. By connecting financial data with department goals, organizations can make smarter, faster fiscal decisions.
KPI dashboard in Excel vs modern dashboard software
Afterthought
Traditional Excel KPI dashboards can be frustrating: updates are manual, collaboration is limited, scaling across teams is difficult, and important insights often get lost in scattered comments. That's where we introduce Lark to solve these problems. By keeping data, discussions, and tasks all in one place, it sync updates in real time, and capturing insights with AI. Let's attain your goal with Lark now.
Attain your goal: Use Lark to turn KPI dashboards into real results
A KPI dashboard is only as powerful as the actions it drives. Lark empowers teams to achieve their KPIs by connecting data management, people arrangement, and automated workflows on one platform. With Lark, you can visualize key metrics in real time, discuss insights instantly via Messenger, and turn findings into tasks and follow-ups using Base, Sheets, Docs, and Tasks. This approach ensures that performance metrics don't just sit on a screen—they become clear, actionable steps that align teams.
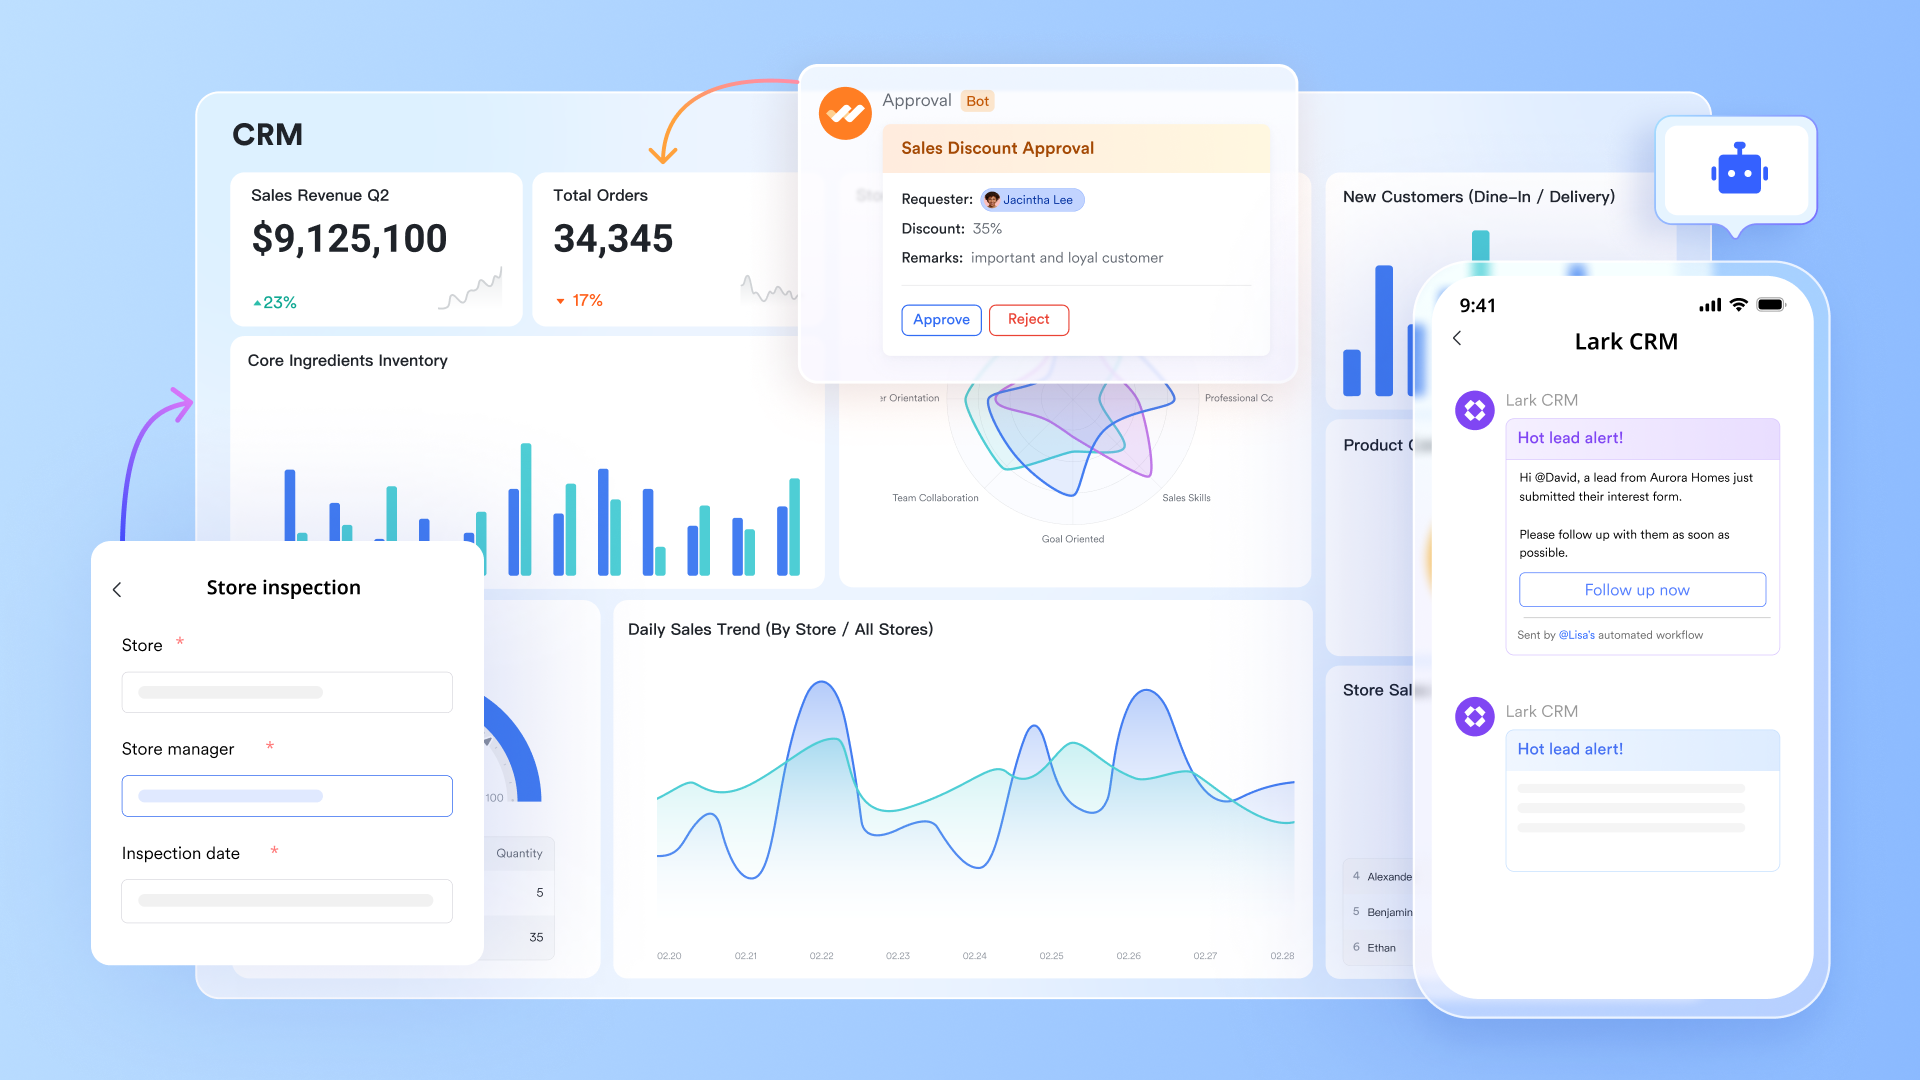
Lark Base dashboards: Live KPI views tied to the work itself
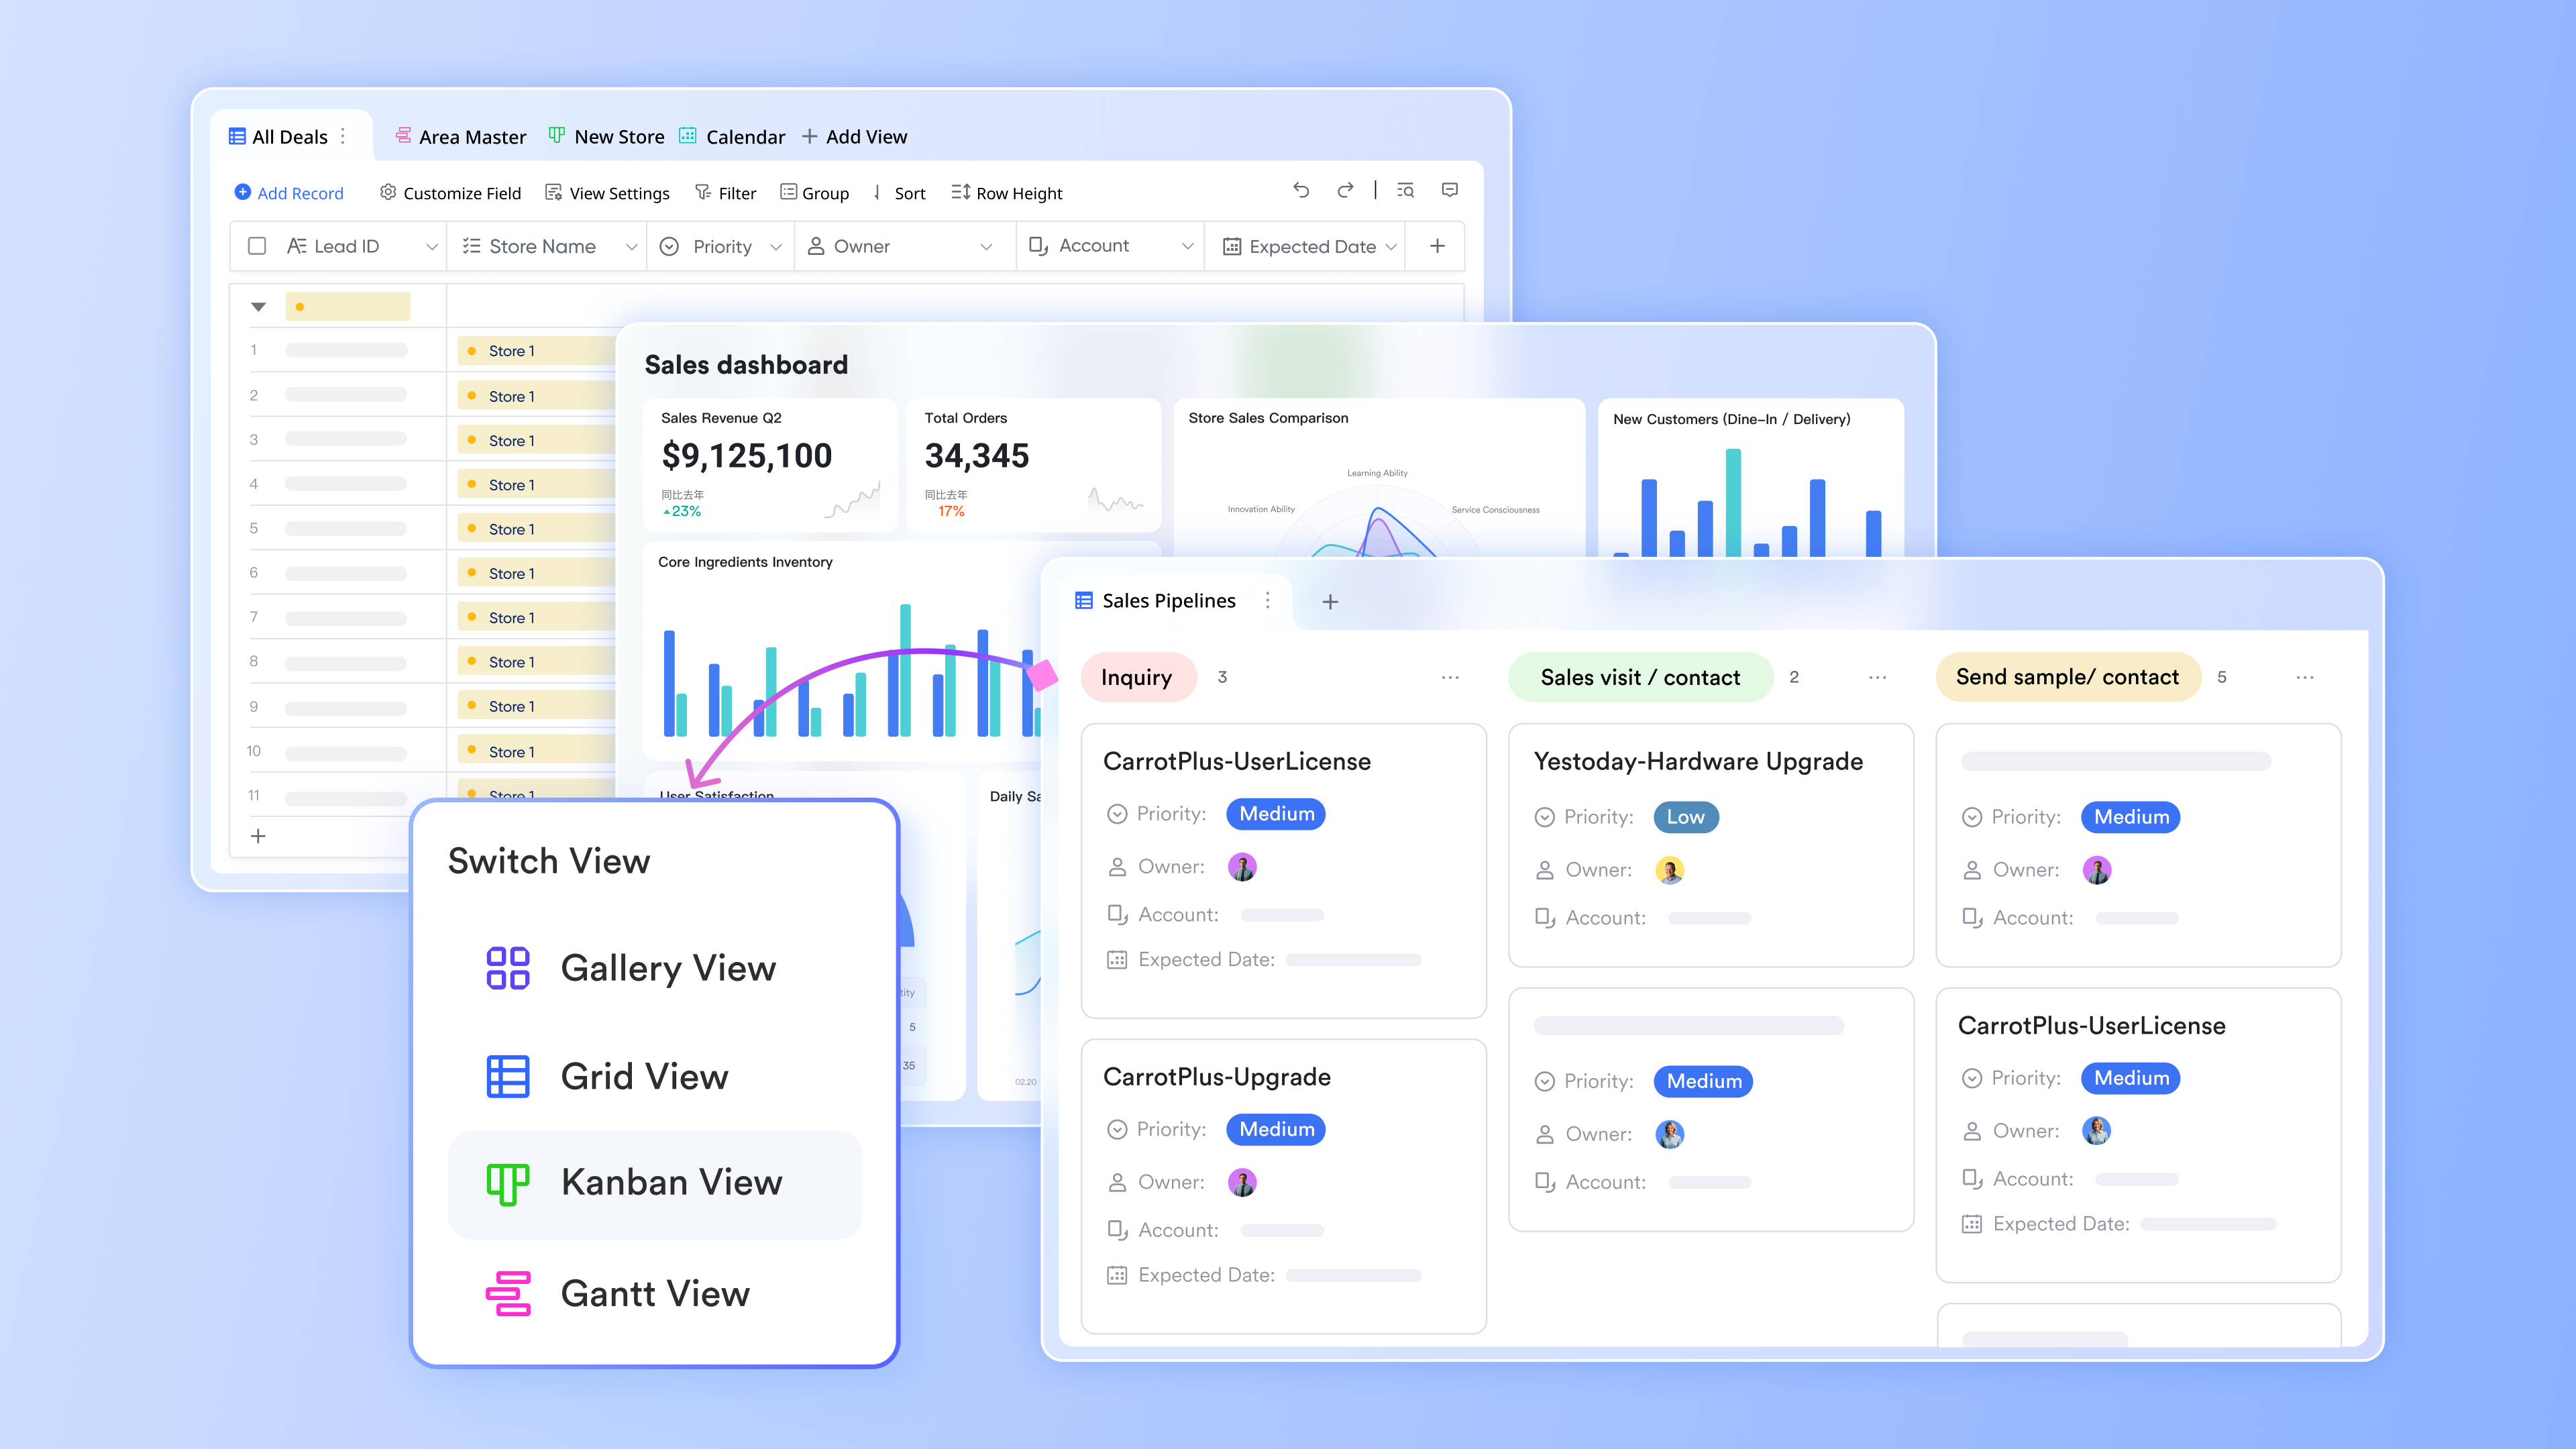
Lark Base pulls your operational records (deals, tickets, shipments, campaigns, invoices) into configurable views. List, Kanban, Calendar, Gallery, and then surfaces dashboards that chart KPIs directly from those records (pipeline value, win rate, SLA hit rate, on-time delivery, MQL→SQL conversion, DSO, etc.).
Why it matters: You're not staring at a static chart; you're one click from the row-level items causing a KPI to move.
Scenario: Your Sales KPI dashboard shows Win Rate ↓ 7 pts this quarter. You open the "Lost Deals (last 30 days)" widget, slice by competitor and stage, and see 62% lost at "Info Sec Review." You add a field to track "security blocker," tag owners, and watch the dashboard trendlines respond over the next two weeks.
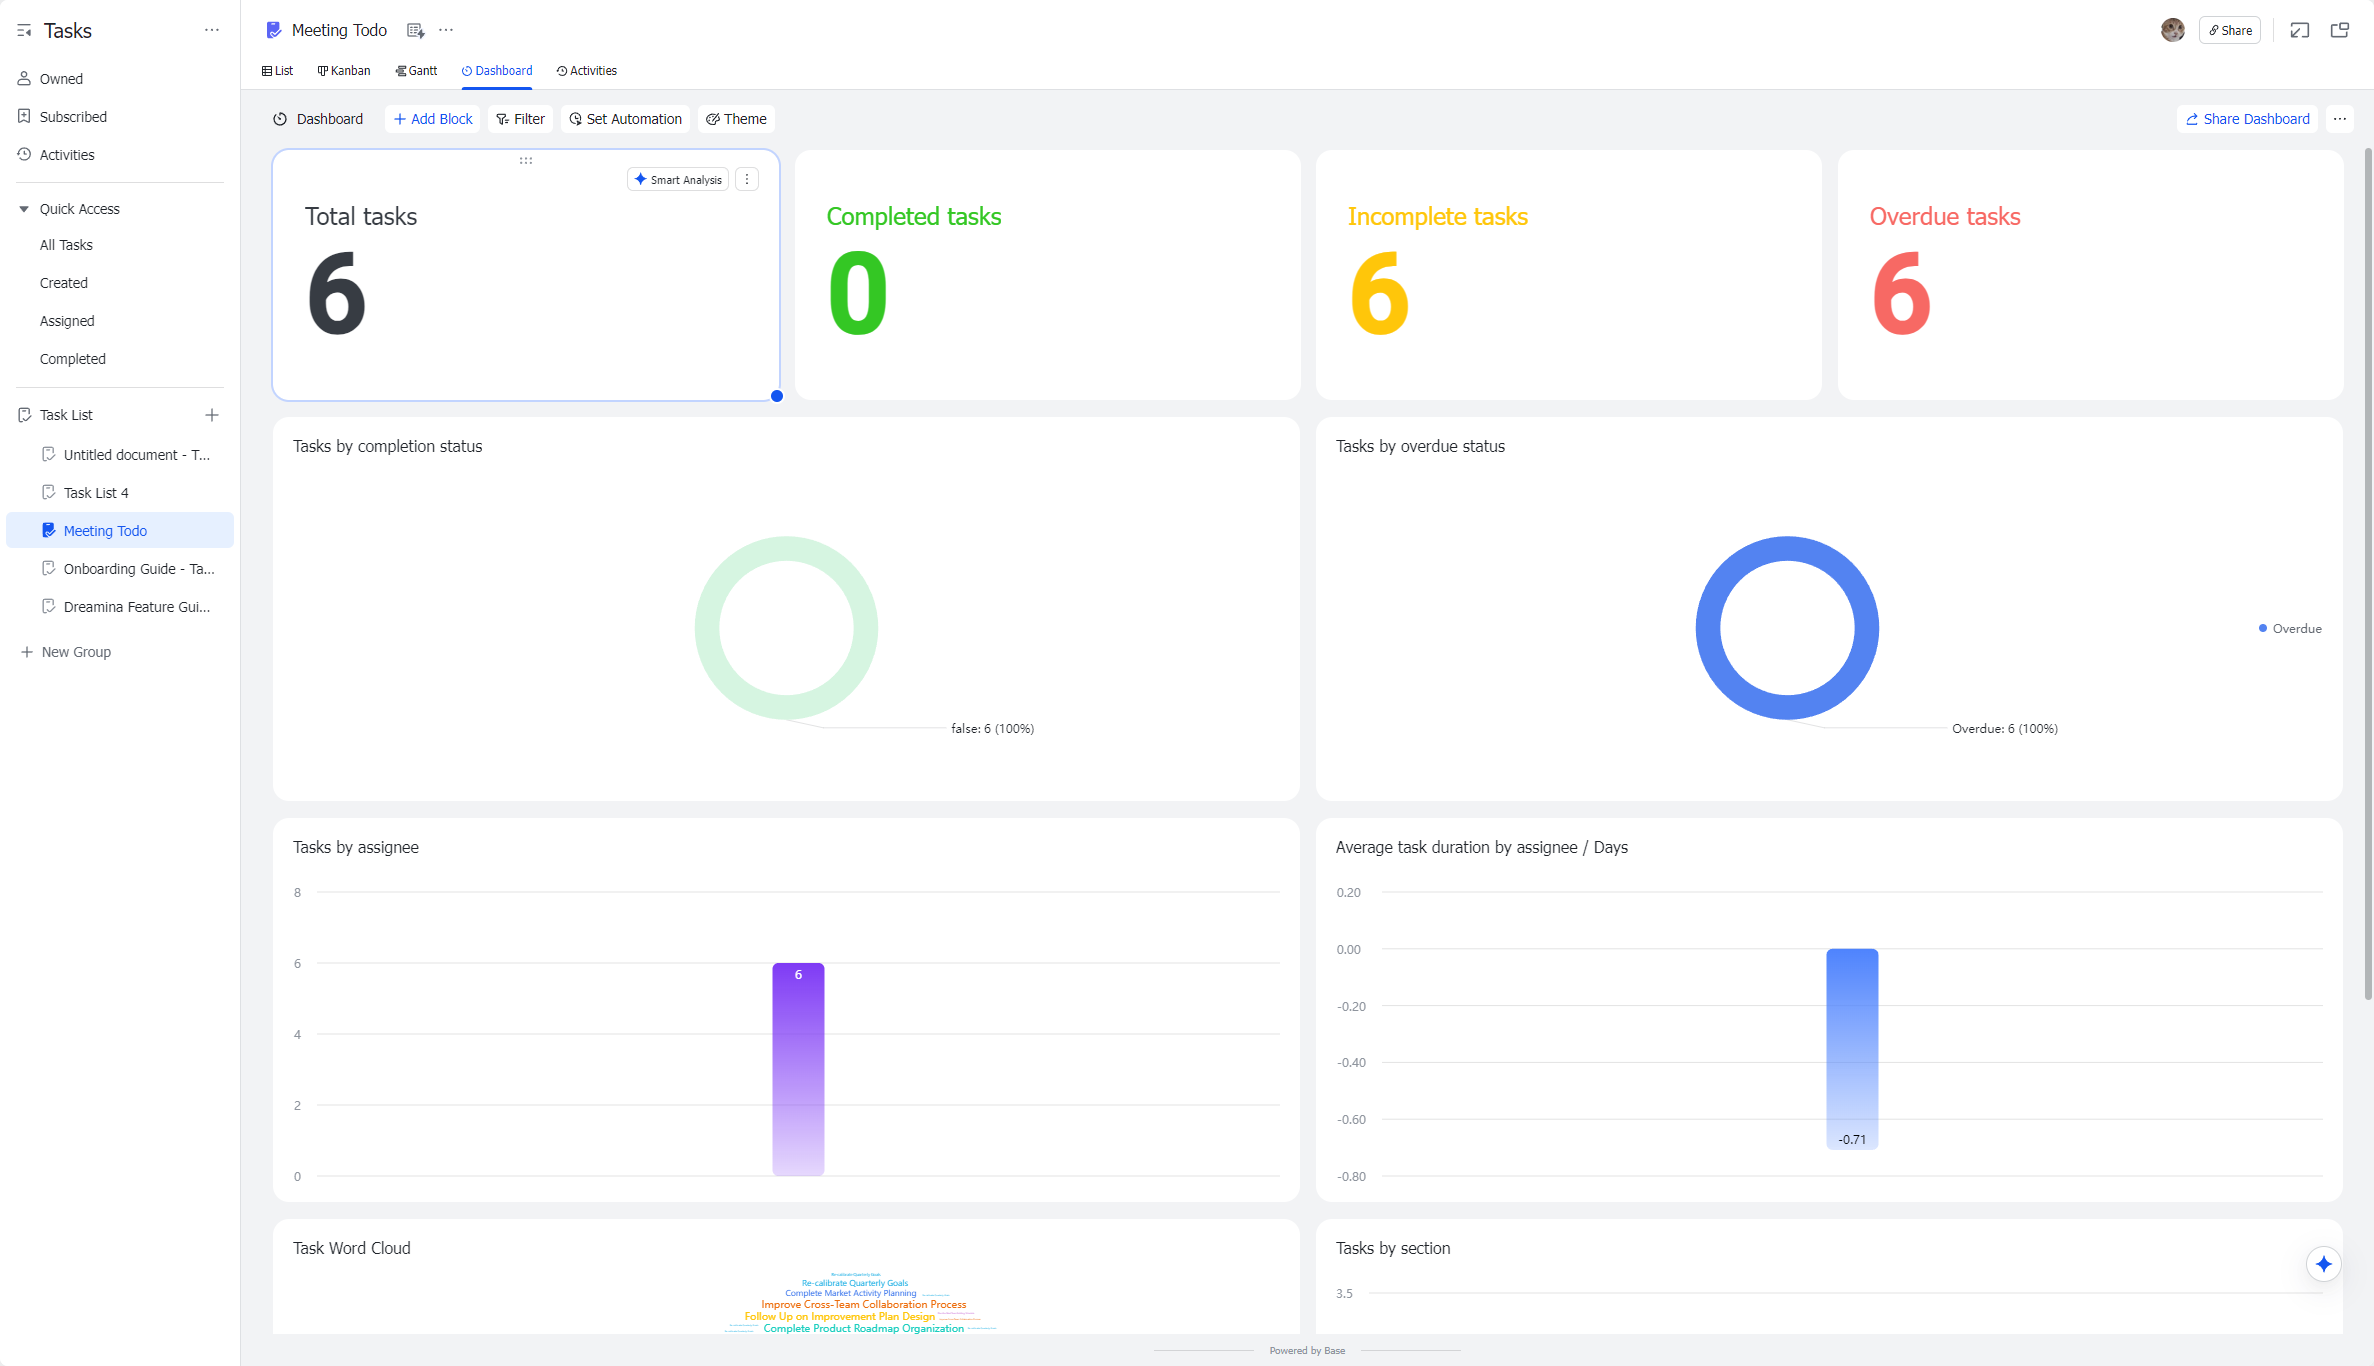
Lark Tasks: Turning the KPI dashboard into action
Lark Tasks transforms KPI dashboards from static metrics into actionable insights. By creating dashboards directly within task lists, teams can visualize progress, track completion rates, deadlines, and other key performance indicators all in one place. Each task is tied to an owner, due date, and priority, linking data from the dashboard to real-world action. This setup allows managers and team members to quickly identify bottlenecks, adjust priorities, and ensure KPI-driven workflows stay on track.
Why it matters: A KPI without an owner is a chart. A KPI with an owner is a plan.
Scenario: The First response time KPI on your Support dashboard turns red at 7m (target ≤ 3m). You trigger a play: create tasks for queue rebalancing, a staffing calendar tweak, and a macro update. Each Task is auto-linked to the "FRT Investigation" board. Next stand-up, the team sees progress against the KPI and the chart returns to green.
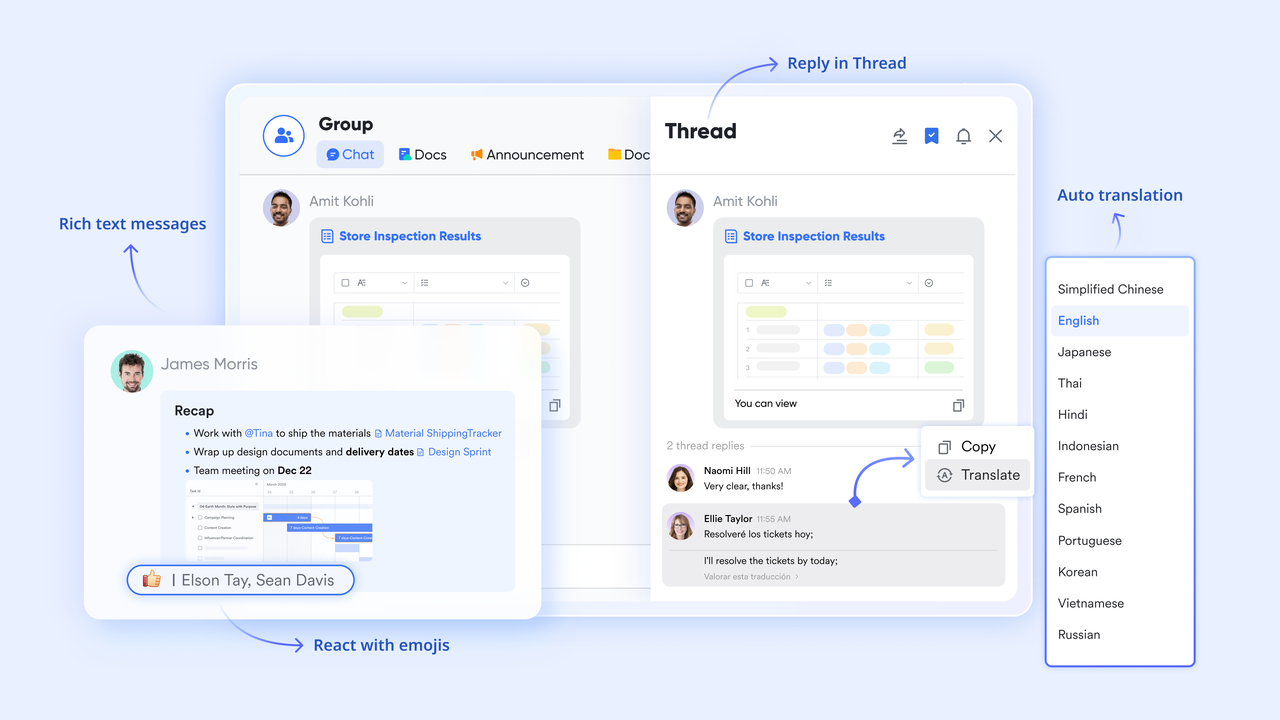
Lark Messenger: Discuss KPIs in context for faster decisions
Based on any objective or fall-short goal, you can instantly open Lark Messenger, create a group of stakeholders, and start a thread that references that exact view/record set. Mention owners, pin the importance of the conclusion, flag the message of urgency, and attach Docs for deep discussion.
Why it matters: Decisions move at the speed of shared context; Messenger keeps the chart + conversation together.
Scenario: Marketing sees CAC creeping up on the dashboard. In the chart thread, the performance lead pastes two Lark Docs links of cost details from last week, tags Finance to confirm invoice timing, and tags Creative for new ad variants. In 15 minutes, the team aligns with pausing two ad groups, testing three fresh hooks, and revisiting landing-page load times. The decision trail stays pinned to the KPI.
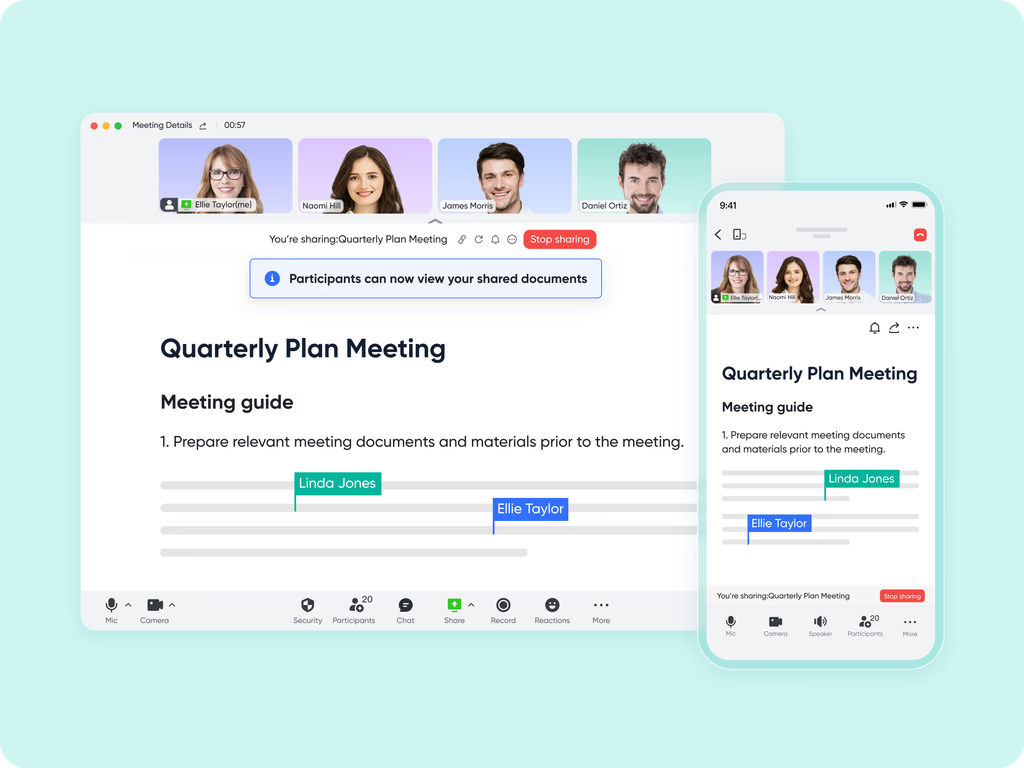
Lark Meetings & built-in Magic Share: Review dashboards live with cross-team alignment
In Lark Meetings, open your Base dashboard with Magic Share so everyone can interact with the same live view filter, sort, pivot, and drill without screen-share lag or "send the latest file" moments.
Why it matters: Alignment happens when everyone sees the same numbers and can explore together.
Scenario: Your Sales KPI dashboard shows Win Rate ↓ 7 pts this quarter. You open the "Lost Deals (last 30 days)" widget, slice by competitor and stage, and see 62% lost at "Info Sec Review." You add a field to track "security blocker," tag owners, and watch the dashboard trendlines respond over the next two weeks.
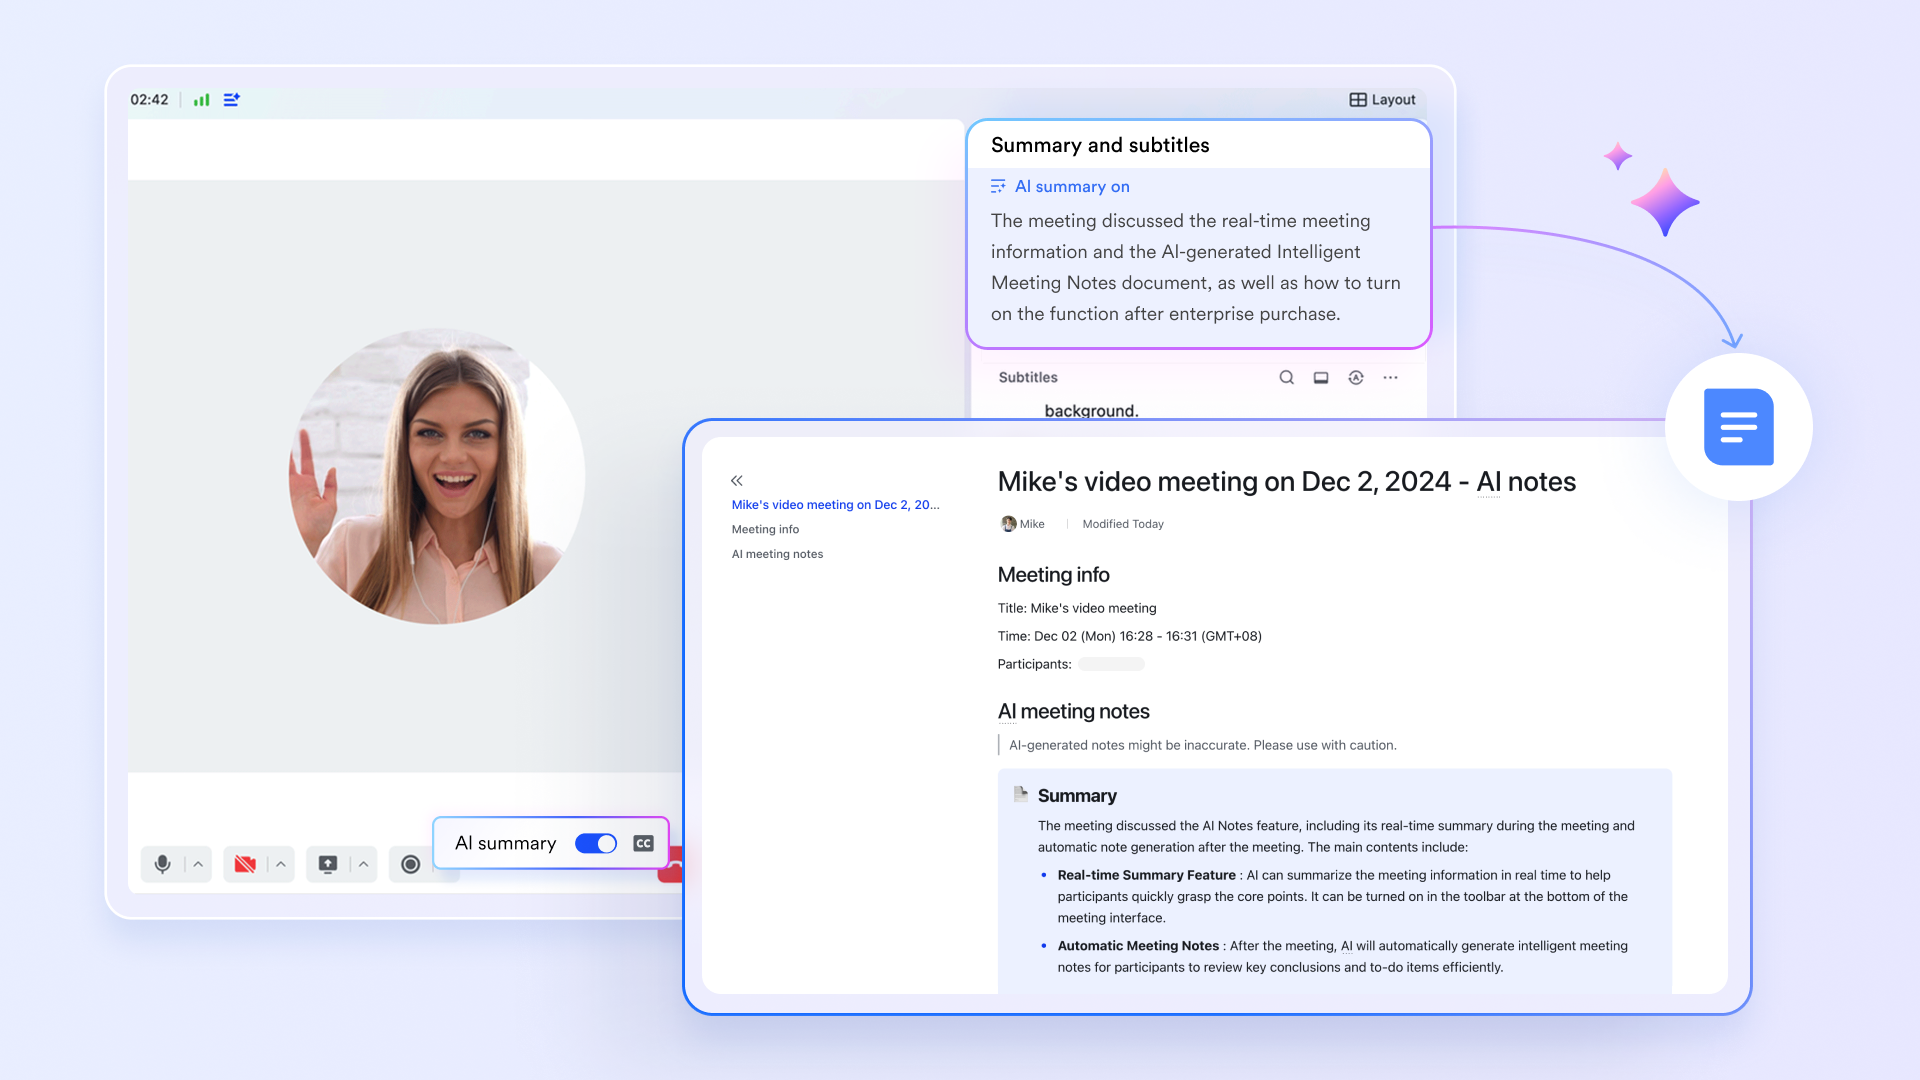
AI Meeting Notes: Capture KPI insights + action points automatically
What it does: After KPI reviews or ad-hoc huddles, AI Meeting Notes writes a structured recap: metric movements, root causes discussed, decisions made, owners, deadlines, and follow-ups. It links back to the dashboard and any referenced records.
Why it matters: Insights and commitments stick; no more lost context after meetings.
Scenario: Executive KPI check shows Gross Margin variance due to expedited shipping. AI Meeting Notes logs: (1) Cap overnight shipping to Tier-A only; (2) Update pricing guidance by Friday; (3) Ops to re-negotiate lane X. Next week, leaders open the summary and verify each action against the dashboard trend.
- Starter plan: Free forever plan that includes 11 powerful tools for up to 20 users. It also comes with 100GB of storage, 1000 automation runs, AI translations, and more.
- Pro plan: $12/user/month (billed annually) for up to 500 users. It includes everything in Starter plus group calling for up to 500 attendees, 15TB of storage, 50,000 automation runs, and more.
- Enterprise plan: Contact sales for custom pricing. Supports unlimited users and includes even more automation runs and advanced security, compliance, and management features.
Why KPI dashboards matter more than ever
In a data-driven world, organizations rely on countless tools CRMs, analytics suites, marketing platforms, HR systems, each generating its own reports and numbers. The result is a flood of disconnected data that's hard to interpret. This is where KPI dashboards become essential. They unify scattered metrics into a single, actionable view of performance, helping leaders and teams stay aligned and agile.
- Too many project management tools means scattered metrics: When data lives across multiple systems, teams spend more time gathering numbers than acting on them. A KPI dashboard consolidates key metrics from every source into all-in-one business software, providing a unified snapshot of business health.
- Hard to see what's blocking goals: Without visibility into bottlenecks, teams react slowly to performance dips. A KPI dashboard connects the dots, showing which processes, teams, or stages are holding back progress and where to intervene.
- Decisions take too long: Relying on outdated reports delays critical choices. With a live KPI dashboard, leaders can analyze real-time data, identify issues early, and take action immediately rather than waiting for month-end summaries.
- Teams lose focus without shared visibility: When everyone works from different metrics, priorities drift. A shared dashboard keeps all teams aligned with the same objectives and progress, reinforcing accountability and driving consistent improvement.
In short, KPI dashboards transform data overload into clarity, speed, and alignment empowering teams to focus on what truly drives results.
KPI dashboard best practices
Building a KPI dashboard isn't just about tracking numbers; it's about creating a tool that drives clarity, accountability, and action. The most effective dashboards stay focused on purpose and usability, ensuring that every metric connects to a business outcome. Follow these best practices to make your KPI dashboard a true decision-making engine:
- Tie KPIs to goals (not vanity metrics): Every KPI should reflect progress toward a specific objective, not just surface-level activity. Avoid metrics that look impressive but don't influence real outcomes. Align each indicator with a measurable business goal.
- Set clear ownership & frequency: Assign every KPI an owner and define how often it's reviewed or updated. Clear accountability ensures timely action and prevents performance gaps from going unnoticed.
- Keep dashboards simple & actionable: Focus on clarity over quantity. Limit metrics to what truly matters, use clean visuals, and design for quick interpretation so anyone can identify insights and act immediately.
- Review metrics in meetings, not in silos: A KPI dashboard should be part of team discussions, not a passive report. Reviewing it together fosters transparency, collaboration, and collective problem-solving.
- Use dashboards to celebrate wins: Dashboards aren't just for spotting issues; they're also for recognizing success. Highlight achievements to motivate teams and reinforce behaviors that drive performance.
Conclusion
A KPI dashboard is more than a reporting tool. It's a continuous performance management system that keeps teams focused, accountable, and aligned. By turning complex data into visual insights, it helps businesses spot trends early, take informed action, and measure real impact. The most effective dashboards are live, shared, and outcome-driven, not buried in spreadsheets or static slides.
With Lark, organizations can bring this to life effortlessly. Its connected workspace links KPI dashboards with the work itself from data tracking in Base to real-time discussions, tasks, and AI summaries. When visibility, collaboration, and action happen in one place, decisions become faster, and progress becomes measurable. Lark turns dashboards from static charts into engines of continuous improvement.
FAQs
What should a KPI dashboard include?
A KPI dashboard should include the most important metrics tied to business goals, along with clear visualizations like charts, graphs, and scorecards. It must show performance against targets, highlight trends, and use real-time or regularly updated data. A good dashboard keeps insights actionable and easy to interpret at a glance.
What is the difference between KPIs and OKRs?
KPIs (Key Performance Indicators) measure how effectively specific processes or goals are being met, focusing on performance tracking. OKRs (Objectives and Key Results) define broader objectives and measurable outcomes that drive growth and change. In essence, KPIs monitor performance, while OKRs set the direction and ambition.
What are the most important KPIs for a small business?
Small businesses should track KPIs like revenue growth, customer acquisition cost, profit margin, and cash flow. These metrics reveal how efficiently the business generates income, controls costs, and manages resources. Regular tracking helps identify strengths, weaknesses, and opportunities for improvement.
How often should KPI dashboards be updated?
KPI dashboards should ideally refresh in real time or daily to reflect the latest business activity. Frequent updates help teams react quickly to changes, avoid outdated decisions, and maintain momentum toward goals. The right update frequency depends on data availability and workflow speed.
Can KPI dashboards improve team performance?
Absolutely. By making progress transparent and measurable, KPI dashboards help teams stay aligned and focused on shared goals. They encourage accountability, identify areas for improvement, and celebrate achievements, all of which drive motivation and higher performance across the organization.
Related reading
Table of contents
Start using Lark today

Manage all your work in one place
Boost team efficiency by 10x
Save up to 70% on software costs
Table of contents
Start using Lark today
Manage all your work in one place
Boost team efficiency by 10x
Save up to 70% on software costs
Keep reading







2026 Lark Technologies Pte. Ltd.
Headquartered in Singapore with offices worldwide.






Explore: