The Lucidchart flowchart maker is one of the most widely used online tools for creating flowcharts, diagrams, and visual workflows. Designed as a cloud-based diagramming platform, Lucidchartlets teams build, edit, and share diagrams directly in a web browser without installing additional software. From simple process maps to complex technical diagrams, it offers drag-and-drop editing, templates, and real-time collaboration features that help teams visualize ideas and systems more clearly. In this guide, we will explore the key features, pricing options, and the best alternatives to the Lucidchart flowchart maker, so you can decide whether it is the right diagramming tool for your needs.
What is a flowchart?
A is a visual diagram that represents a process, workflow, or sequence of steps using standardized symbols such as arrows, rectangles, and diamonds. It helps people understand how a process works by showing the flow of actions from start to finish. Flowcharts are widely used in business processes, software development, , and system design. Tools like the Lucid chart flowchart maker make it easier to create and share these diagrams digitally, allowing teams to map processes, identify inefficiencies, and communicate ideas more clearly.
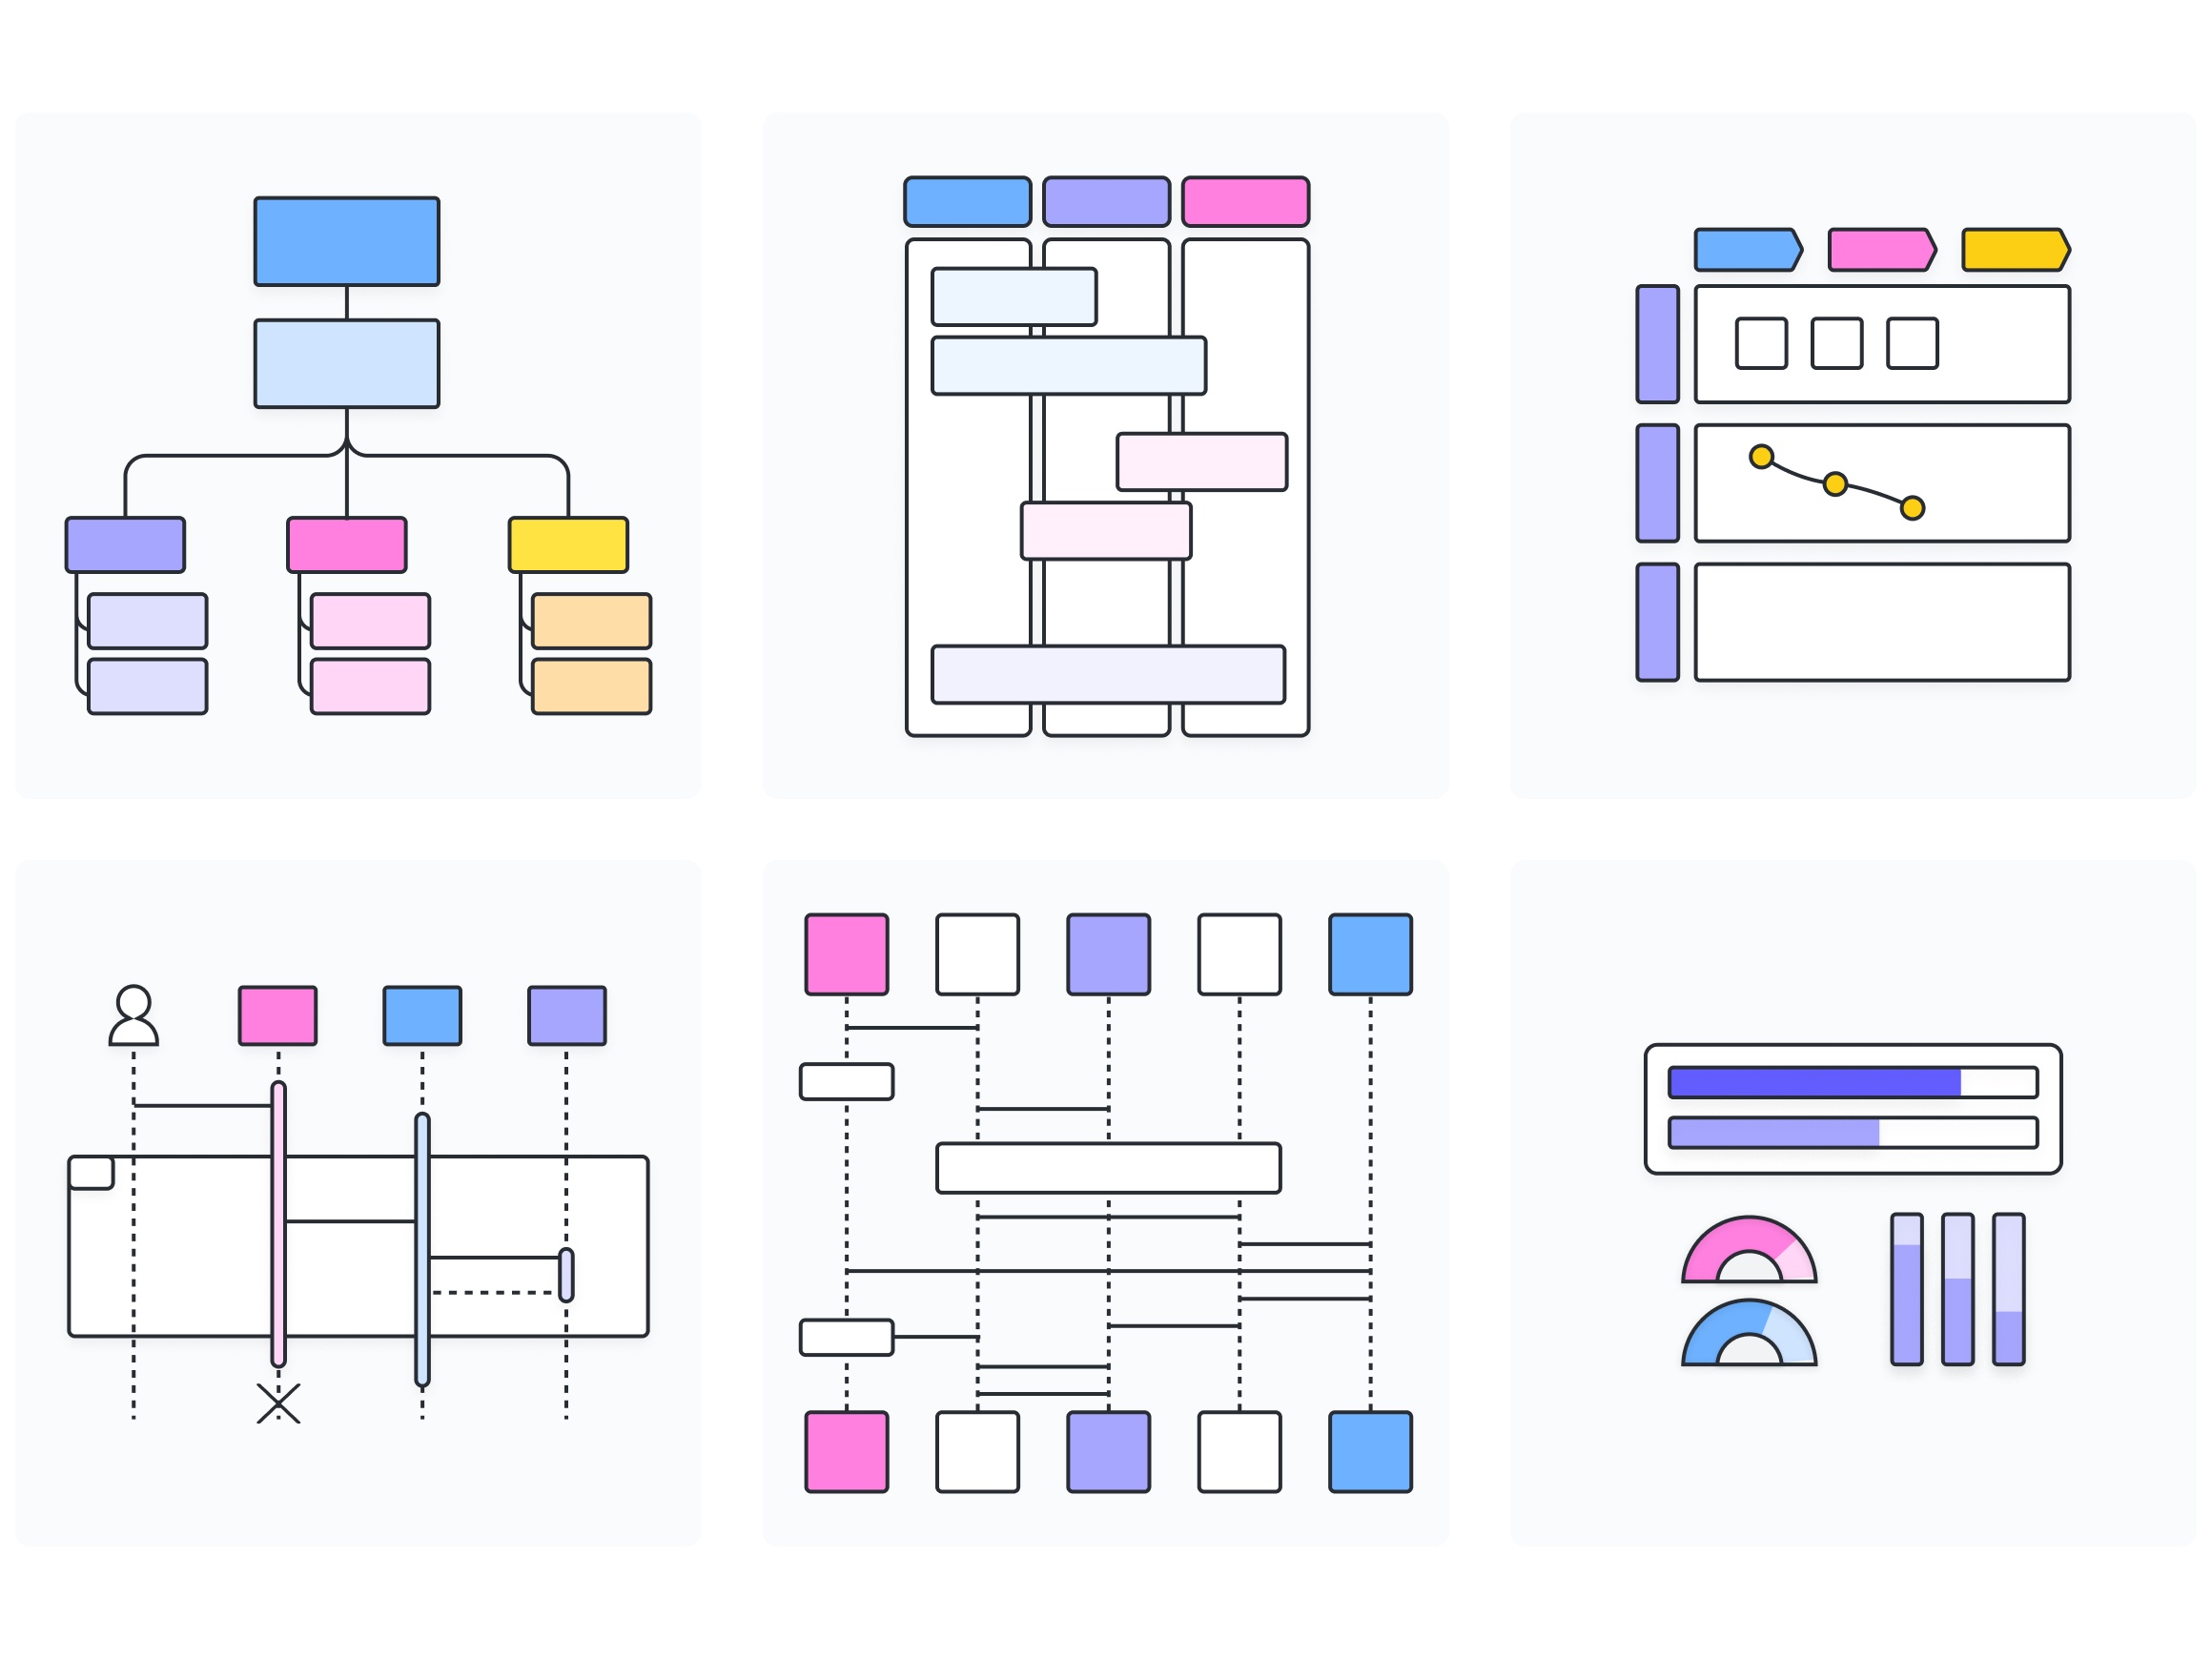
Image source: lucidchart.com
What does Lucidchart flowchart maker offer?
The Lucidchart flowchart maker provides a wide range of tools that help individuals and teams create clear, professional diagrams with minimal effort. Its cloud-based platform focuses on simplicity, collaboration, and integration, making it suitable for , system design, and workflow visualization.
- Drag-and-drop diagram builder: Lucidchart includes an intuitive drag-and-drop editor that lets users easily place shapes, connectors, and symbols on the canvas. Instead of manually designing diagrams, users can quickly build flowcharts by selecting elements from a library and arranging them visually. This approach simplifies diagram creation and helps users focus on mapping processes rather than dealing with complex design tools.
- Flowchart templates: The platform offers a large collection of ready-to-use templates for various diagram types, including process flows, organizational charts, network diagrams, and project workflows. These help users get started quickly by providing structured layouts that can be customized according to specific needs. Templates are especially helpful for beginners who want to create diagrams without starting from scratch.
- Real-time collaboration: One of Lucidchart's key strengths is its real-time collaboration. Multiple users can work on the same diagram simultaneously, add comments, suggest edits, and track changes. This feature makes it easier for distributed teams to collaborate on workflows and review processes together, and to keep diagrams updated without sending multiple file versions.
- Integration ecosystem: Lucidchart integrates with many widely used productivity and project management tools. It connects with platforms such as Google Workspace, Microsoft 365, Slack, and Atlassian tools like Jira and Confluence. These integrations allow teams to embed diagrams within their workflows, share visual documentation, and connect diagramming with everyday work processes.
- Export and sharing controls: The tool also provides flexible options for exporting and sharing diagrams. Users can download diagrams in formats such as PDF, PNG, or SVG, or share them through direct links with access permissions. These controls make it easier to distribute diagrams within teams, present them to stakeholders, or include them in reports and documentation.
Lucid chart flowchart features
The flowchart maker Lucidchart offers a wide range of features that support different diagramming needs, from to complex technical systems. Its flexible tools make it useful for businesses, developers, educators, and teams that want to visualize processes clearly. In many cases, it can also be used in scenarios similar to an Arduino flowchart maker, helping users design and explain logical workflows.
- Basic process mapping: One of the most common uses of the flowchart maker Lucidchart is mapping business processes and workflows. Teams can visually outline steps in a process, identify decision points, and highlight dependencies between tasks. This helps organizations document procedures, simplify complex operations, and improve efficiency by clearly showing how each step connects within a workflow.
- Technical system architecture: Lucidchart is widely used for designing system architecture diagrams in IT and software development. Engineers and developers can map databases, APIs, servers, and application layers to illustrate how different components interact. These diagrams help technical teams plan infrastructure, communicate system designs, and document architecture for future development or maintenance.
- Arduino flowchart maker scenarios: In electronics and embedded system projects, flowcharts help explain how hardware and software interact. While Lucidchart is not specifically built as an Arduino flowchart maker, it can easily be used to map Arduino program logic, sensor workflows, and microcontroller processes. This helps developers visualize how different components respond to inputs, conditions, and outputs.
- Educational use cases: Teachers and students often use flowcharts to simplify complex topics and explain logical processes. The platform allows educators to create diagrams for programming concepts, scientific processes, and . Visual diagrams make learning easier by breaking down information into structured steps that are easier to understand and remember.
- Cross-team brainstorming diagrams: The flowchart maker Lucidchart also supports collaborative brainstorming sessions. Teams can create diagrams together to plan projects, explore ideas, and map strategies. With real-time editing and commenting features, team members can quickly add suggestions, refine workflows, and build visual plans that guide decision-making and project execution.
Need a unified workflow visualization tool?
How to make a flowchart in Lucidchart
Creating a flowchart in the Lucidchart flowchart maker is simple and beginner-friendly. The platform provides an intuitive interface with drag-and-drop shapes, connectors, and ready-made templates that help users quickly build clear process diagrams. By following a few basic steps, individuals and teams can visualize workflows, map decisions, and organize complex processes into easy-to-understand diagrams.
Step 1: Create a new document
Log in to Lucidchart and click New to start a blank document. You can also select a if you prefer a pre-built structure. Templates are useful for standard processes like decision trees, system flows, or organizational workflows.
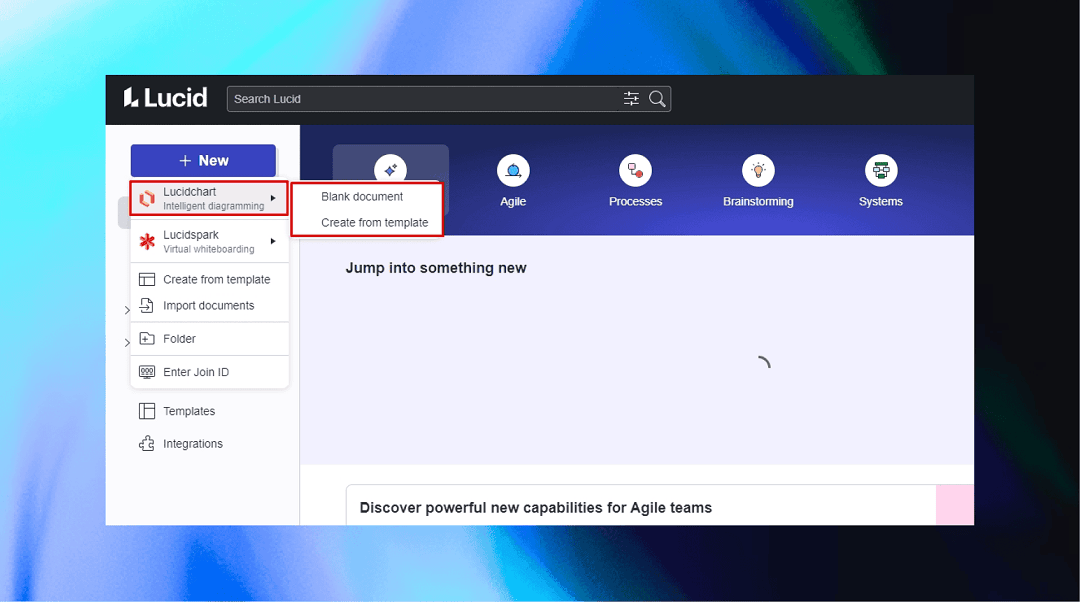
Image source: lucid.app
Step 2: Enable the flowchart shape library
Open the Shapes panel on the left sidebar and ensure the Flowchart shape library is enabled. This gives you access to standard symbols such as:
Drag shapes directly onto the canvas.
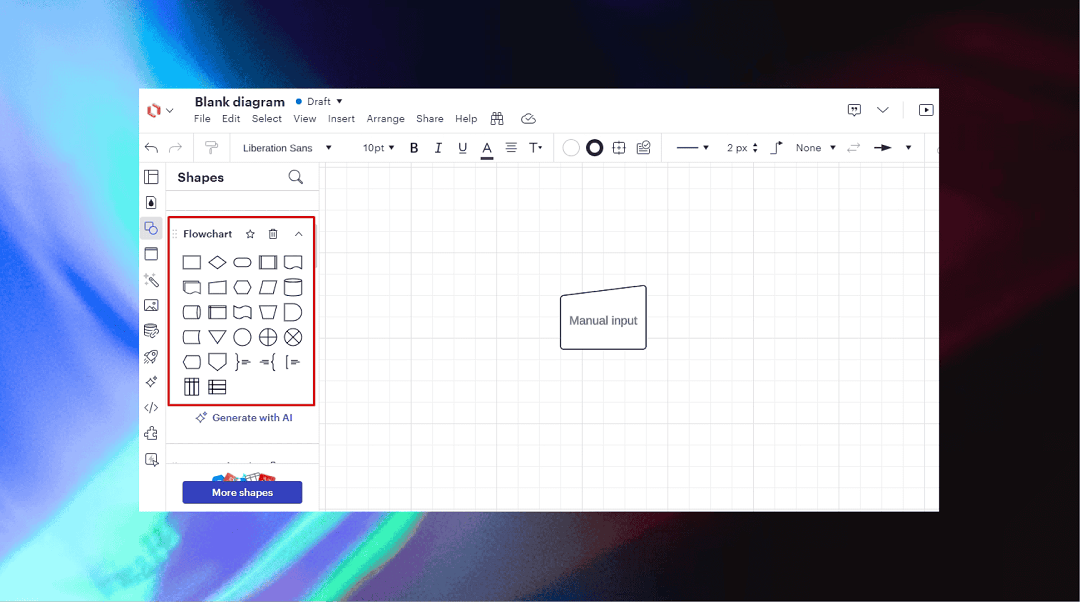
Image source: lucid.app
Step 3: Add and arrange flowchart symbols
Place your shapes in logical order from top to bottom or left to right. Maintain consistent spacing for clarity. Use alignment tools to evenly distribute objects and improve readability.
Tip: Keep decision nodes clearly separated to avoid visual clutter.
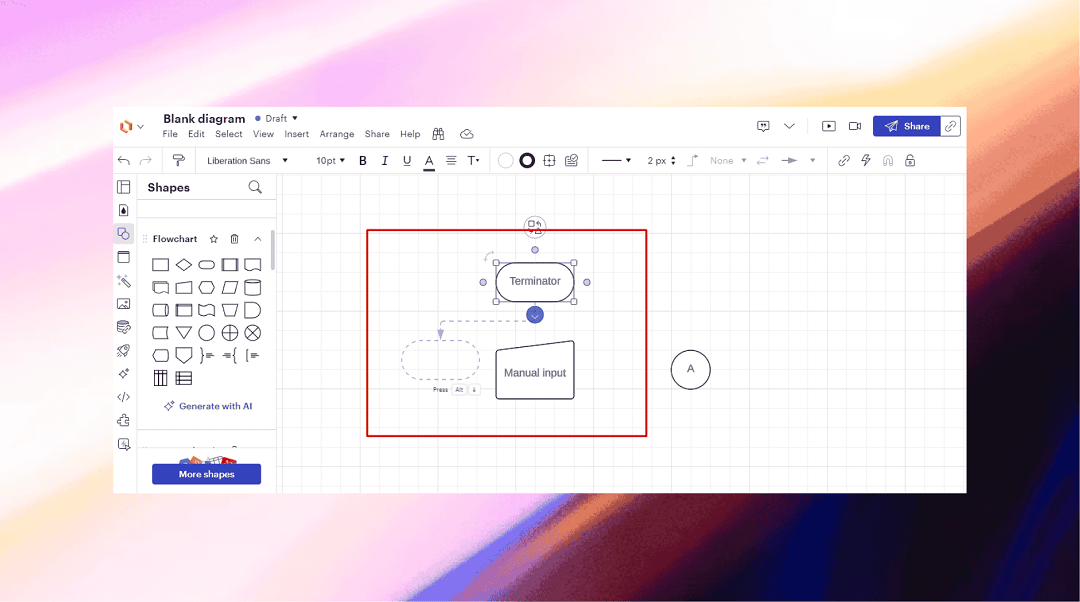
Image source: lucid.app
Step 4: Connect shapes with arrows
Use the connector tool to draw arrows between shapes. Lucidchart automatically snaps connectors to anchor points, helping maintain a clean diagram structure. Ensure each process step has a clear input and output path.
Step 5: Add text and labels
Double-click inside any shape to add text. Keep descriptions short and action-focused. Label decision branches (e.g., Yes/No) to clarify logic flow.
Lucidchart pricing comparison and value analysis
Lucid offers separate pricing tiers across four different plans, with options designed for individuals, teams, and enterprises.
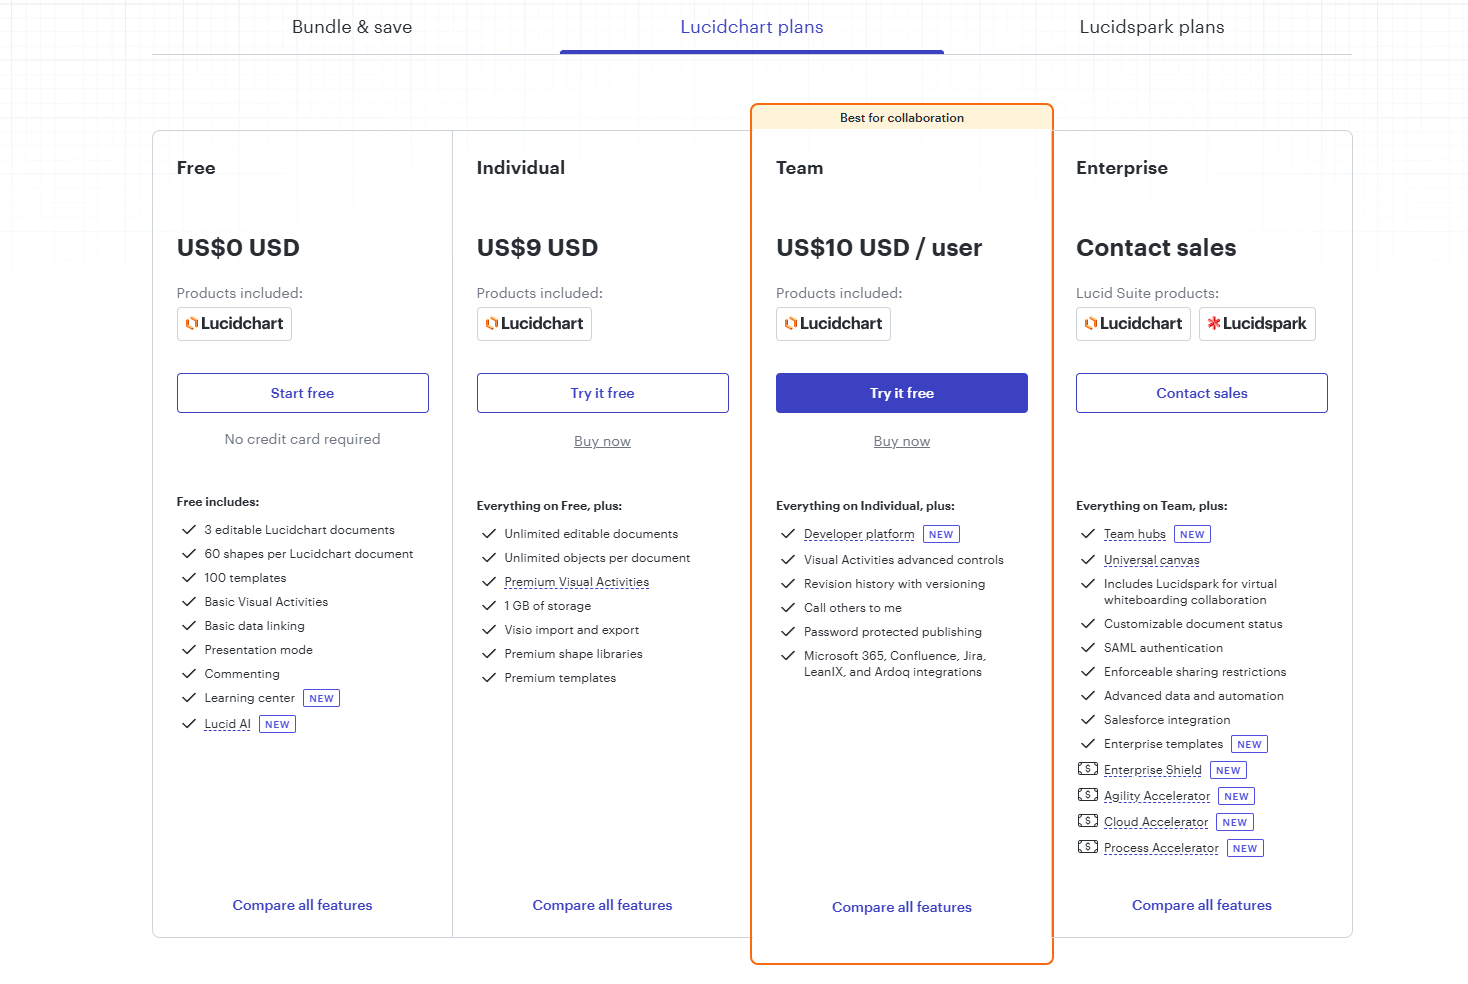
Information source: lucid.app
Update time: 2026-03-03
Note: Pricing and plan details reflect publicly available data as of the update date and may vary based on region, billing cycle, and number of agents.
Discover a robust alternative at affordable pricing
When Lucidchart flowchart maker is the right choice
The Lucidchart flowchart maker is a strong option when the main goal is to create clear visual diagrams and process maps. It works especially well for individuals or teams that need a simple, cloud-based tool for designing workflows, explaining ideas, or documenting systems without requiring complex features.
- Pure diagram creation needs: Lucidchart is ideal for users who mainly need to design diagrams such as flowcharts, organizational charts, and system architecture visuals. Its drag-and-drop editor, symbol library, and templates allow users to build professional diagrams quickly. When the focus is on visual documentation rather than managing operational workflows, the platform provides an efficient and straightforward solution.
- Academic or lightweight use: Students, educators, and small teams often use Lucidchart for learning, teaching, and presenting ideas. It helps explain algorithms, project steps, or research processes through simple . Because the interface is easy to learn and the tool is cloud-based, it works well for classrooms and lightweight projects where advanced automation is not necessary.
- Short-term visualization projects: Lucidchart is also a good choice for short-term projects that require temporary diagrams or process visualizations. Teams can quickly map workflows for presentations, planning sessions, or documentation tasks. Since diagrams can be shared and exported easily, the platform works well for quick visualization needs without requiring long-term system integration.
Where Lucidchart falls short
The Lucidchart flowchart maker is a popular used by teams to visualize processes and workflows. While it offers powerful diagramming capabilities and collaboration features, it also has some limitations in workflow automation and operational execution. Understanding both strengths and limitations helps users decide whether it fits their needs.
- Limited workflow automation: Although Lucidchart is excellent for , it does not provide strong automation capabilities to execute those workflows. Users can design process diagrams, but additional tools are often required to automate or manage the actual tasks involved in those processes.
- Fragmented task execution: Lucidchart focuses mainly on diagramming rather than task management. As a result, teams may still need separate project management or workflow tools to assign tasks, track progress, or manage operational workflows linked to the diagrams.
- Dependency on third-party integrations: Many advanced workflow capabilities rely on integrations with other platforms, such as project management or productivity tools. While integrations are available, users often need additional software to fully manage workflows beyond diagram visualization.
Turn strategy into action with high-velocity teamwork
Meet Lark: Connect teamwork and visual workflow execution
is an all-in-one collaboration workspace that combines messaging, meetings, documents, project management, approvals, and AI-powered workflows in a single platform. Instead of separating diagram creation from execution tools, Lark allows teams to visualize processes, assign tasks, , and collaborate in context without switching systems.
Interactive workflow mapping
functions as a central canvas where teams can embed diagrams, flowcharts, and project documentation in one workspace. Teams can embed live views to connect workflow diagrams with structured project data. Within Base, one-way and two-way link fields allow records to connect across tables, enabling teams to reference related tasks, resources, or project stages while maintaining real-time visibility into workflow progress.

Digital whiteboard for custom flowcharts
Lark Board offers a versatile infinite canvas designed to transform static documentation into dynamic, visual workflows. It empowers users to build comprehensive flowcharts using a wide array of specialized shapes, connectors, and swimlane diagrams that keep complex processes organized and readable. Beyond manual creation, the tool enables seamless upgrades of legacy flowcharts into fully interactive boards. 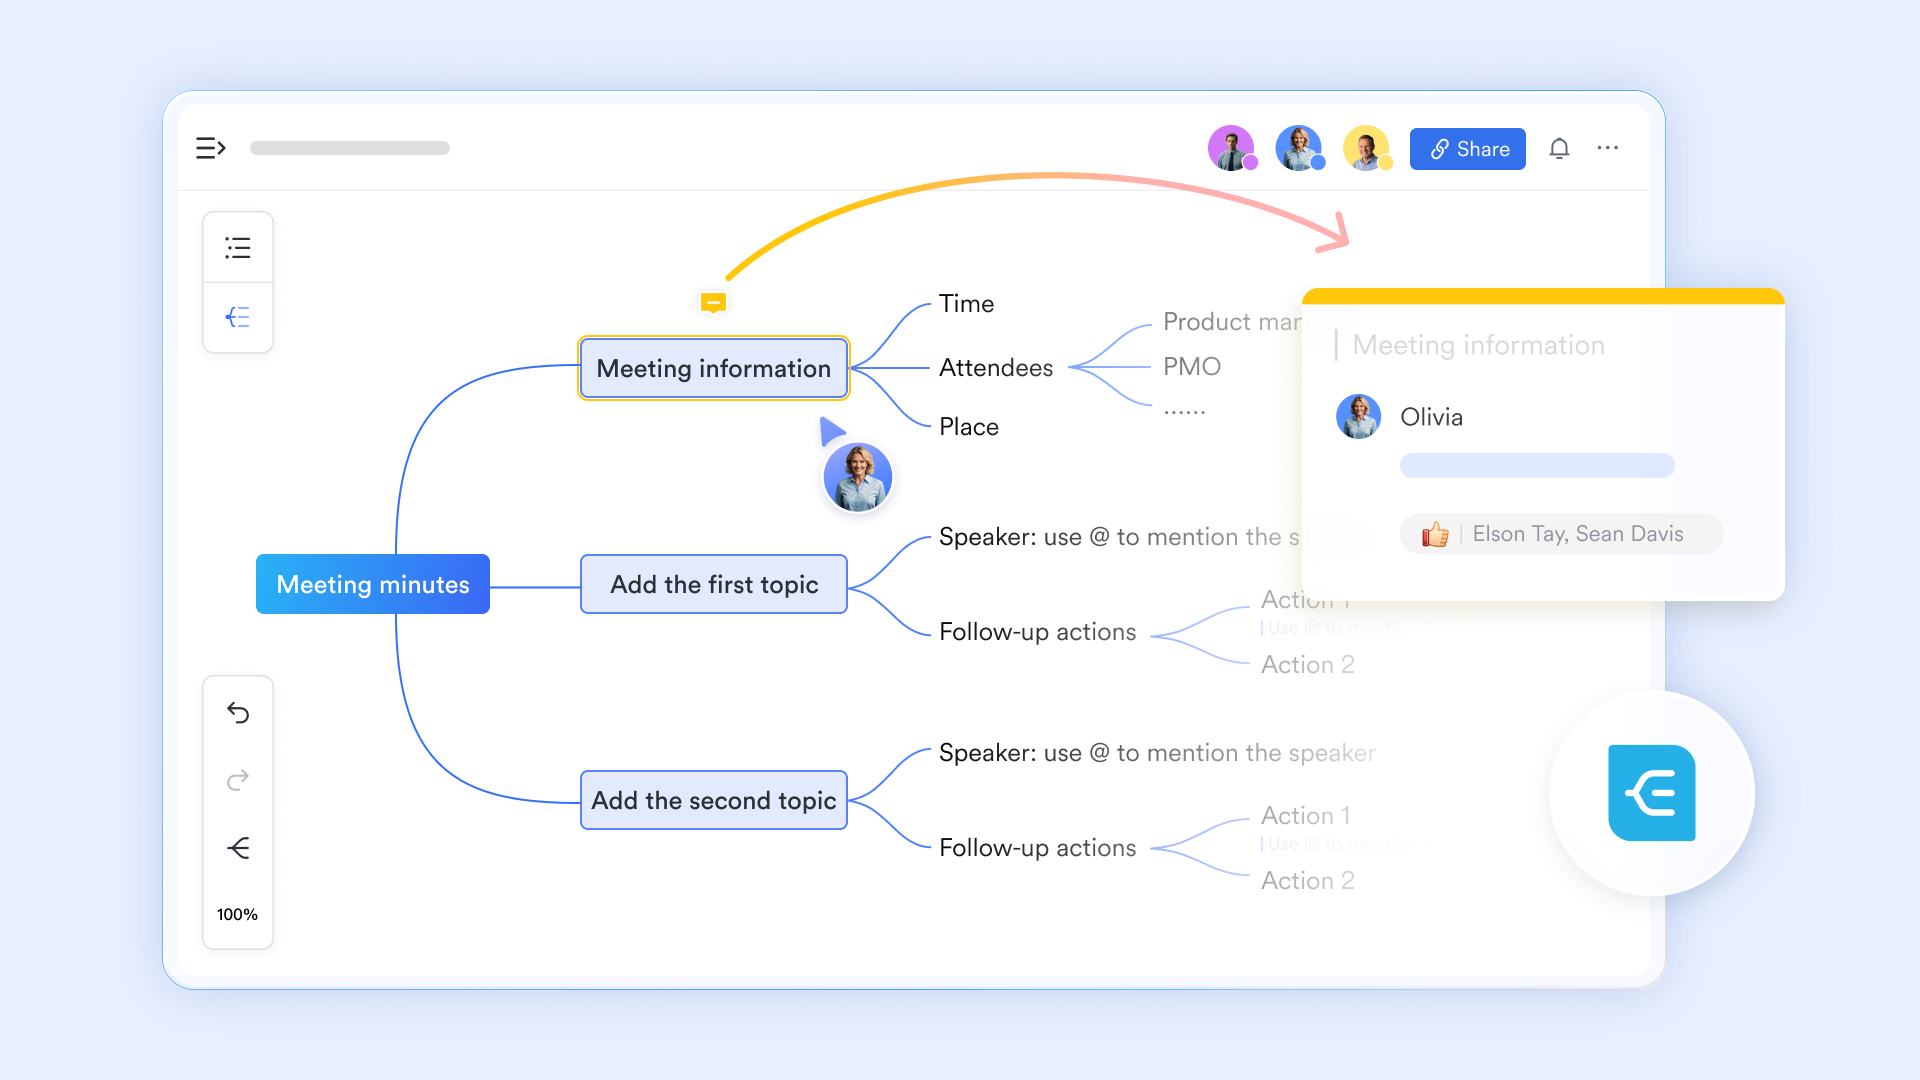
Actionable execution tracking
Lark Tasks serves as the primary engine for individual and team accountability. This feature allows users to create tasks directly from a chat or a document in Lark Docs. Once created, these tasks can be grouped into "Task Lists" with specific due dates and priority tags, sending automatic reminders to assignees within the Lark notification center to ensure execution stays on track. 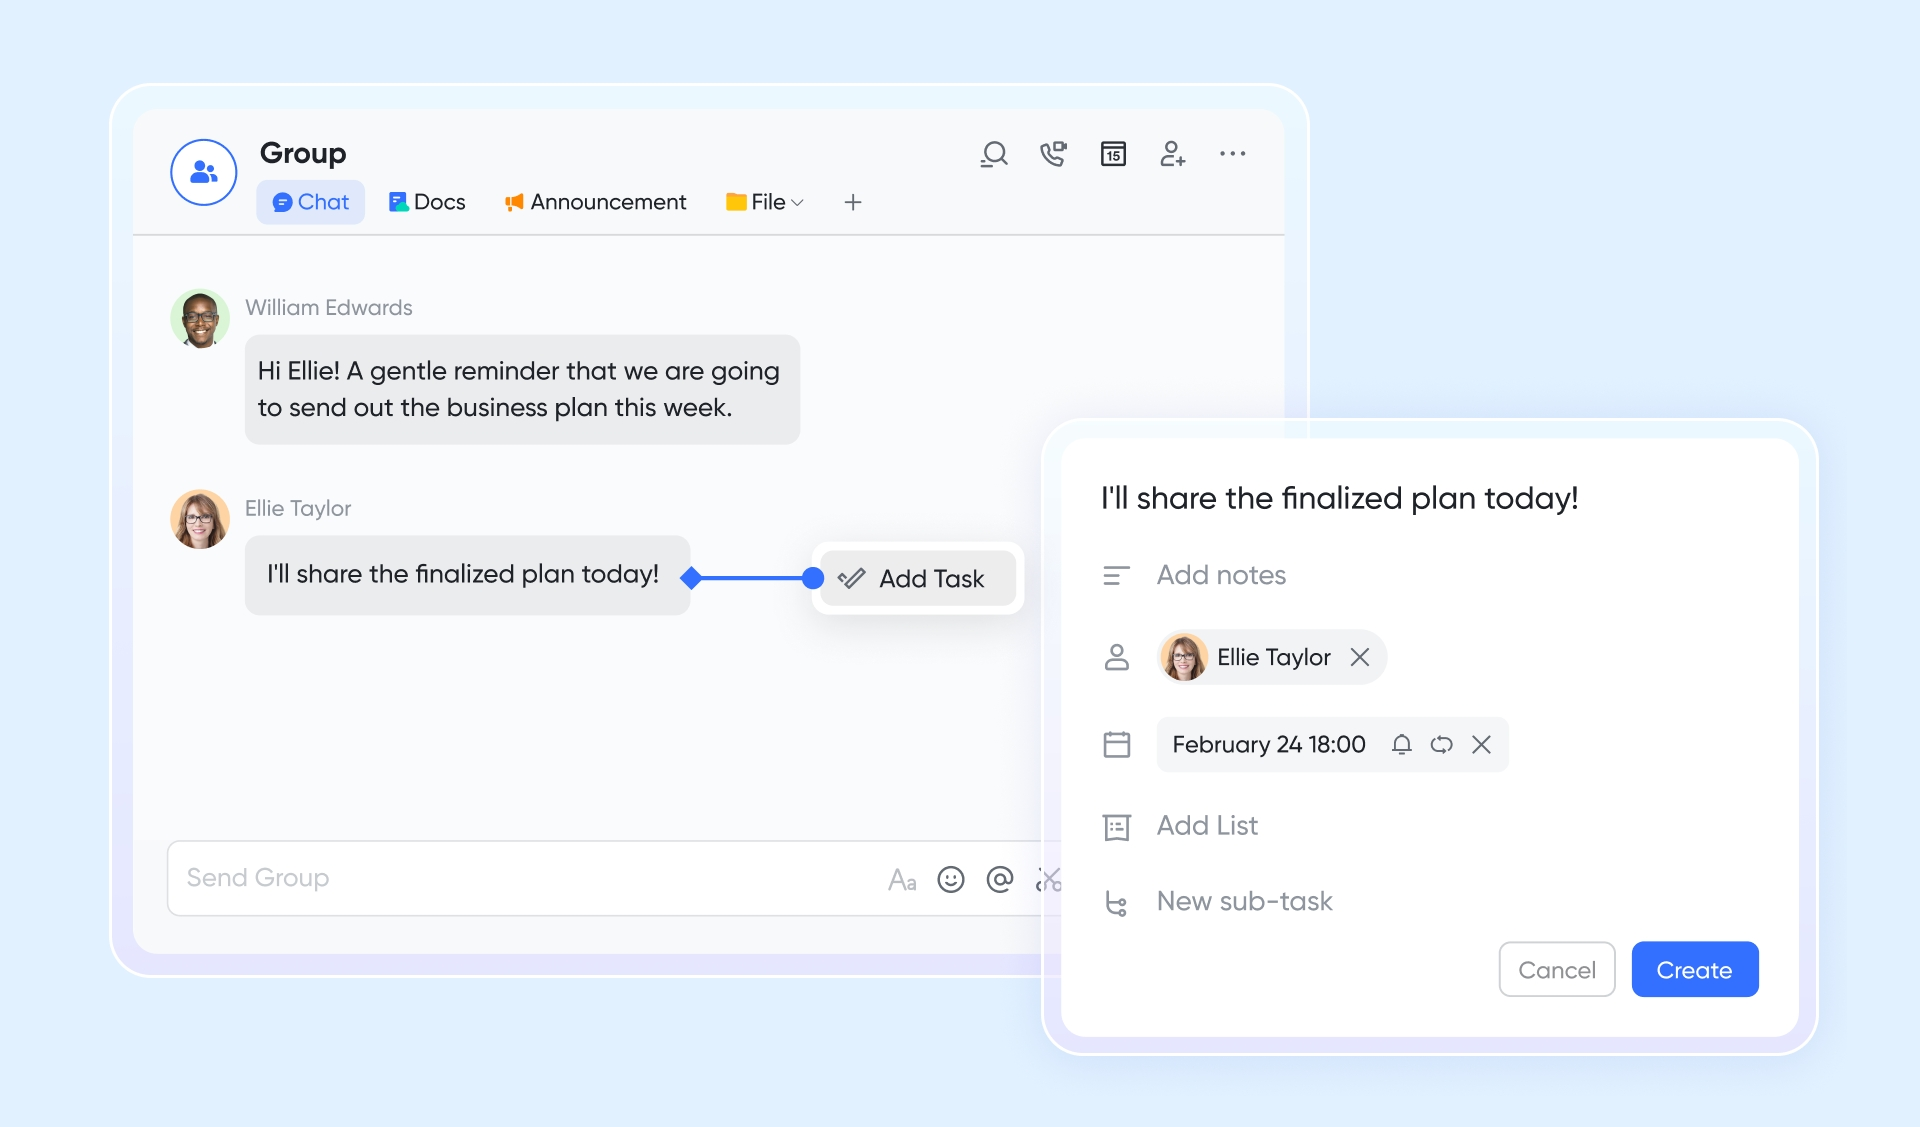
Multi-perspective process boards
Lark Base provides the visual framework for complex project management through its diverse view functions. Teams can transform raw data into a for stage-based tracking or a Gantt view for timeline-dependent workflows. This allows project leads to visualize bottlenecks and resource allocation across the entire execution phase within a single Lark interface. 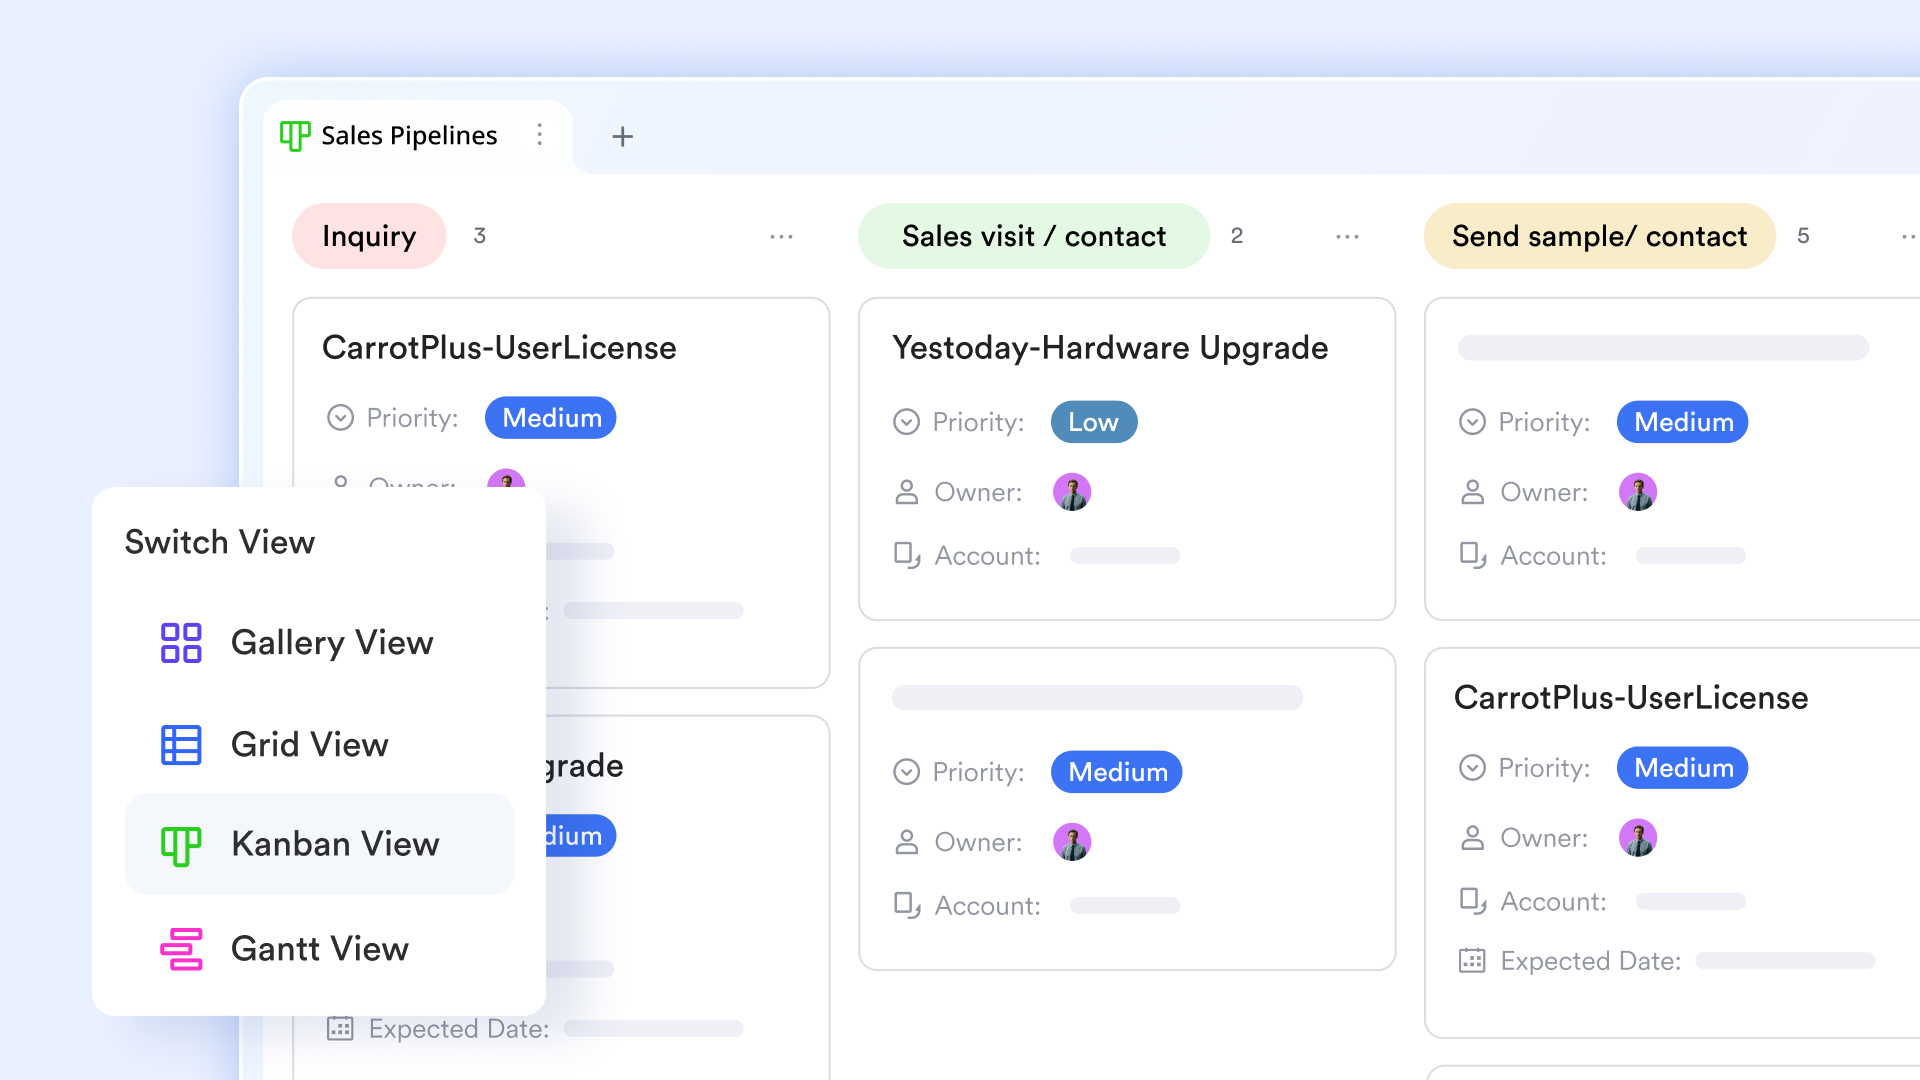
:
- Starter plan: Free forever plan that includes 11 powerful tools for up to 20 users. It also comes with 100GB of storage, 1000 automation runs, AI translations, and more.
- Basic plan: $6/user/month (billed annually) for up to 500 users. It includes everything in Starter plus group calling for up to 500 attendees, 5TB of storage, 1000 automation runs, and more. For more details, please .
- Pro plan: $12/user/month (billed annually) for up to 500 users. It includes everything in Basic plus group calling for up to 500 attendees, 15TB of storage, 50,000 automation runs, and more.
- Enterprise plan: for custom pricing. Supports unlimited users and includes even more automation runs and advanced security, compliance, and management features.
For small teams with simple communication needs

18 months message history
1000 Base automation runs/month
2000 rows per table in Base
Most POPULAR
For companies with comprehensive collaboration and management needs
Unlimited message history
500-participant video meetings
50k Base automation runs/month
20k rows per table in Base
For large companies with advanced security and organizational management needs
Get a personalized demo and pricing
Unlimited message history
500-participant video meetings
15 TB storage + 30 GB storage/user
500k Base automation runs/month
50k Base automation runs/month
Most POPULAR
For companies with comprehensive collaboration and management needs
Unlimited message history
500-participant video meetings
50k Base automation runs/month
20k rows per table in Base
Final verdict: Lucidchart vs Lark compared
and Lark serve different purposes for teams. Lucidchart focuses on diagramming and flowchart creation, while Lark provides a broader collaboration workspace that combines communication, documents, and workflow management in one platform.
Choose Lucidchart if your primary focus is on high-end professional diagramming, complex technical architecture, or data-linked visualizations. It is the choice for specialized engineers and designers who require industry-standard styling, extensive shape libraries, and the ability to overlay live data onto diagrams.
Choose Lark if you want to bridge the gap between planning and execution within a single workspace. It is ideal for teams that want to turn flowcharts into actionable workflows, utilizing built-in communication, advanced task automation, and a consolidated cost structure.
Conclusion
Choosing the right flowchart tool depends on how teams plan to use visual workflows within their daily operations. Tools like Lucidchart online flowchart maker are excellent for creating diagrams, , and explaining system architecture. They provide strong visualization features that help individuals and teams map ideas clearly.
However, organizations that require deeper collaboration, workflow execution, and cross-team coordination may benefit from a broader workspace solution. Platforms like combine communication, data management, and workflow collaboration in a unified environment, helping teams move beyond visualization and manage real work more efficiently. By understanding project needs, scalability requirements, and collaboration goals, businesses can choose the tool that best supports their long-term productivity.
Boost long-term productivity with Lark today
FAQs
Is LucidChart's flowchart maker suitable for enterprise teams?
Yes, the Lucidchart flowchart maker is widely used by enterprise teams for process mapping, system architecture diagrams, and workflow visualization. It supports real-time collaboration, allowing multiple users to edit and comment on diagrams simultaneously, which helps teams align with complex workflows and systems.
Can Lucidchart replace project management tools?
Not completely. Lucidchart can visualize project workflows, timelines, and task dependencies, but it mainly focuses on diagramming and visual documentation. Most teams still use dedicated project management tools for task tracking, scheduling, and resource management while using Lucidchart to visualize processes.
What are the limitations of LucidChart's free flowchart maker?
The free version has several restrictions. Users can create only three editable documents, and each document is limited to around 60 shapes or objects. While templates and basic features are available, advanced features and larger diagrams usually require a paid plan.
How does Lucidchart compare to Unified Workspaces?
Lucidchart focuses mainly on diagramming and visual collaboration, helping teams map workflows and system designs. Unified workspaces, on the other hand, combine communication, task management, documents, and workflow execution in one environment, allowing teams to move from planning to execution without switching tools.
What alternatives provide both diagramming and execution?
Some platforms combine visual collaboration with operational workflows. Tools such as Lark, Miro, and other collaborative workspaces provide diagramming features along with communication, task coordination, and workflow management, helping teams turn visual plans into real execution within the same platform.
Related reading