














Workflow Diagram Examples: Types, Templates, and Steps

Ryan Tanner
Product Marketing Specialist
Sep 18, 2026
Ryan Tanner
Sep 18, 2026

19 min read


Workflow diagrams make complex processes easier to understand by showing how tasks, decisions, and handoffs move from start to finish. Teams use them to enhance clarity, minimize errors, and consolidate scattered instructions into a shared visual reference. Whether the goal is to document an approval flow, speed up onboarding, or streamline software delivery, a well-designed diagram helps people visualize how work actually happens, rather than how it is assumed to occur. In this guide, we will unveil everything about workflow diagrams, and introduce Lark to you as a reliable tool to practice and support project management further. Let's dive in.

What is a workflow diagram?
A workflow diagram is a structured visual that represents the sequence of tasks, decisions, and roles within a specific process. Each shape and arrow communicates what happens next, who is responsible, and how different actions depend on one another. These diagrams can range from basic flowcharts to more complex systems used in software engineering or project management.
Teams often use workflow diagrams to align expectations, define handoffs, and avoid confusion. Unlike informal charts or lists, a workflow diagram enforces clarity and standardization, ensuring every participant understands how the process works from start to finish. They are equally useful for business operations, software development, and cross-functional collaboration.
Types of workflow diagrams
Different workflows require different levels of structure, clarity, and detail, so no single diagram format fits every situation. Some workflows need a simple linear view, while others require multiple teams, data flows, or decisions to be shown side by side. Choosing the right type of diagram affects how easy it is to communicate the process and how quickly someone can understand roles and steps. The right visual also helps teams diagnose inefficiencies and decide where automation, ownership, or rework is needed. Below are common workflow formats used across business, operations, and software teams.
1. Basic flowchart
A basic flowchart uses boxes and arrows to show the order of tasks and the decisions that guide the next step. It is most useful when the workflow has a simple beginning, middle, and end without heavy branching or multiple teams involved. Because it uses universal symbols, anyone can understand the flow without training, which makes it useful for approvals, service requests, or internal policies. Teams often start with a basic flowchart before converting it into a more advanced workflow later. This is a good option for documenting processes that need quick visibility, not complex analysis.
Example: An HR leave request flow might start with "Employee submits request," followed by "Manager reviews," and then branch to "Approved" or "Declined."
2. Swimlane diagram
A swimlane diagram separates tasks into horizontal or vertical lanes based on roles, systems, or departments, making handoffs easy to see. It is ideal for cross-team workflows where multiple people touch the same request at different stages. By separating responsibilities into lanes, teams can clearly see who acts, who waits, and where bottlenecks happen. This format is often used in HR, marketing, customer service, and legal workflows where ownership must be unambiguous. It is also helpful during onboarding, because new employees can see their part in the larger system without reading long SOPs.
Example: In a marketing workflow, one lane might represent "Content," another "Design," and another "Legal," helping each see their specific actions and timing.
3. Process flow diagram
Process flow diagrams are common in industries like manufacturing, engineering, and logistics because they show how resources, materials, or energy move through a system. Instead of people and tasks, this format highlights physical flow, capacity, equipment, and checkpoints. It helps teams analyze efficiency, track waste, and optimize sequencing based on machine timing or supply chain limits. Because the focus is on operations rather than stakeholders, it is especially useful for production lines and industrial workflows where action happens across stages, not teams. This type of diagram often leads to automation or cost-reduction improvements.
Example: A bottling process diagram might track the flow of materials from "Fill" to "Seal" to "Label," enabling engineers to optimize resource use and machine timing.
4. Data flow diagram
A data flow diagram (DFD) maps how information moves through a system, showing where data is collected, processed, stored, and passed between elements. It is most common in software development, IT infrastructure, and system architecture planning. Instead of actions or tasks, it focuses on data inputs, security points, and logic flow. This helps engineers and analysts validate requirements and detect gaps or access risks early in development. A DFD also helps stakeholders understand what happens to user information without reading technical specifications.
Example: A DFD for a customer portal could show how "User login data" flows from the browser to the authentication server and back with access permissions.
5. Workflow diagram for software development
This workflow maps core development stages such as planning, coding, testing, deployment, and monitoring. It helps teams understand dependencies and avoid delays caused by unclear ownership between engineering, QA, and DevOps. Because software work is iterative, the diagram often loops rather than runs in a straight line. It is especially useful in agile teams where multiple releases go through the same repeatable cycle. A well-documented workflow also reduces onboarding time for new developers and avoids miscommunication across sprint teams.
Example: When developers push code from "Test" to "Production," the workflow automatically triggers deployment scripts and quality checks for smoother releases.
How to create a workflow diagram
Creating an effective workflow diagram requires structure, clarity, and collaboration. Follow these steps to make your process map both accurate and actionable.
Step 1: Identify the process you want to map
Start by defining a clear scope. Choose one complete workflow that has a measurable start and end. This could be a hiring process, marketing campaign, or IT support request. A narrow scope avoids clutter and keeps the diagram readable.
Step 2: List all tasks, roles, and decision points
Gather everyone involved in the process to ensure you capture each step. List what happens, who does it, and what decisions are required. Use sticky notes or digital boards to visualize the flow before drawing it formally.
Step 3: Choose a workflow diagram type that fits your process
Select the diagram format that best represents your work. For example, use a swimlane diagram for cross-functional tasks or a data flow diagram for software systems. The right structure improves comprehension for everyone reviewing it.
Step 4: Arrange steps visually
Place actions, decisions, and outputs in the correct sequence. Arrows should clearly show direction. Use consistent shapes for each type of step to reduce confusion. Keep spacing generous so the chart feels balanced and readable.
Step 5: Review with stakeholders to confirm accuracy
Present your draft to key participants to validate correctness. Their input helps you refine steps and eliminate missing details. This review also builds ownership, so everyone follows the finalized version confidently.
Step 6: Use collaborative tools like Lark to digitize and automate steps
After finalizing the flow, move it into a shared digital workspace. Collaborative tools let you attach owners, automate transitions, and trigger updates automatically when conditions are met. Over time, your diagram becomes a living workflow that drives daily operations.
Design smarter workflows with Lark's connected workspace
Many workflow diagrams stay as static files that look useful but never influence the actual work being done. The real advantage appears when a diagram can be tied to ownership, status updates, and data that moves as the process runs. Lark brings the visual flow, the tasks, the documentation, and the automation into one shared workspace, so teams don't just view a process but operate it in real time. Instead of updating diagrams manually or chasing feedback across tools, every change is reflected where work happens. This helps teams cut handoff delays, reduce status meetings, and keep every step traceable without extra admin effort. Over time, the workflow becomes the system, not just a reference.
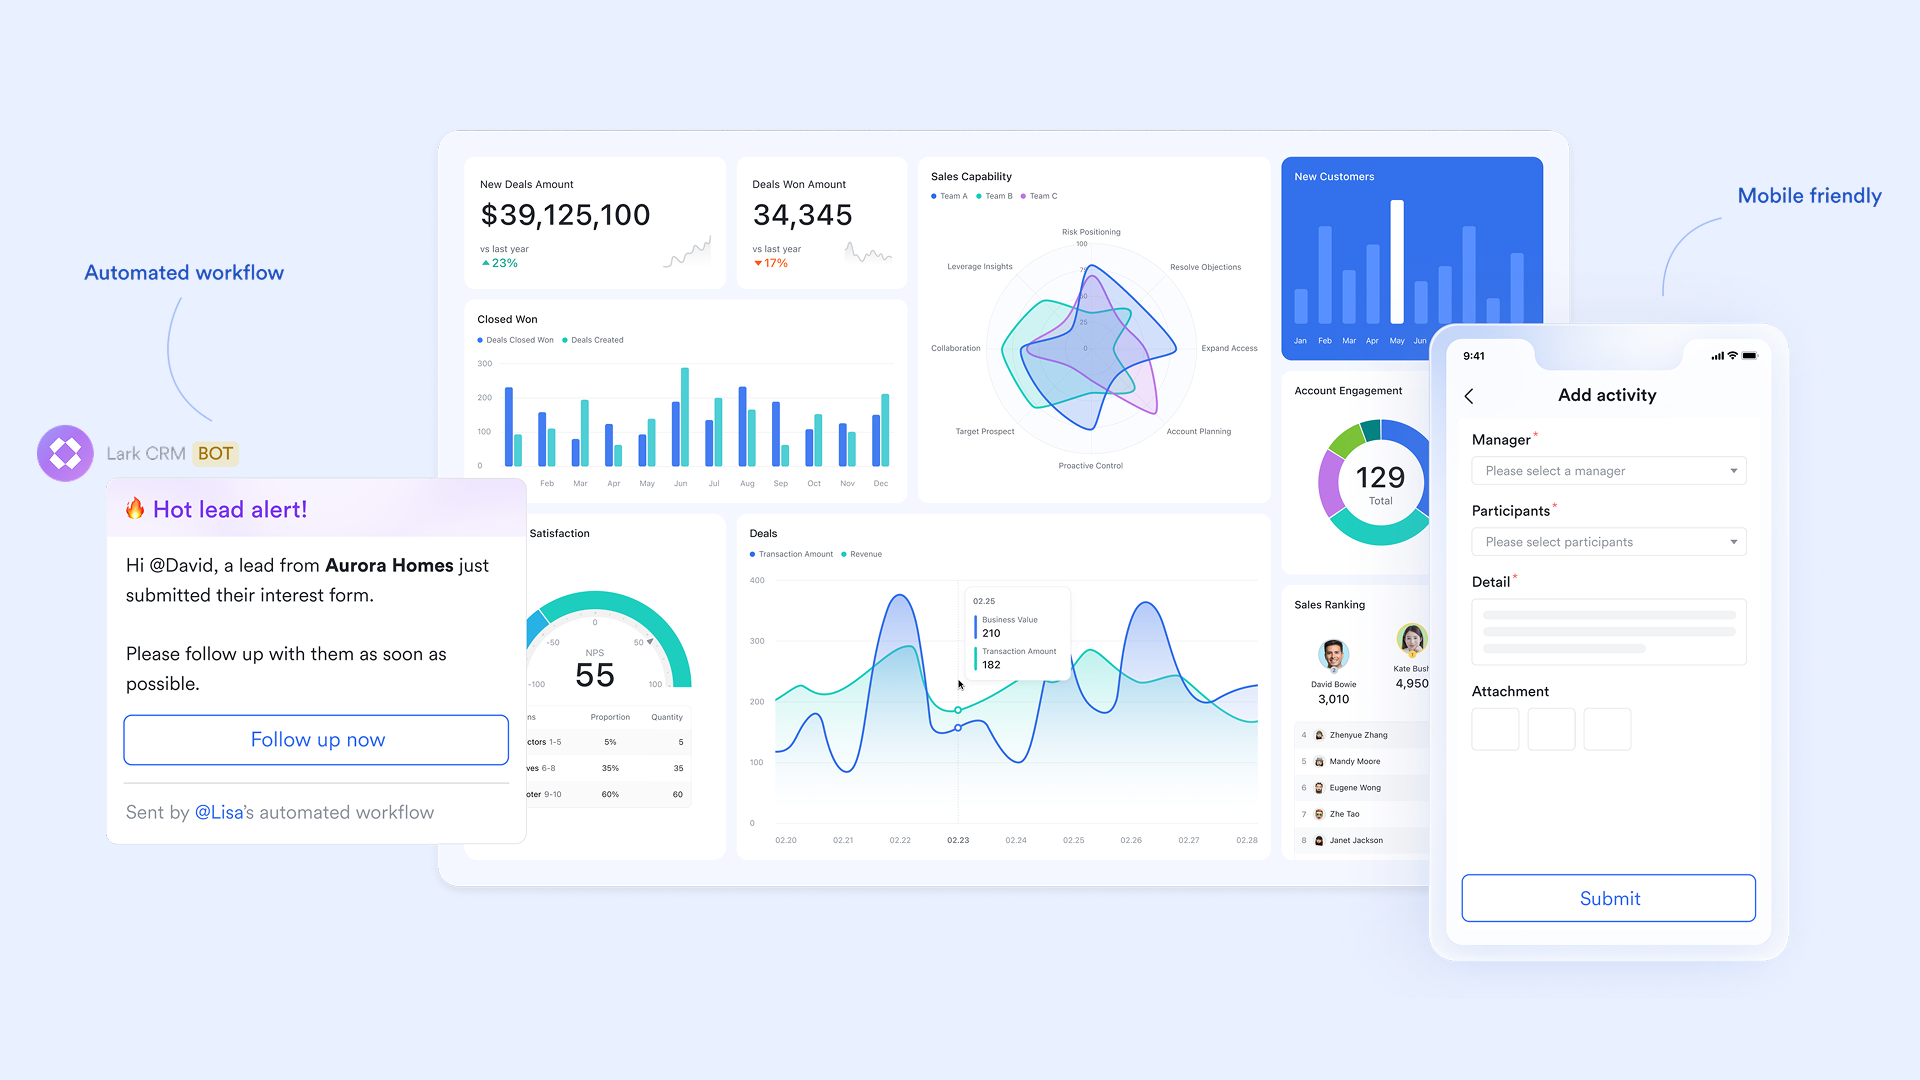
Lark Base: Build dynamic workflow dashboards that connect tasks, owners, and timelines
Lark Base transforms workflow diagrams into structured, actionable records with clear fields, statuses, owners, and timelines. Each step can be visualized as a node, renamed, or rearranged to fit complex logic and conditional flows. You can view progress through Kanban, Table, or Timeline layouts to track movement, monitor timelines, or review historical data. Automated approval and AI-powered actions keep processes moving—sending alerts, posting updates, or calculating key dates to highlight potential delays. This turns your workflow from a static plan into a dynamic, self-updating system.
Example: Track a content request process from "Idea" to "Publish." When a card moves to "Approved," Base schedules a publish date and alerts the team.
Lark Docs: Draft and share workflow documentation for approvals or SOPs
Lark Docs stores the instructions, checklists, rules, and context behind every step in your workflow. Instead of having diagrams in one place and procedures in another, Docs lets you embed Base views, tables, screenshots, and supporting material in one living file. Comments help teams review changes without meetings, and version history keeps a record of every policy update. This makes SOPs easier to maintain and ensures no one guesses what a workflow step actually means. Docs has become the single source of truth for both policy writing and collaboration.
Example: HR teams attach onboarding flowcharts directly within Docs so new hires can follow steps without switching apps.

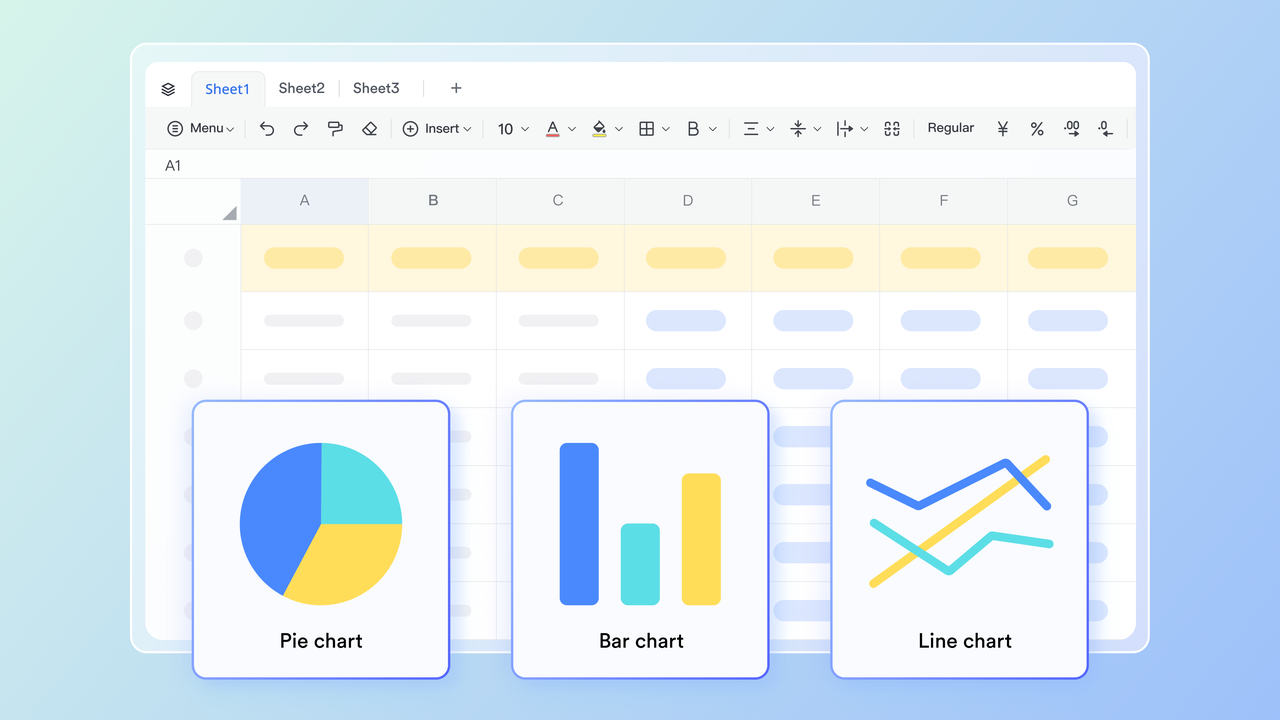
Lark Sheets: Visualize process progress using Gantt-style workflow charts
Lark Sheets lets you turn workflow data into charts, metrics, and real-time performance views without exporting anything. You can track stage duration, cycle time, or on-time completion using data synced directly from Base. Conditional formulas flag delays or high workloads, making bottlenecks visible as soon as they form. Teams can pivot by owner, department, or workflow stage to see where tasks are accumulating. Because Sheets connects to live records, charts update automatically whenever the workflow changes.
Example: Map campaign stages on a Gantt chart to spot tasks at risk and monitor throughput across departments.
Lark Tasks: Turn workflow steps into assigned, trackable actions
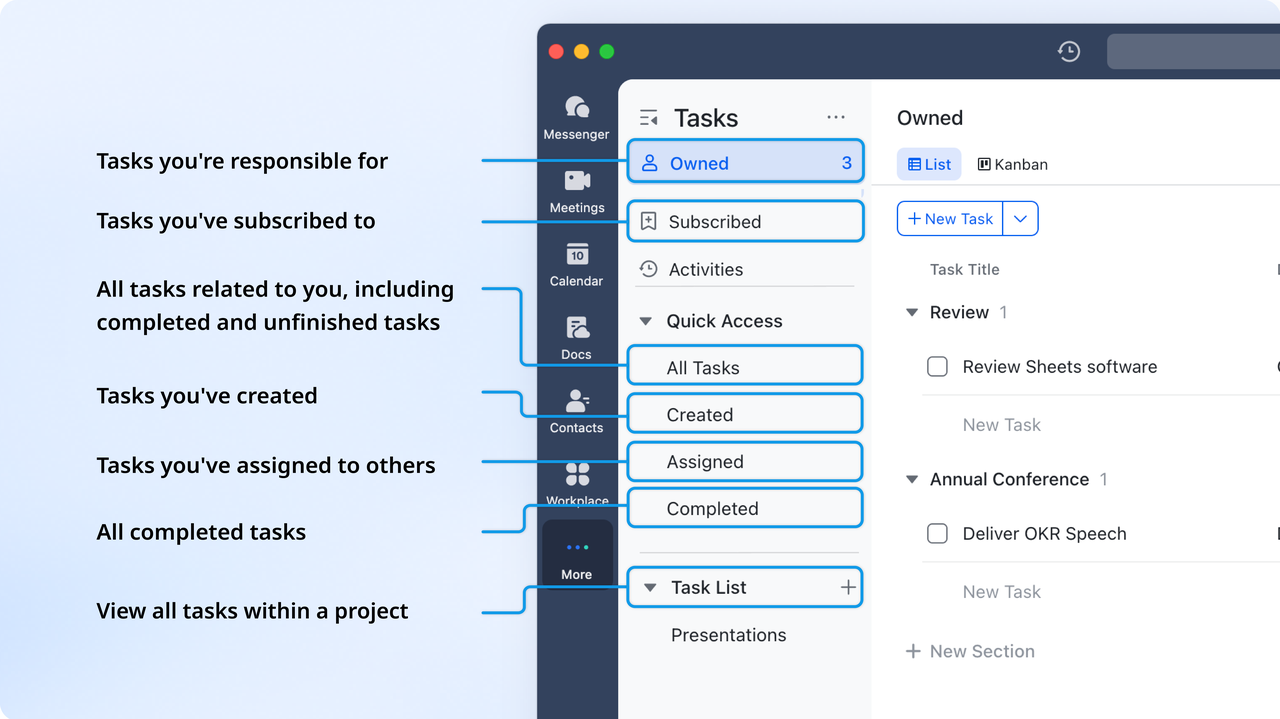
Lark Tasks turns workflow steps into actionable tasks with assigned owners, due dates, checklists, and linked documents. Tasks created from Base workflows stay connected to their source records and related Docs, so context is always visible. Real-time sync ensures updates flow both ways—when tasks are updated, Base reflects the changes instantly. Teams can also include task links in workflow messages, making it easy for owners to access and act without needing document permissions. With smart reminders, recurring steps, and clear board or list views, Lark Tasks keeps every workflow organized and moving forward.
Example: When a step enters "Legal review," a pre-set task bundle appears for the Legal team, with automatic deadlines and links to relevant documents.
Lark Messenger: Share workflow updates and real-time changes instantly with the team
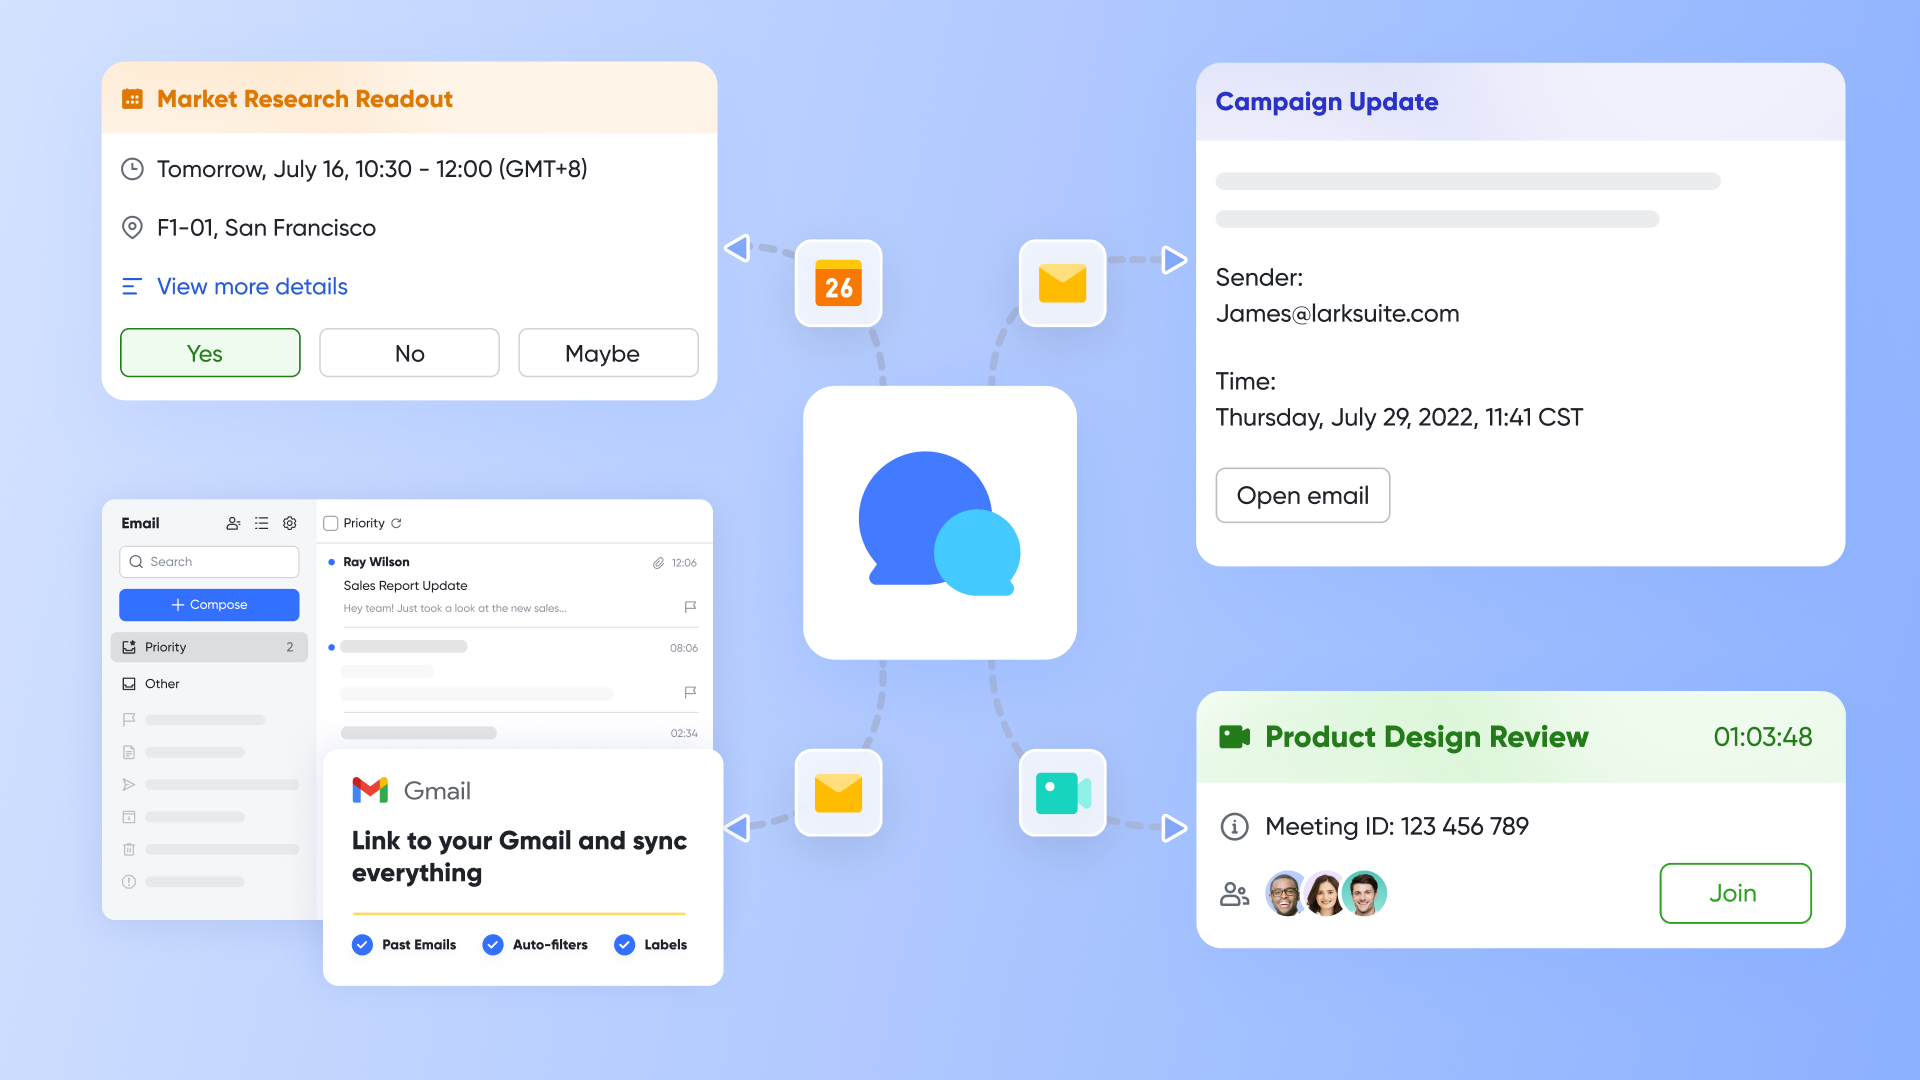
Lark Messenger brings workflow activity into the conversations where people are already working. Teams can send Base cards or Sheets visuals into a thread to discuss a step with full context. Channel-based workflows keep updates organized so project, HR, or ops teams see only what applies to them. Automatic alerts from Base and Tasks notify the right people when a status changes, eliminating the need for status meetings. This keeps handoffs fast and visible without extra coordination work.
Example: When a task moves from "Build" to "QA," the update posts to the project channel, tagging the responsible tester so work continues immediately.
- Starter plan: Free forever plan that includes 11 powerful tools for up to 20 users. It also comes with 100GB of storage, 1000 automation runs, AI translations, and more.
- Pro plan: $12/user/month (billed annually) for up to 500 users. It includes everything in Starter plus group calling for up to 500 attendees, 15TB of storage, 50,000 automation runs, and more.
- Enterprise plan: Contact sales for custom pricing. Supports unlimited users and includes even more automation runs and advanced security, compliance, and management features.
Action times: Try out Lark flowchart templates
Workflow diagrams become far more valuable when they do more than just sit inside a document. Instead of staying as static visuals, they can turn into live, trackable workflows that assign ownership, trigger next steps, and update teams automatically. Lark's ready-to-use templates help teams skip the drawing phase and start working with real, editable flowcharts built for common business processes. Each template can be customized, shared, and connected with tasks, data, and approvals, so the diagram isn't just viewed, it's actively used. These templates work for teams that want a fast way to move from planning to execution without rebuilding workflows from scratch.
Project approval flowchart template
This template is designed for teams that handle recurring project requests and need a consistent review and decision process. It lays out every step from idea submission through review, approval, revision, and execution, making it easy to define who decides what and when. By mapping the full journey, teams avoid unclear ownership, skipped steps, or bottlenecks caused by waiting for responses. Inside Lark, this flow can automatically assign owners, set due dates, and notify reviewers when a decision is required, so approvals don't stall in inboxes.
Generic flowchart template
The generic flowchart template is flexible enough for any process, whether operational, administrative, or creative. It gives you a clean starting point with universal diagram elements like actions, decisions, and outcomes, so teams can quickly map out a workflow without worrying about layout. It works well for brainstorming sessions, SOP drafting, or transforming a messy email thread into a structured process. When used in Lark, the same diagram can link to Lark Tasks, Lark docs, and real-time status updates, turning a simple visual into a live workflow that evolves as teams refine it.
Process flow chart template
This template helps teams break down recurring processes into defined steps with clear sequencing and checkpoints. It is ideal for operations, finance, procurement, or HR teams that rely on repeatable actions. Each node shows what must happen before the next task begins, reducing rework and uncertainty. When moved into Lark, teams can attach owners, add conditional rules, and automate step-to-step transitions so the process isn't just mapped but actively tracked. Over time, this makes it easier to spot delays, redundancies, or automation opportunities.
Manufacturing process flowchart template
Designed specifically for production workflows, this template shows how materials, checks, and outputs move through each manufacturing stage. It helps teams align machines, operators, quality gates, and handoffs with full visibility. Instead of relying on memory or outdated files, the diagram becomes a shared reference point. When paired with Lark's dashboards and real-time updates, production teams can monitor cycle times, detect bottlenecks, and log issues without switching tools. This leads to faster adjustments and more consistent throughput.
E-commerce order processing flowchart
This template maps the full order lifecycle from purchase to warehouse pick, pack, shipping, delivery, and returns. It is built for e-commerce teams that rely on coordination across logistics, support, warehouse, and payments. Every step makes customer impact visible, so delays or missing updates can be resolved faster. In Lark, this workflow can trigger alerts when orders fall behind SLA, create tasks for exceptions like payment failures, or update channels automatically when an item is shipped. The result is a smoother customer experience without manual tracking.
System architecture diagram
This template helps you map out your software system's structure from authentication plugs and reverse proxies to infrastructure layers like MySQL, Redis, and MQ. It provides a clear, organized visual framework so teams can see components and how they interact. Ideal for software developers, system architects, and IT managers, it supports collaboration and alignment across stakeholders.
Tech support workflow diagram
This template lays out every step of your support process from ticket submission to resolution, so you can highlight bottlenecks and improve response times. It's designed for tech support teams, IT departments, and customer service groups who need a clear, visual workflow for issue handling. Using it helps you standardize escalation paths, assign responsibility, and boost efficiency.
Network topology diagram
This template captures your entire network setup cloud, access networks, routers, switches, firewalls, and servers all in one diagram. It's tailored for network engineers, IT professionals, and consultants who need to design or communicate infrastructure clearly. With this, you can visualize device placement, data flows, and architecture, so your team and stakeholders stay aligned.
Avoid these workflow diagram pitfalls
Even well-designed diagrams can fail if teams overlook core principles. A workflow only succeeds when it stays clear, current, and aligned with how people actually work. Many teams build diagrams once and never revisit them, which leads to confusion and outdated steps over time. Keeping these common pitfalls in mind helps ensure the diagram continues to support real operations instead of becoming a forgotten file. Treat the workflow as an evolving system that improves with feedback, not a one-time visual document.
- Overloading diagrams with unnecessary detail
Too much information turns a helpful diagram into a cluttered one that no one wants to read. When every minor step, note, or exception is included, the main process flow becomes hard to follow. Keep the diagram focused on the decisions and actions that move the process forward, and store extra references in linked docs or comments instead. Teams can always add more layers later once the core logic is clear. A readable diagram encourages adoption, while a dense one gets ignored.
- Not updating workflows when processes change
A workflow only works if it reflects how the process operates today, not how it worked months ago. When people keep following an outdated version, mistakes increase and accountability becomes harder to track. Build review checkpoints into your operating rhythm, so the diagram is refreshed when roles, tools, or approvals change. Modern teams often tie workflows to shared docs or dashboards, so updates happen in one place instead of scattered files. Treat the workflow as a living asset, not a static artifact.
- Ignoring feedback from the people executing the workflow
The people running the workflow every day often spot gaps, delays, or redundant steps long before managers notice. If the diagram is created in isolation, it may look good on paper but fail in practice. Invite feedback as part of onboarding, retrospectives, or process reviews so improvements surface naturally. When teams see their input reflected in the diagram, adoption increases because the process feels real, not imposed. A workflow improves fastest when the users helping shape it are the ones who depend on it.
- Building diagrams in isolation without cross-team input
Most workflows cross more than one department, system, or function, so a single team should never own the design alone. Creating a diagram without involving others leads to assumptions, missing steps, and extra rework later. Instead of mapping only what one team sees, gather inputs from everyone who hands off or receives work along the chain. Shared ownership helps teams understand dependencies and prevents changes from breaking someone else's workflow. Collaborative during the design phase saves far more time than fixing misalignment after launch.
Why workflow diagrams matter
A well-made workflow diagram turns routine work into an organized sequence that everyone can follow. It reduces miscommunication and helps improve overall accountability.
- Help teams standardize processes and improve accountability
Standardized diagrams ensure every team follows the same sequence for recurring work. By mapping each step visually, people see their part in the bigger picture, which improves responsibility and consistency. When new team members join, they can understand a process instantly without extended training. Over time, visual consistency supports governance and makes audits or compliance checks much easier to handle.
- Simplify onboarding and communication across departments
When multiple teams are involved in a process, misunderstandings can slow progress. A workflow diagram becomes a shared language that clarifies expectations between teams. Instead of relying on long documents or separate notes, everyone can refer to one map that shows who acts next and what decisions trigger which outcomes. This keeps conversations productive and decisions data-driven.
- Identify redundancies and areas for automation
Once your process is mapped, inefficiencies stand out. Repeated tasks or unnecessary approvals become visible in seconds. Teams can then explore automation or role consolidation to save time. For example, repetitive manual checks in a finance workflow can be automated when clearly spotted in a diagram. Over time, this approach cuts operational costs and boosts agility.
Conclusion
Workflow diagrams give teams a clear way to understand how work moves, where decisions are made, and who is responsible at each stage. When processes are visualized, problems become easier to spot, improvements can be made faster, and teams no longer rely on guesswork or scattered instructions. The real benefit appears when these diagrams aren't just documented, but actively used to guide daily operations, onboard new teammates, and support consistency across departments.
More teams are now shifting from static charts to living workflows that track progress, assign ownership, and send real-time updates. This shift becomes much easier when the diagram, the data, and the work itself exist in the same platform. For teams exploring that step, Lark offers tools that connect documentation, tasks, automation, and communication, so workflows stay visible and usable, not forgotten in a file.
FAQs
What's the difference between a workflow diagram and a flowchart?
A workflow diagram covers the entire sequence of work, including roles, data, and decisions, while a flowchart focuses mainly on step-by-step logic. Workflow diagrams often add layers like responsibility or system interactions. In modern tools, these can connect directly to live tasks or dashboards for real-time updates, similar to how Lark's Base links steps to automated actions.
Can workflow diagrams be used for automation?
Yes. Once mapped clearly, workflows can trigger automated actions such as task assignments or notifications. Platforms that connect diagram logic with execution tools make this seamless. Teams can use visual triggers to automate transitions, reducing manual tracking while keeping all stakeholders informed instantly.
How often should workflows be reviewed or updated?
Review your workflows every quarter or whenever major process changes occur. Regular updates keep instructions accurate and prevent misalignment. Modern collaborative platforms simplify this with shared access and version history, so everyone always works from the latest flow.
What software is best for creating workflow diagrams?
Good workflow software should offer visualization, collaboration, and automation together. Many teams prefer tools that combine diagramming, task management, and real-time communication. Solutions like Lark bring these together in one place, allowing diagrams to evolve naturally into functioning workflows without exporting data between systems.
Related reading
Table of contents
Start using Lark today

Manage all your work in one place
Boost team efficiency by 10x
Save up to 70% on software costs
Table of contents
Start using Lark today
Manage all your work in one place
Boost team efficiency by 10x
Save up to 70% on software costs
Keep reading







2026 Lark Technologies Pte. Ltd.
Headquartered in Singapore with offices worldwide.






Explore: