We are currently living through a paradox of information: marketers have never had access to more data, yet turning that data into revenue has never felt more challenging. The "data overload" phenomenon is real. We are drowning in spreadsheets, dashboard screenshots, and disparate metrics, often struggling to answer the simple question: "What is actually working?" Marketing has evolved far beyond simple ad buying; it is now a complex, multi-channel ecosystem requiring immediate attention and agility. To keep up, we need technology that does more than just report history—it needs to facilitate immediate action. Whether you are using specialized platforms or an all-in-one collaboration hub like Lark, the right software bridges the gap between insight and execution. This guide will review the best marketing analytics tools currently available, focusing on how they solve specific business problems and help you build a more responsive, data-driven organization.
Key takeaways: Top 3 picks to save your time
To help you build the perfect stack, we have handpicked the top 3 most recommended marketing analytics tools currently shaping the industry for their exceptional performance.
1. Lark: The all-in-one hub for action and insight
2. Google Analytics 4 (GA4): The industry standard for web traffic analysis
3. HubSpot Marketing Hub: Connecting inbound marketing directly to revenue data
Go ahead to the best tool to save your time
What are marketing analytics tools?
At their core, marketing analytics tools are software platforms designed to track, aggregate, and analyze the performance data of your marketing initiatives. However, defining them simply as "trackers" does a disservice to their modern capabilities. These platforms serve as the central nervous system of a growth strategy, allowing businesses to understand customer behavior, evaluate the of various channels, and optimize future campaigns based on hard evidence rather than gut feeling.
The scope of marketing analytics software is vast and often misunderstood. It covers a wide spectrum of functionality, ranging from foundational web marketing analytics tools like Google Analytics 4, which track user behavior on a site, to holistic operational platforms like Lark that integrate data visualization directly into . The evolution of this technology has been rapid. In the early days of digital marketing, we relied on simple hit counters and basic server logs. Today, the analytics tools rely on have transformed into sophisticated engines powered by artificial intelligence and machine learning. We have moved from descriptive analytics to predictive analytics.
Despite this technological leap, the biggest challenge remains fragmentation. Data often lives in silos—social metrics in one app, in another, and ad spend in a third. Effective online marketing analytics tools aim to solve this by providing a "single source of truth." By consolidating these fragmented data points, marketing leaders can gain a unified view of their performance, ensuring that every team member—from the creative copywriter to the data scientist—is looking at the same reality.
Key features to look for in a marketing analytics tool
With thousands of SaaS options on the market, selecting the right software can feel overwhelming. However, whether you are a startup or a global enterprise, the criteria for selection should remain consistent. You need a platform that not only gathers data but also empowers your team to use it. When building your marketing analytics toolkit, prioritize the following essential features.
Data integration capabilities
The most critical feature of any modern analytics platform is its ability to play well with others. Your marketing ecosystem likely includes Facebook Ads, LinkedIn, Google Search Console, a CRM like , and an email provider. If your analytics tool cannot pull data from these disparate sources into a single view, you will be stuck manually exporting CSV files forever. You should look for tools used in marketing analytics that offer robust APIs or native integrations, like AnyCross in Lark, to automate data ingestion. The goal is to eliminate data silos so that cross-channel performance can be analyzed side-by-side without manual intervention.
Actionability and workflow integration
This is often the missing link in traditional analytics. Does the tool just show you a chart, or does it help you fix the problem? A dashboard that shows a drop in conversion rate is useful, but a system that alerts the right team member and creates a task to fix it is transformational. This is where the distinction between passive reporting and active management becomes clear. Marketing analytics software tools should ideally sit close to where the work happens. For instance, platforms that integrate data directly into team chat or project boards allow for a "chat-to-action" workflow, converting insights immediately into assigned tasks.
In the fast-paced world of digital marketing, yesterday's data is often too old to be useful. If a campaign is bleeding budget due to a broken link or a poor targeting setting, you need to know immediately, not at the end of the month. The data analytics tools for marketing that provide the most value are those offering real-time or near-real-time reporting. This allows teams to pivot strategies on the fly, capitalizing on viral moments or pausing underperforming ads before they consume the quarterly budget.
Privacy and compliance
We are entering a strict post-cookie era defined by regulations like GDPR in Europe and CCPA in California. The "wild west" of tracking is over. As third-party cookies crumble, your choice of analytics software for marketing must prioritize privacy compliance and first-party data ownership. You need tools that allow you to respect user consent preferences and anonymize data where necessary. Relying on non-compliant tools is not just a technical risk; it is a significant legal and reputational liability for your brand.
Customizable data visualization
Data is useless if only the data scientist can understand it. To democratize data across your organization, marketing must offer intuitive, customizable visualization options. You should be able to build dashboards that are relevant to different stakeholders—high-level ROI overviews for the C-suite, and granular engagement metrics for the social media manager. The ability to visualize complex datasets through simple charts, heatmaps, and funnel diagrams is what transforms raw numbers into a compelling narrative that drives strategy.
Advanced attribution modeling
Finally, sophisticated teams need marketing analytics tools and techniques that go beyond "last-click" attribution. The customer journey is rarely linear; a user might see a social post, read a blog, click a retargeting ad, and then finally convert via direct search. High-quality tools offer multi-touch attribution models (linear, time-decay, or data-driven) to assign credit accurately to every touchpoint in the funnel. This ensures that brand-building channels are valued correctly, even if they don't directly drive the final click.
Experience all these features in a robust tool
Top 10 marketing analytics tools for data-driven teams
Navigating the landscape of software can be daunting. To help you build the perfect stack, we have curated a list of the best marketing analytics tools currently shaping the industry. This list covers the spectrum from all-in-one collaboration hubs to specialized data visualization engines.
1. Lark: The all-in-one hub for action and insight
Overview
While most platforms focus solely on displaying data, redefines the category by positioning itself as the operating system for action. It is not just a collaboration tool; it is a comprehensive "Superapp" that unifies data, project management, and team communication in one interface. For marketing teams, Lark serves as the central command center where insights from various channels are not only visualized but also immediately acted upon. It eliminates the friction of switching between a dashboard, an email client, and a task manager.
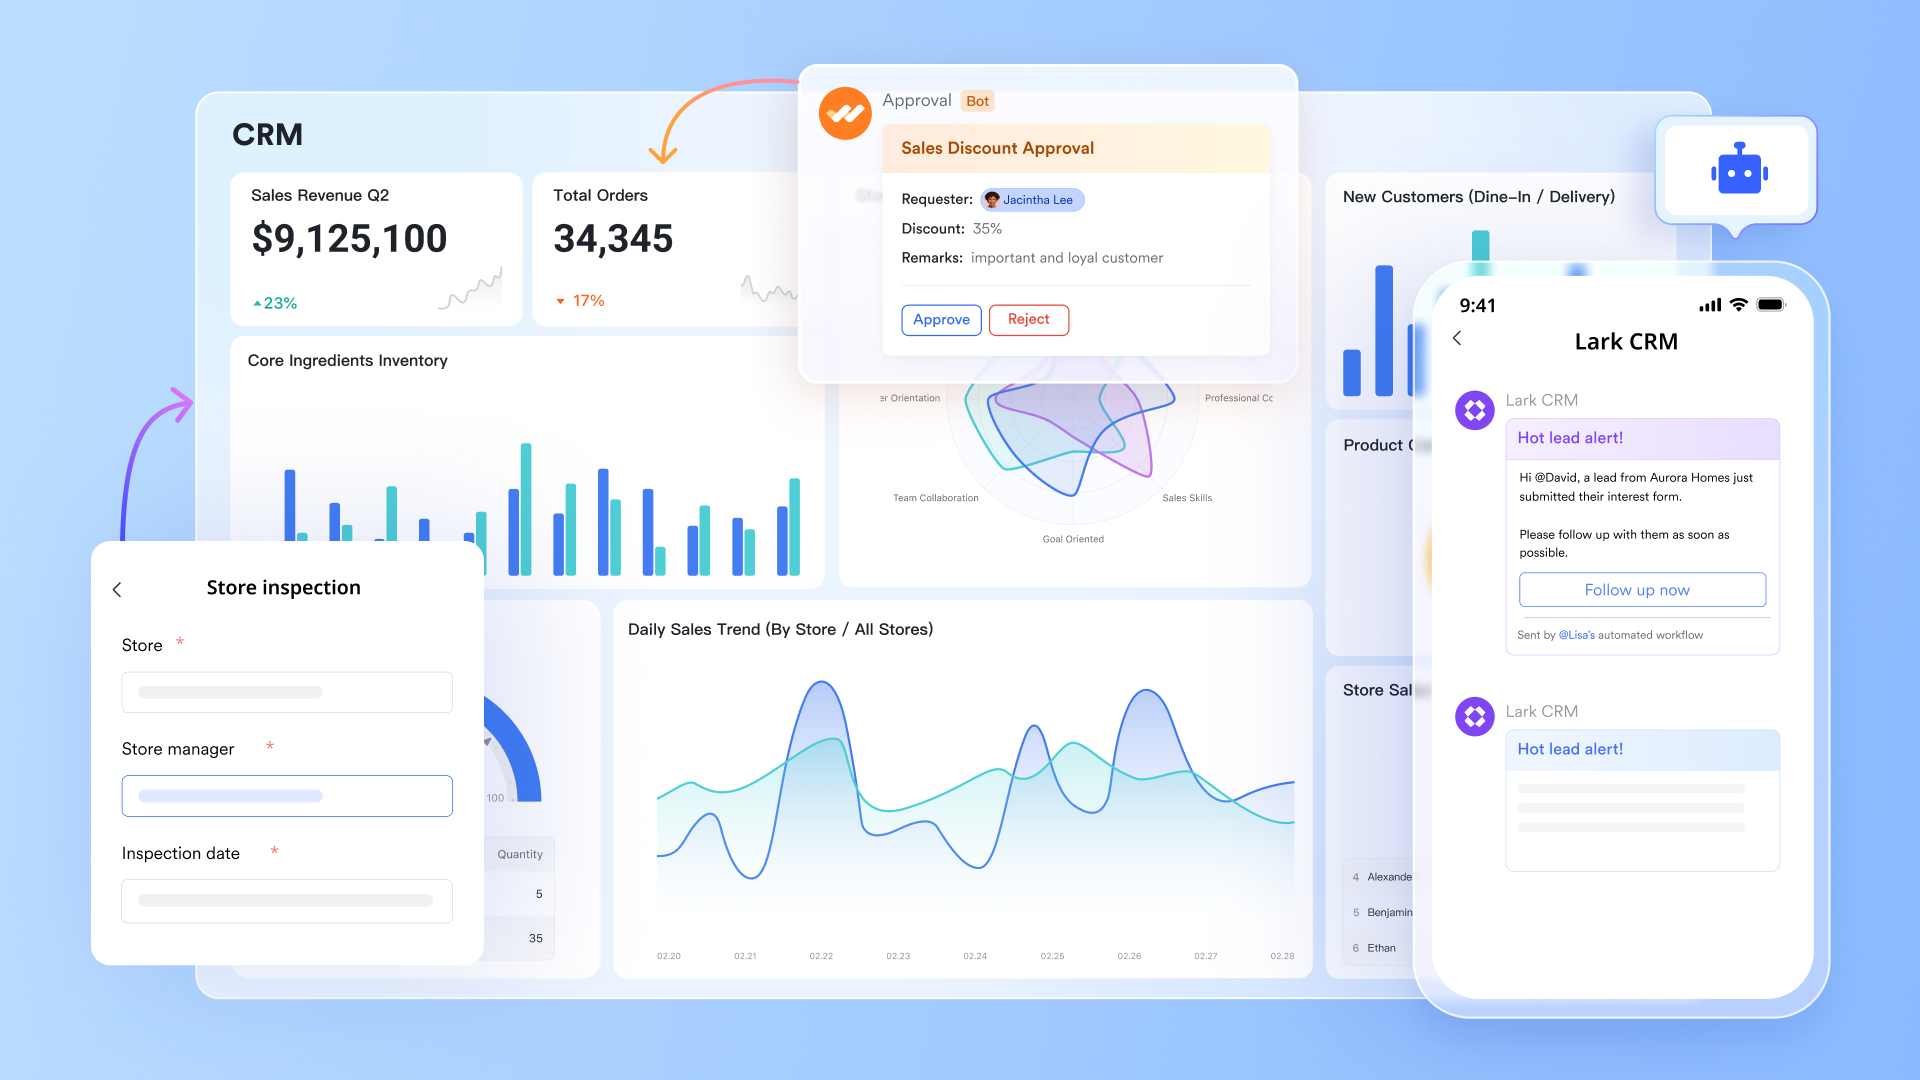
Key features
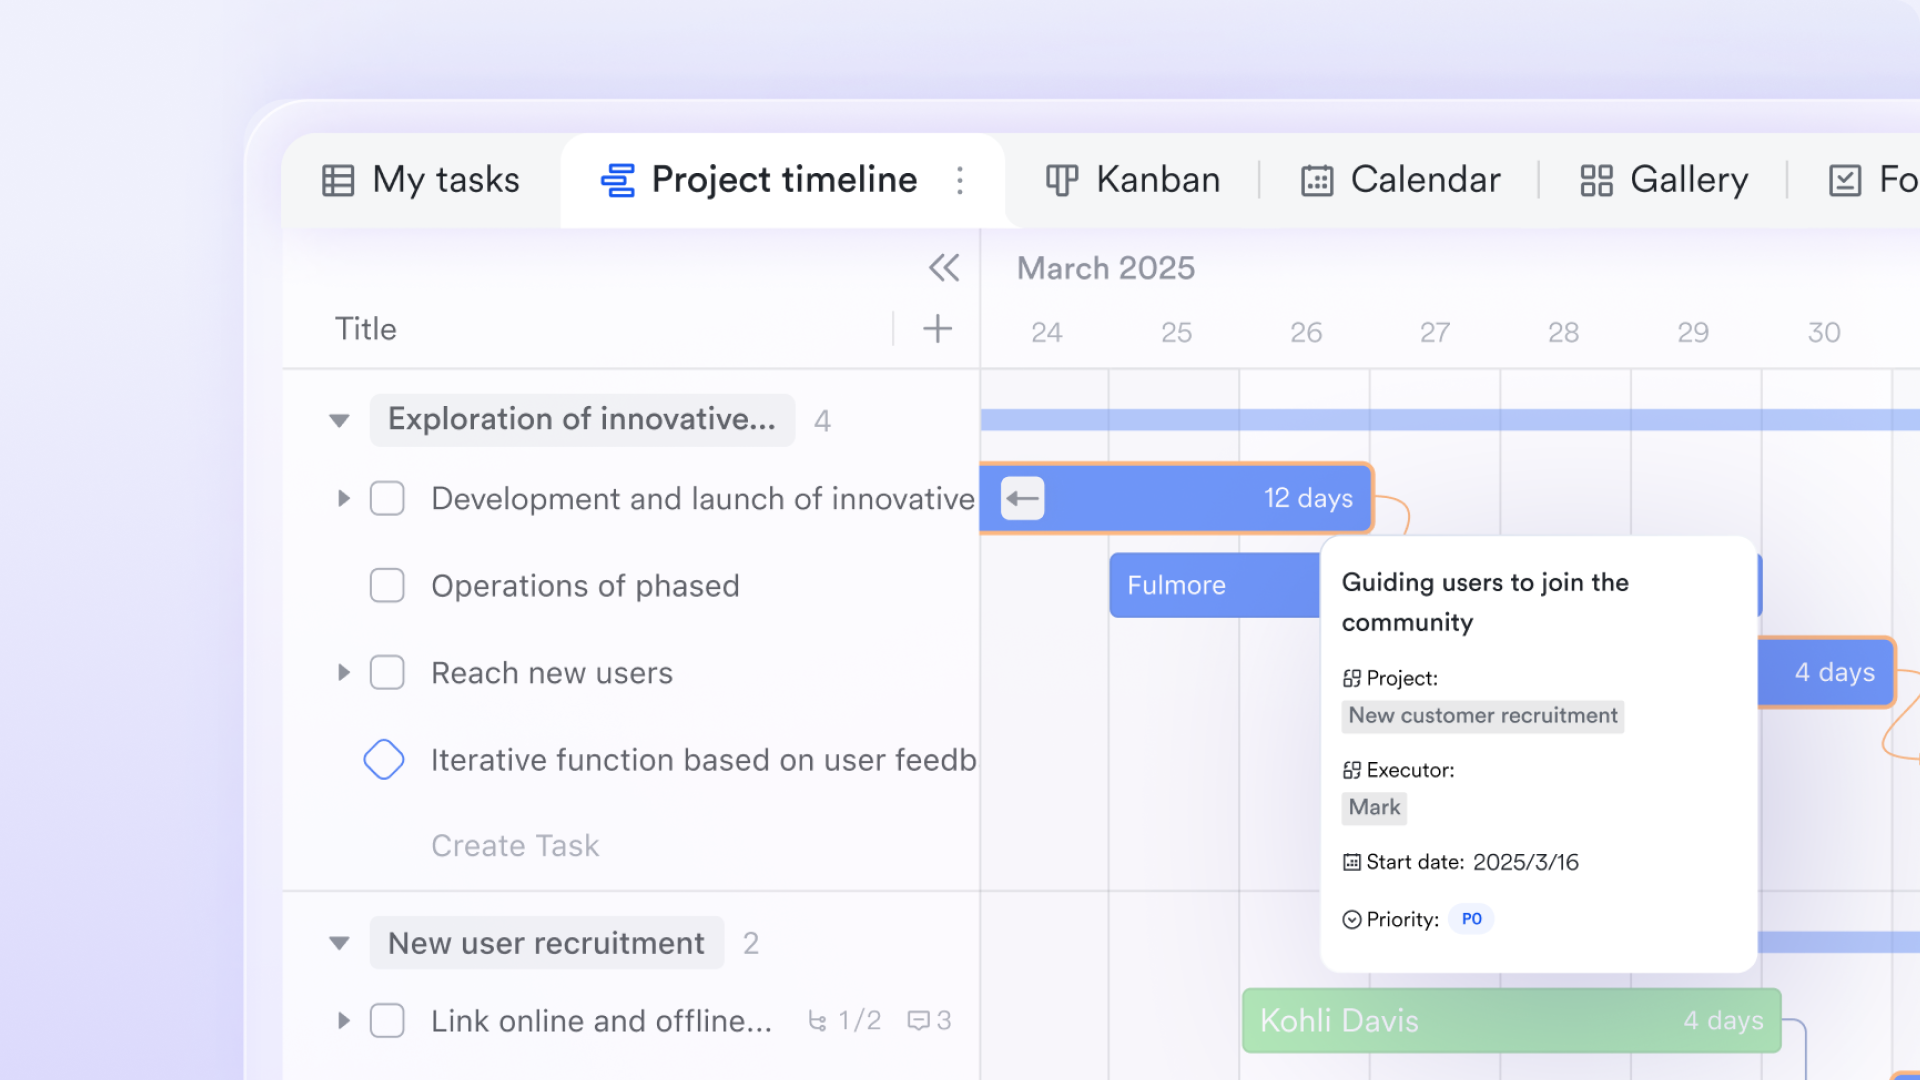
Multi-dimensional data views: empowers marketers to visualize campaign data exactly how they need it, moving far beyond static spreadsheets. Teams can instantly toggle between multiple views to gain different perspectives on the same dataset: Use the Grid view for precise data entry and detailed metric tracking, switch to to monitor the workflow status of campaign assets, utilize Gantt charts to align marketing schedules with launch dates, or employ the Gallery view to review ad creatives alongside their performance stats. This flexibility ensures that data is accessible and understandable for every stakeholder, from creative directors to data analysts.
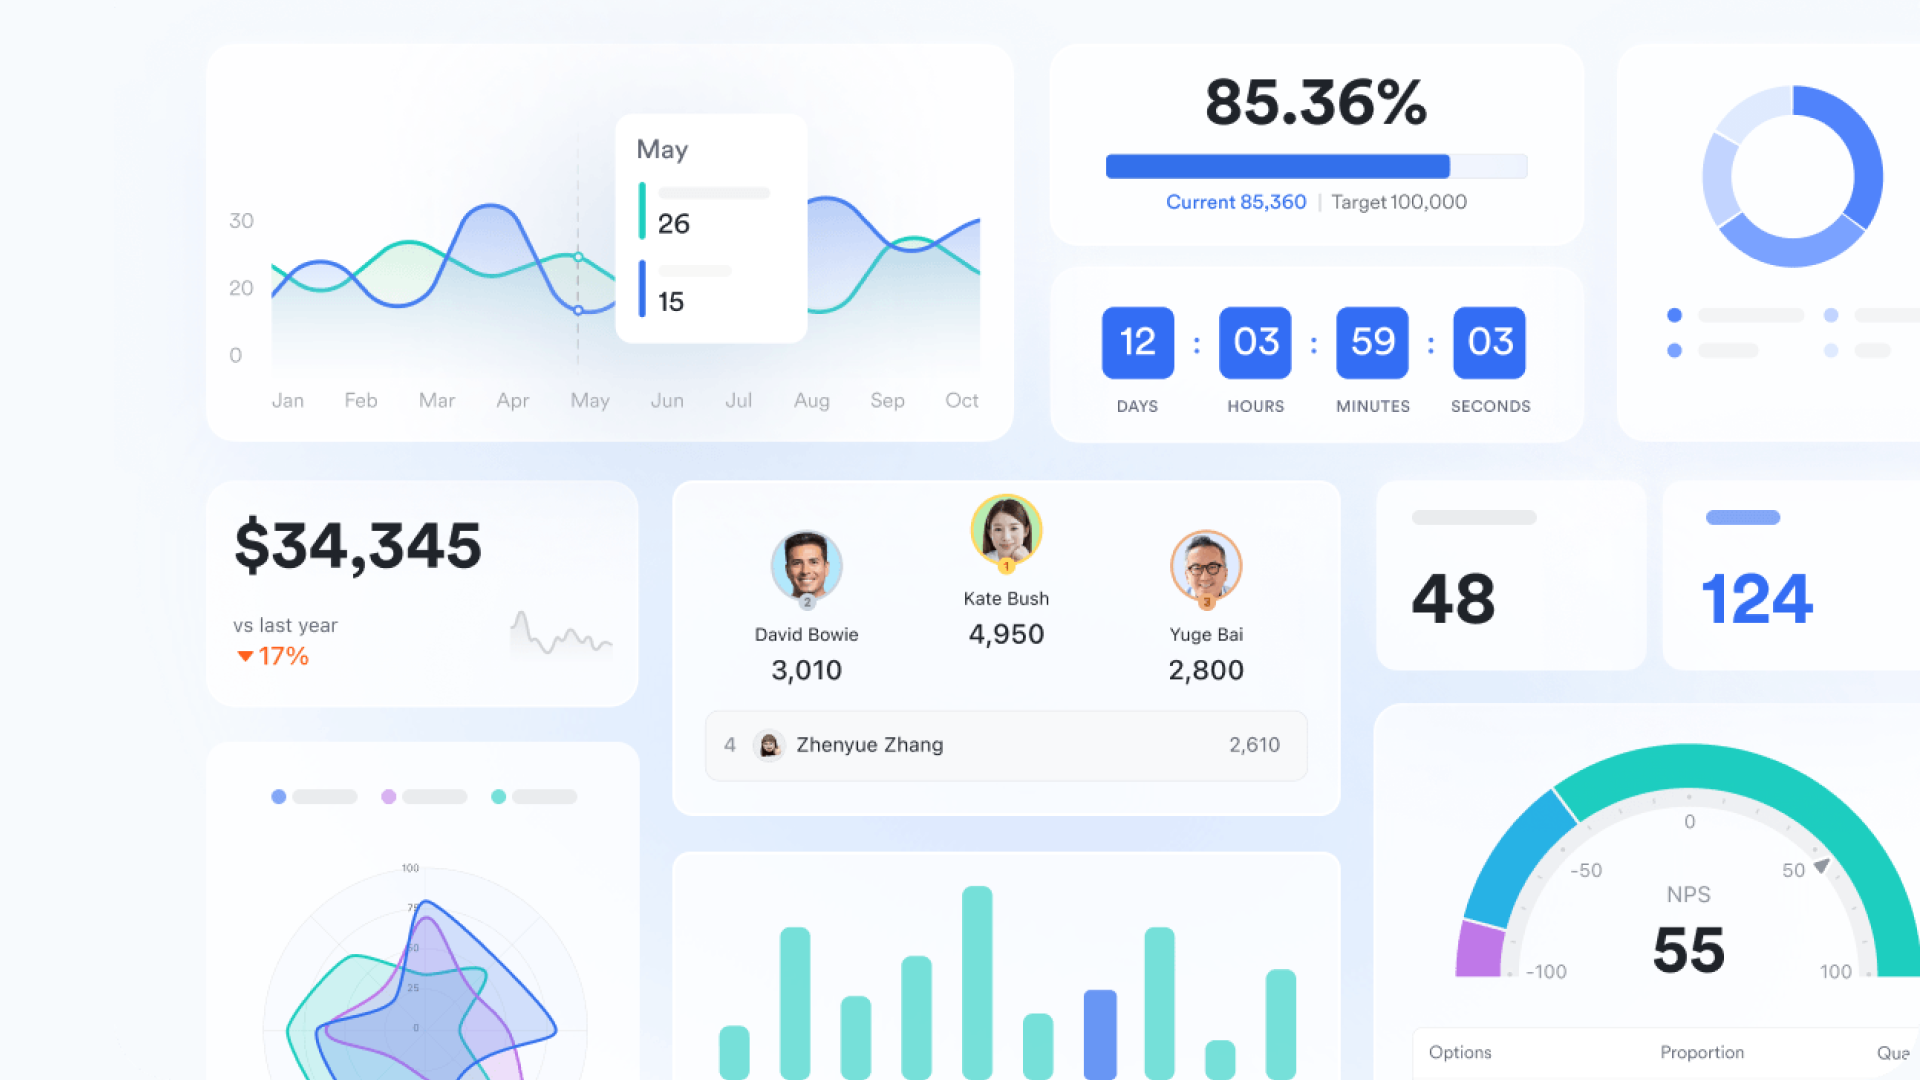
No-code performance dashboards: The platform democratizes data analysis by allowing non-technical users to build professional-grade dashboards within minutes. Marketers can aggregate data to track , such as lead conversion rates, channel ROI, and budget utilization, directly within Lark Base. These dashboards are not static; they are dynamic and interactive, enabling teams to drill down into specific data points to identify trends without needing to write SQL queries or export CSVs to external visualization software.
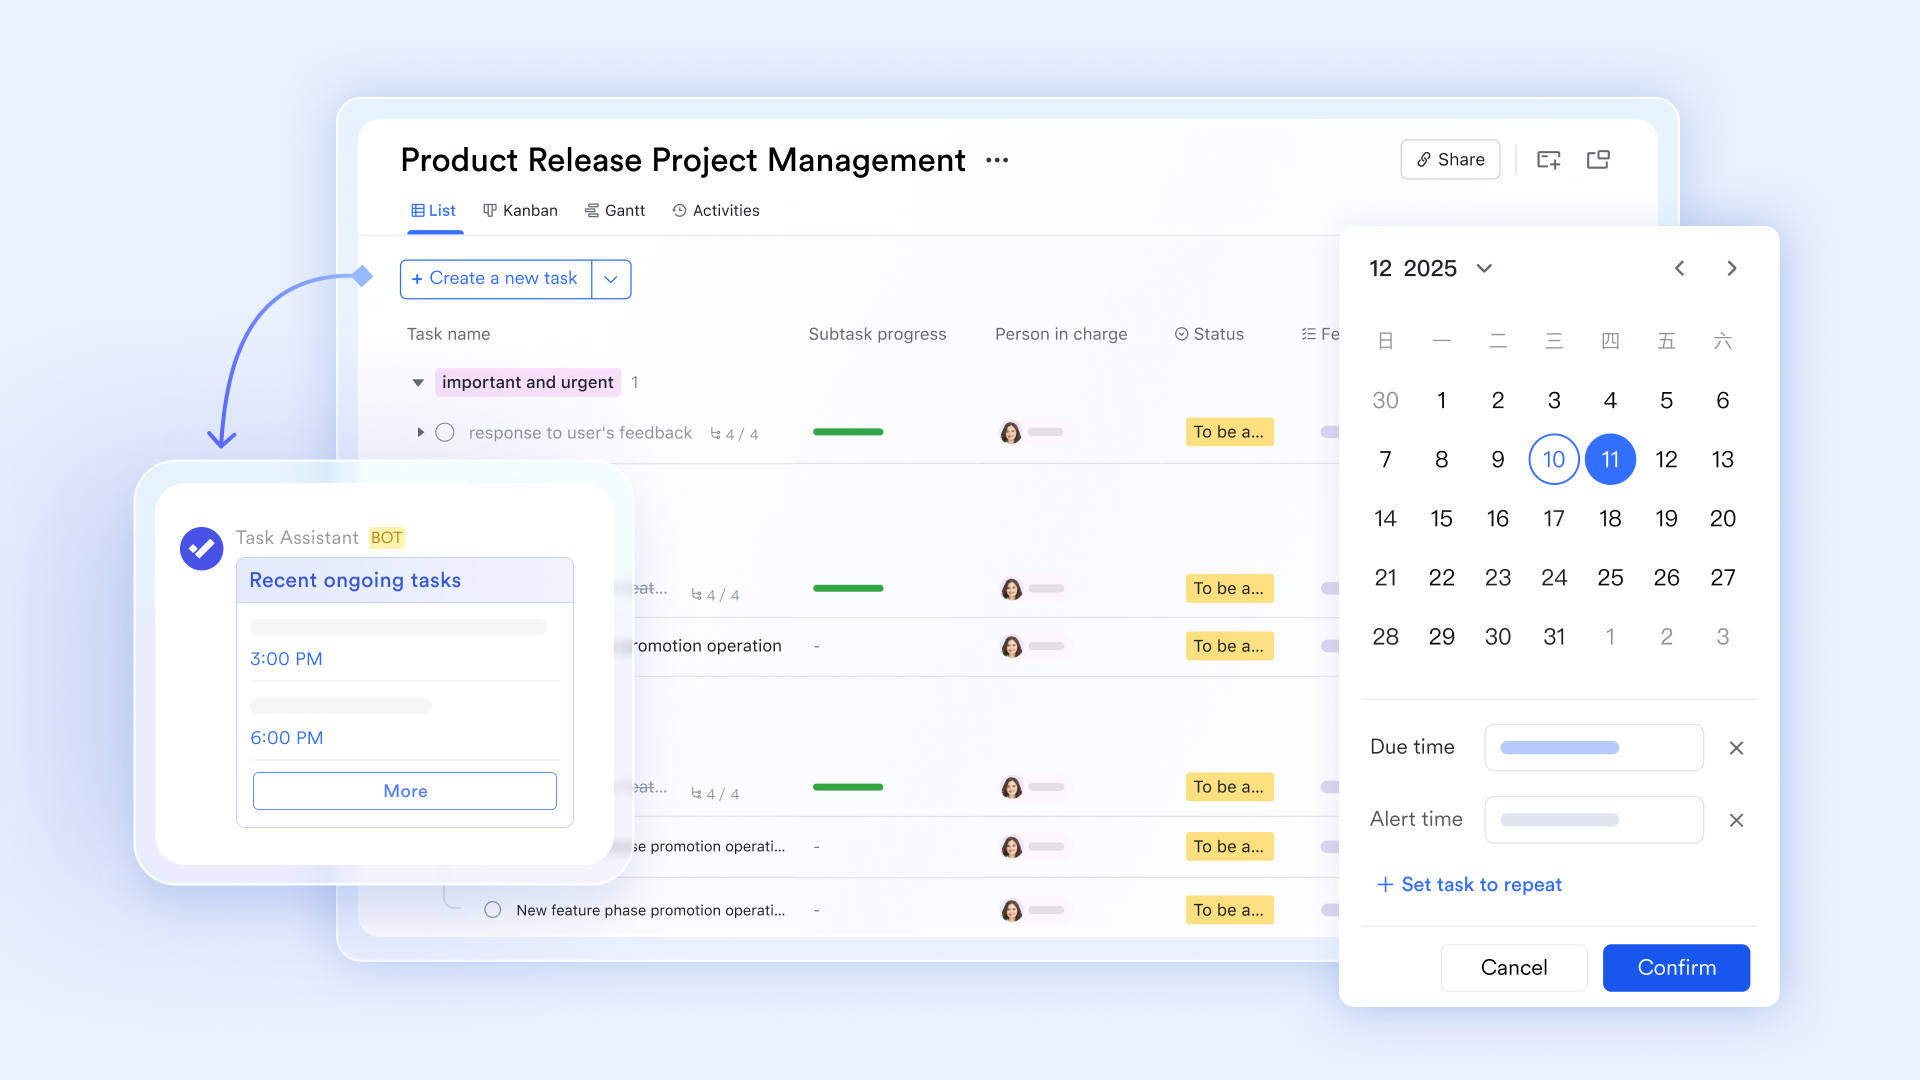
Instant chat-to-action loops: The most distinct advantage of Lark is how it shortens the distance between insight and action. Through deep connection with , critical data triggers can send automated alerts directly to the relevant marketing . Team members can then discuss the specific data point, tag colleagues, and assign corrective tasks immediately within the chat interface. This transforms analytics from a passive reporting function into an active operational engine, ensuring rapid response times to market changes.
Pros:
- Unifies data visualization with project management workflows.
- "Chat-to-Action" feature significantly reduces response times.
- Generous free tier that includes robust database features.
- Highly customizable interfaces for different stakeholders.
Cons:
- A little learning curve. Although user-friendly, new users may require time to adapt to its functionalities. But can assist users with potential problems.
Why it wins
- Actionable workflows: It bridges the critical gap between seeing a problem in the data and assigning a task to fix it, creating a seamless workflow that most standalone tools lack.
- Chat-to-action speed: Its unique "chat-to-action" capabilities drastically reduce the reaction time to market changes or budget overruns by notifying teams directly where they communicate.
- Unified ecosystem: It consolidates multiple tools—project management, messaging, and analytics — into one cost-effective platform, significantly reducing software bloat and context switching.
- Democratized data: The no-code database structure empowers non-technical marketers to build custom solutions and trackers without waiting for engineering support or SQL experts.
- Single source of truth: It serves as a central hub that keeps cross-functional teams (sales, marketing, product) aligned on the same real-time data, eliminating version control issues.
- : The platform transforms static reports into interactive workspaces where teams can comment and discuss metrics directly within the dashboard context.
- Starter plan: Free forever plan with 11 powerful tools for up to 20 users, 100GB storage, 1,000 automation runs, AI translations, and more. No credit card needed.
- Basic plan: $6/user/month (billed annually) for up to 500 users. Includes everything in Starter plus unlimited message history, 5TB storage, 1,000 automation runs, and more. Some users may need to to purchase.
- Pro plan: $12/user/month (billed annually) for up to 500 users. Includes everything in Basic plus group calling for up to 500 attendees, 15TB storage, 50,000 automation runs, and more.
- Enterprise plan: for custom pricing. Supports unlimited users and includes advanced automation, security, compliance, and management features.
For small teams with simple communication needs

18 months message history
1000 Base automation runs/month
2000 rows per table in Base
Most POPULAR
For companies with comprehensive collaboration and management needs
Unlimited message history
500-participant video meetings
50k Base automation runs/month
20k rows per table in Base
For large companies with advanced security and organizational management needs
Get a personalized demo and pricing
Unlimited message history
500-participant video meetings
15 TB storage + 30 GB storage/user
500k Base automation runs/month
50k Base automation runs/month
Most POPULAR
For companies with comprehensive collaboration and management needs
Unlimited message history
500-participant video meetings
50k Base automation runs/month
20k rows per table in Base
2. Google Analytics 4 (GA4): The industry standard for web traffic analysis
Overview
Google Analytics 4 (GA4) is the latest iteration of the world's most famous tracking platform. It has moved away from the session-based model of Universal Analytics to an event-based model, offering a more granular view of how users interact with your website and apps. To maximize data accuracy and maintain reliable tracking in a privacy-first environment, many teams are now implementing as a more advanced and resilient data collection approach. It is the default choice for tracking traffic sources, user engagement, and conversion events across the web.
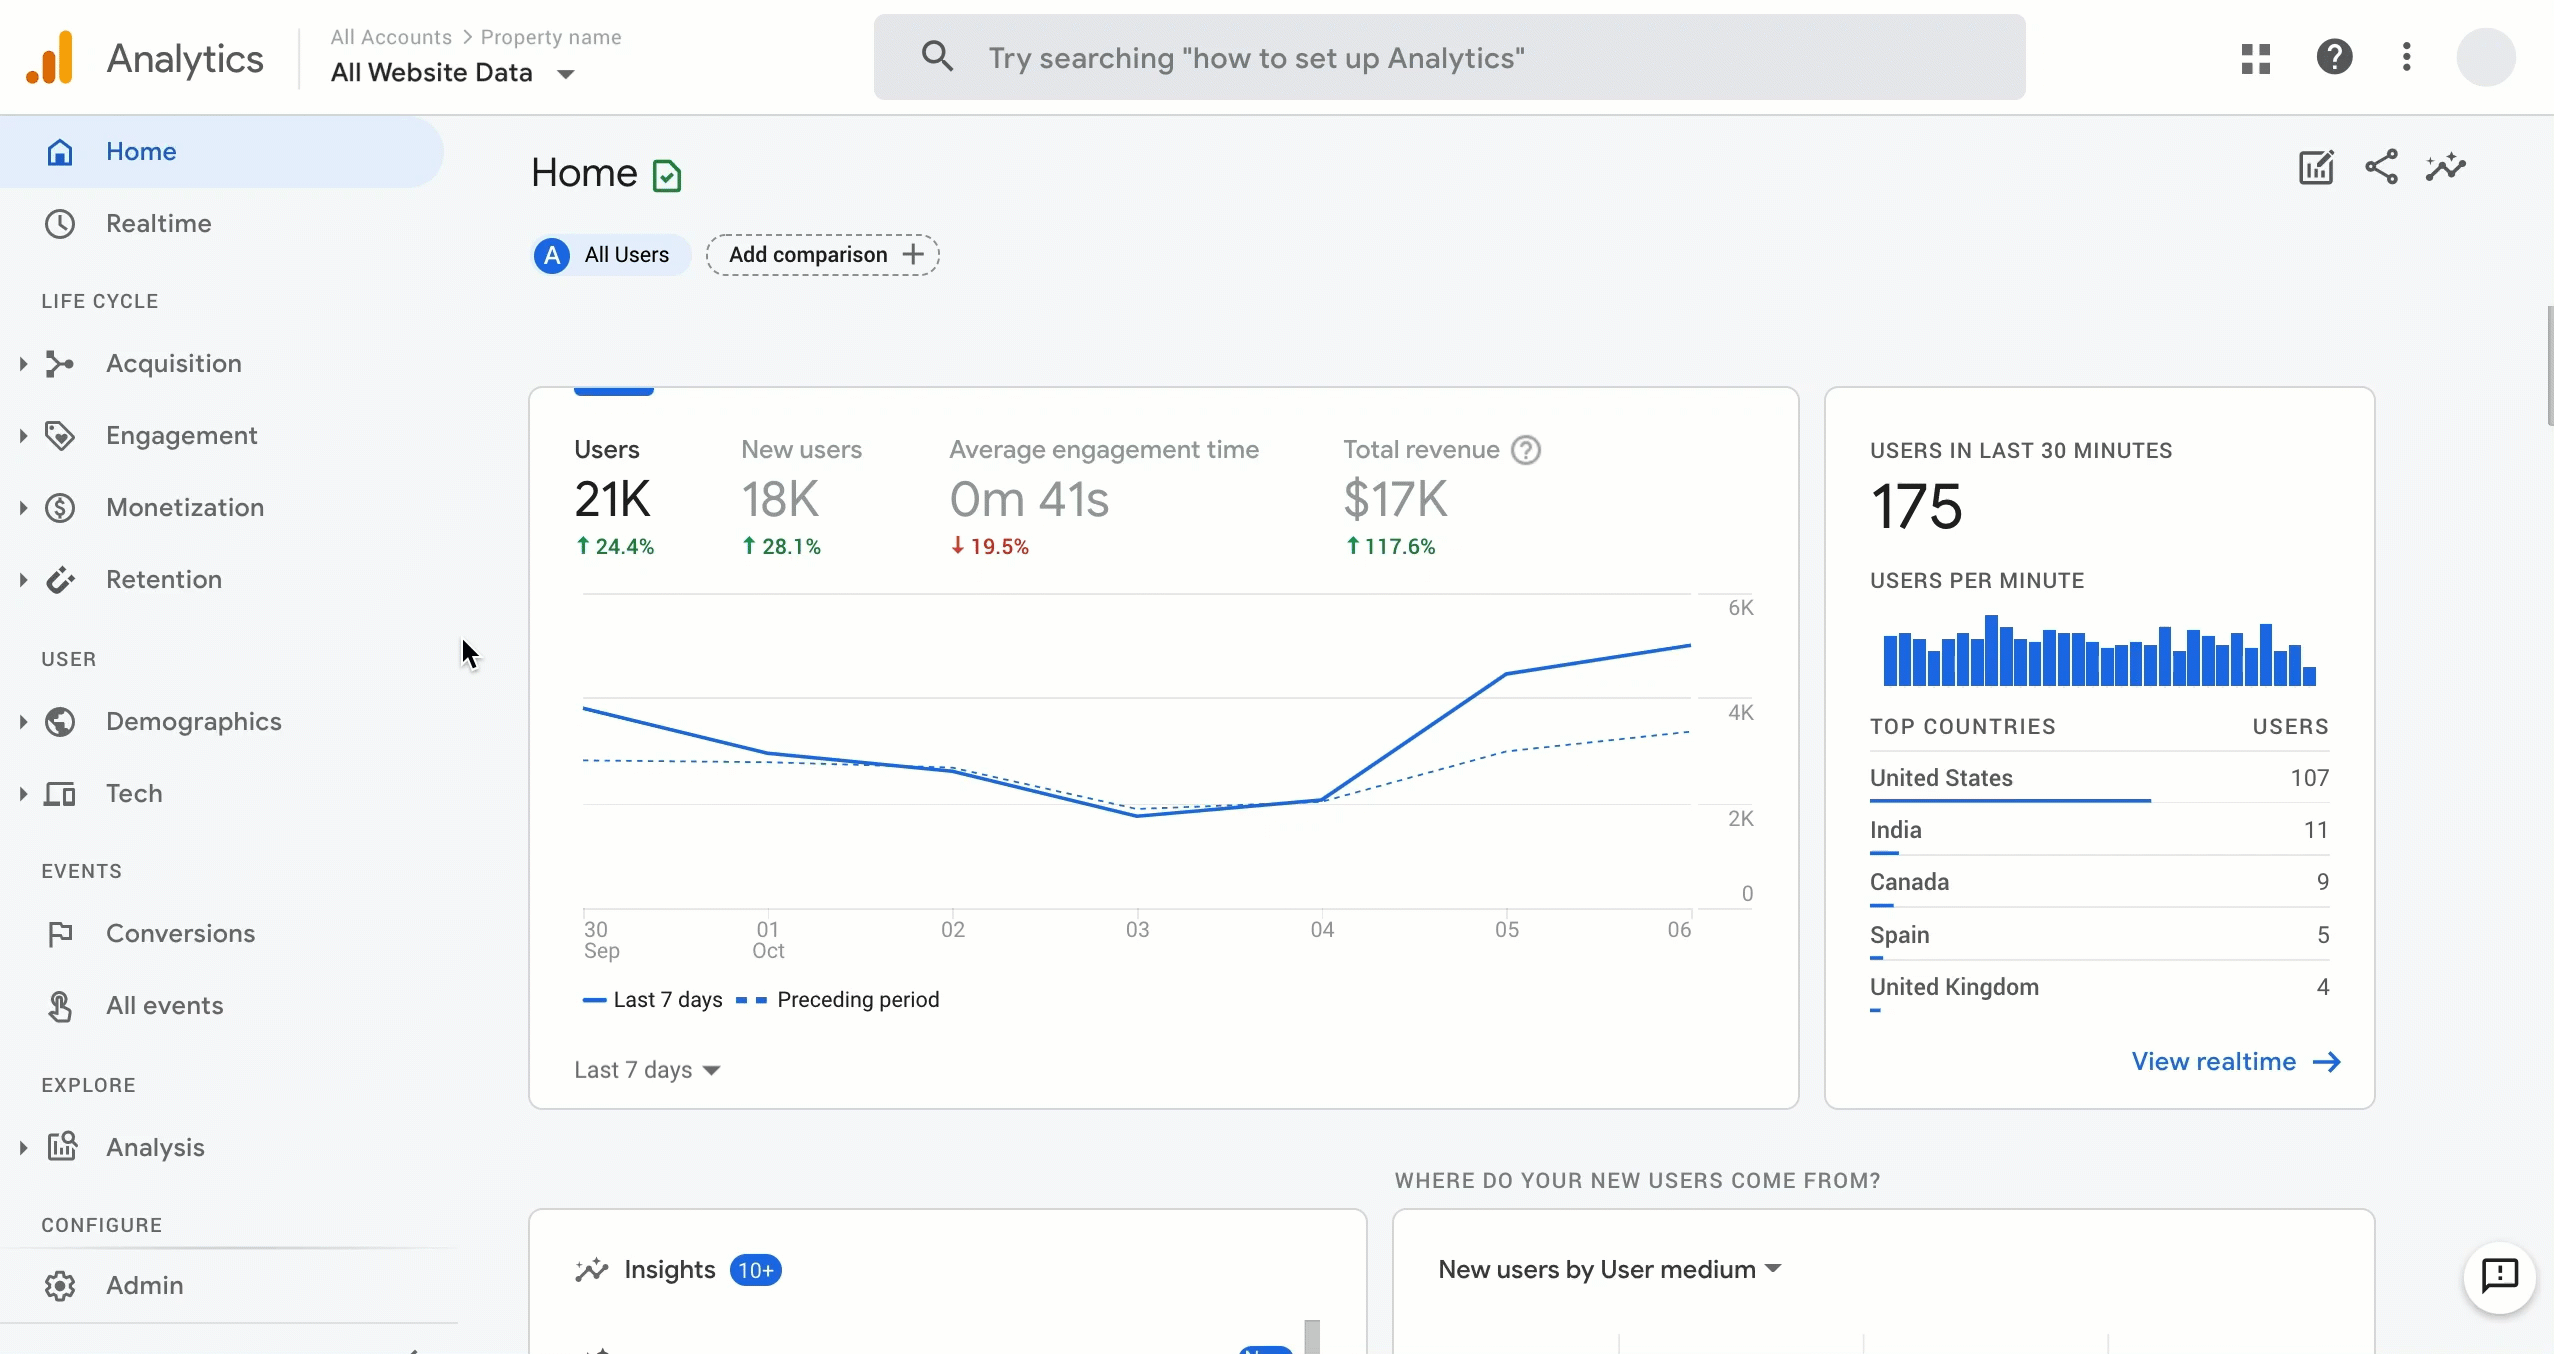
Image source: storage.googleapis.com
Key features
- Event-based data model that tracks distinct user interactions across web and app.
- Cross-platform tracking to unify user journeys across different devices.
- AI-powered predictive metrics to forecast purchase probability and churn rates.
- Direct integration with BigQuery for advanced data warehousing and raw data access.
- Customizable exploration reports for ad-hoc analysis and funnel visualization.
- Data-driven attribution models to assign credit to touchpoints across the full path.
Pros:
- Deep integration with the Google Ads ecosystem.
- Industry standard; widely supported by third-party tools.
- Completely free for the vast majority of users.
Cons:
- Steeper learning curve compared to the previous version.
- Data retention settings can be limited in the free version.
- Interface can feel complex for beginners.
Why it wins
- Universal language: It serves as the standard web analytics framework that almost every digital marketer knows how to use, ensuring easy hiring and onboarding.
- Ecosystem synergy: The deep integration with the Google Ads ecosystem allows for seamless audience retargeting and budget optimization based on behavioral data.
- Advanced AI access: It offers enterprise-grade machine learning and predictive features for free, making advanced insights like churn probability accessible to businesses of all sizes.
- Holistic tracking: Its ability to track users across platforms (app and web) provides a complete view of the customer journey that siloed tools cannot match.
Pricing
The standard version is free. There is a premium enterprise version($416.7/month per user) for large organizations with high data volume requirements.
3. HubSpot Marketing Hub: Connecting inbound marketing directly to revenue data
Overview
HubSpot is a powerhouse that brings marketing automation and analytics under one roof. Unlike standalone analytics tools, HubSpot connects your marketing activity directly to your CRM data. This allows for closed-loop reporting, meaning you can see exactly which blog post, email, or ad eventually led to a closed deal.
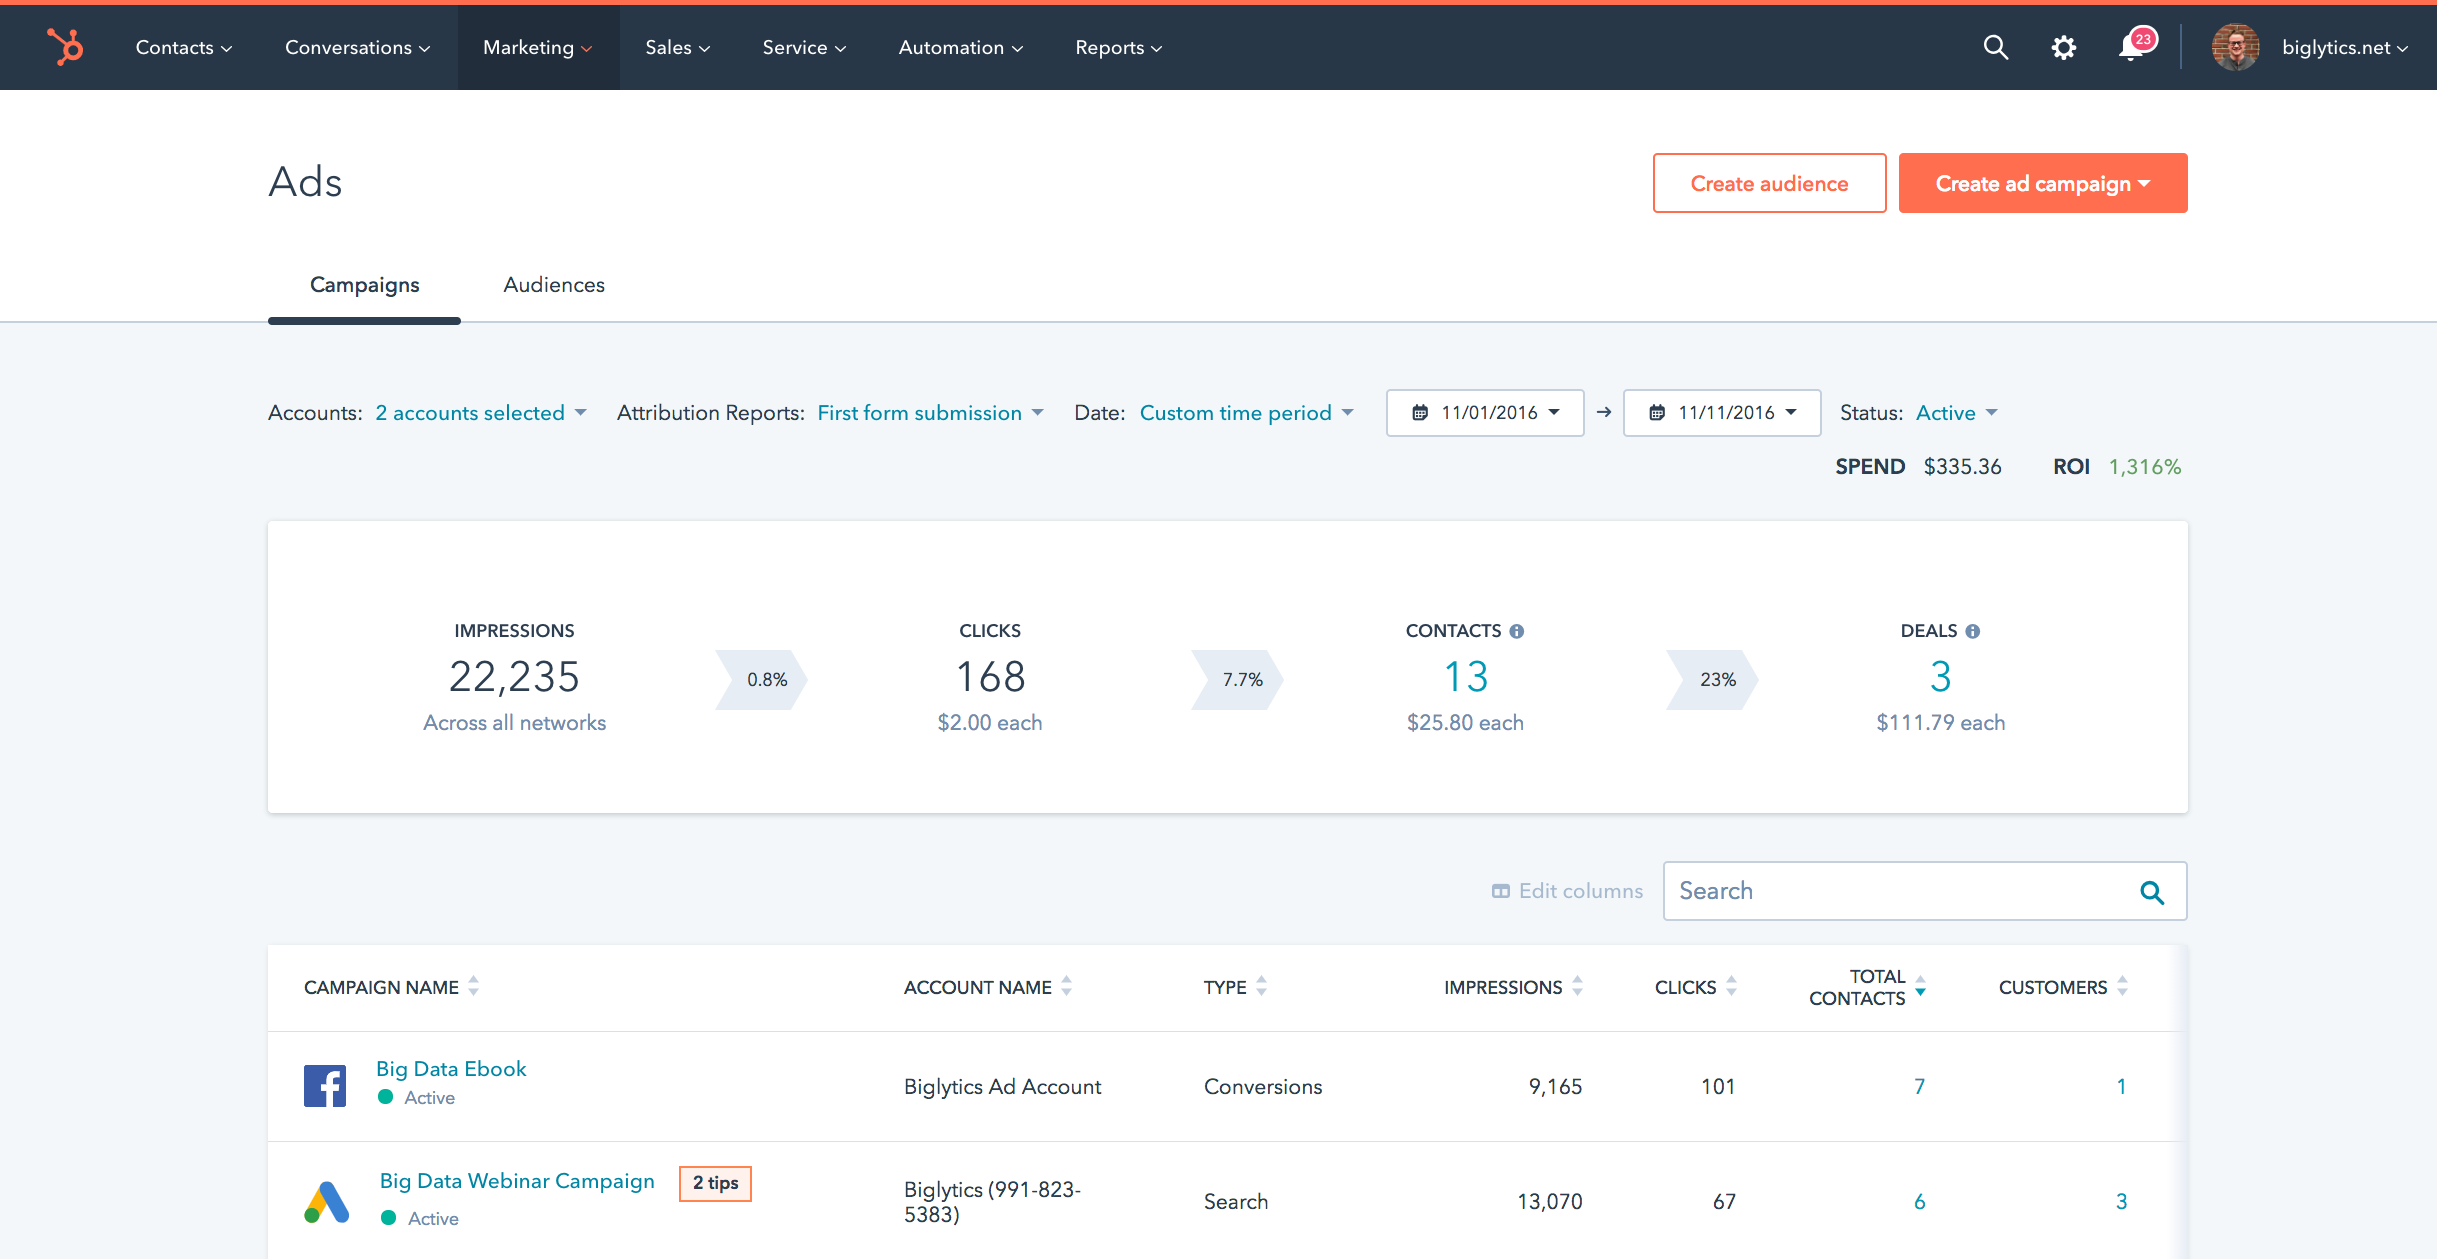
Image source: hubspot.com
Key features
- Closed-loop attribution reporting that connects marketing efforts to real sales revenue.
- Integrated CRM data for advanced segmentation and persona-based targeting.
- Built-in A/B testing tools for landing pages, emails, and calls-to-action.
- Detailed content analytics to measure blog and website performance.
- Social media management tools for scheduling, publishing, and tracking engagement.
- SEO recommendations and topic cluster tools to improve organic search visibility.
Pros:
- Seamless integration between marketing and sales data.
- Extremely user-friendly interface.
- All-in-one platform reduces the need for multiple subscriptions.
Cons:
- Can become expensive as your contact database grows.
- Advanced reporting features are gated behind higher tiers.
Why it wins
- Contextual intelligence: It provides the ultimate context by linking anonymous website visitors to actual names and deals in your CRM, personalizing the data.
- Revenue proof: The closed-loop reporting proves the direct revenue impact of specific content pieces and email campaigns, finally justifying marketing spend to the CFO.
- Unified platform: Its all-in-one ecosystem eliminates the need for brittle, complex data integrations between marketing automation software and sales tools.
- Creative autonomy: The user-friendly interface allows creative teams to run complex, data-backed campaigns without needing constant technical assistance from IT.
Pricing
Offers a limited free tier. Paid plans range from Starter($9/month per user ) to Professional ($800/month per user), scaling with features and contact count.
4. Mixpanel: Advanced product analytics for user retention
Overview
While Google Analytics focuses on traffic, Mixpanel focuses on engagement. It is a product analytics tool designed to help you understand how users interact with your specific features. It answers questions like "Do users who watch the tutorial video have a higher retention rate?" It is heavily used by SaaS companies to optimize the user experience.
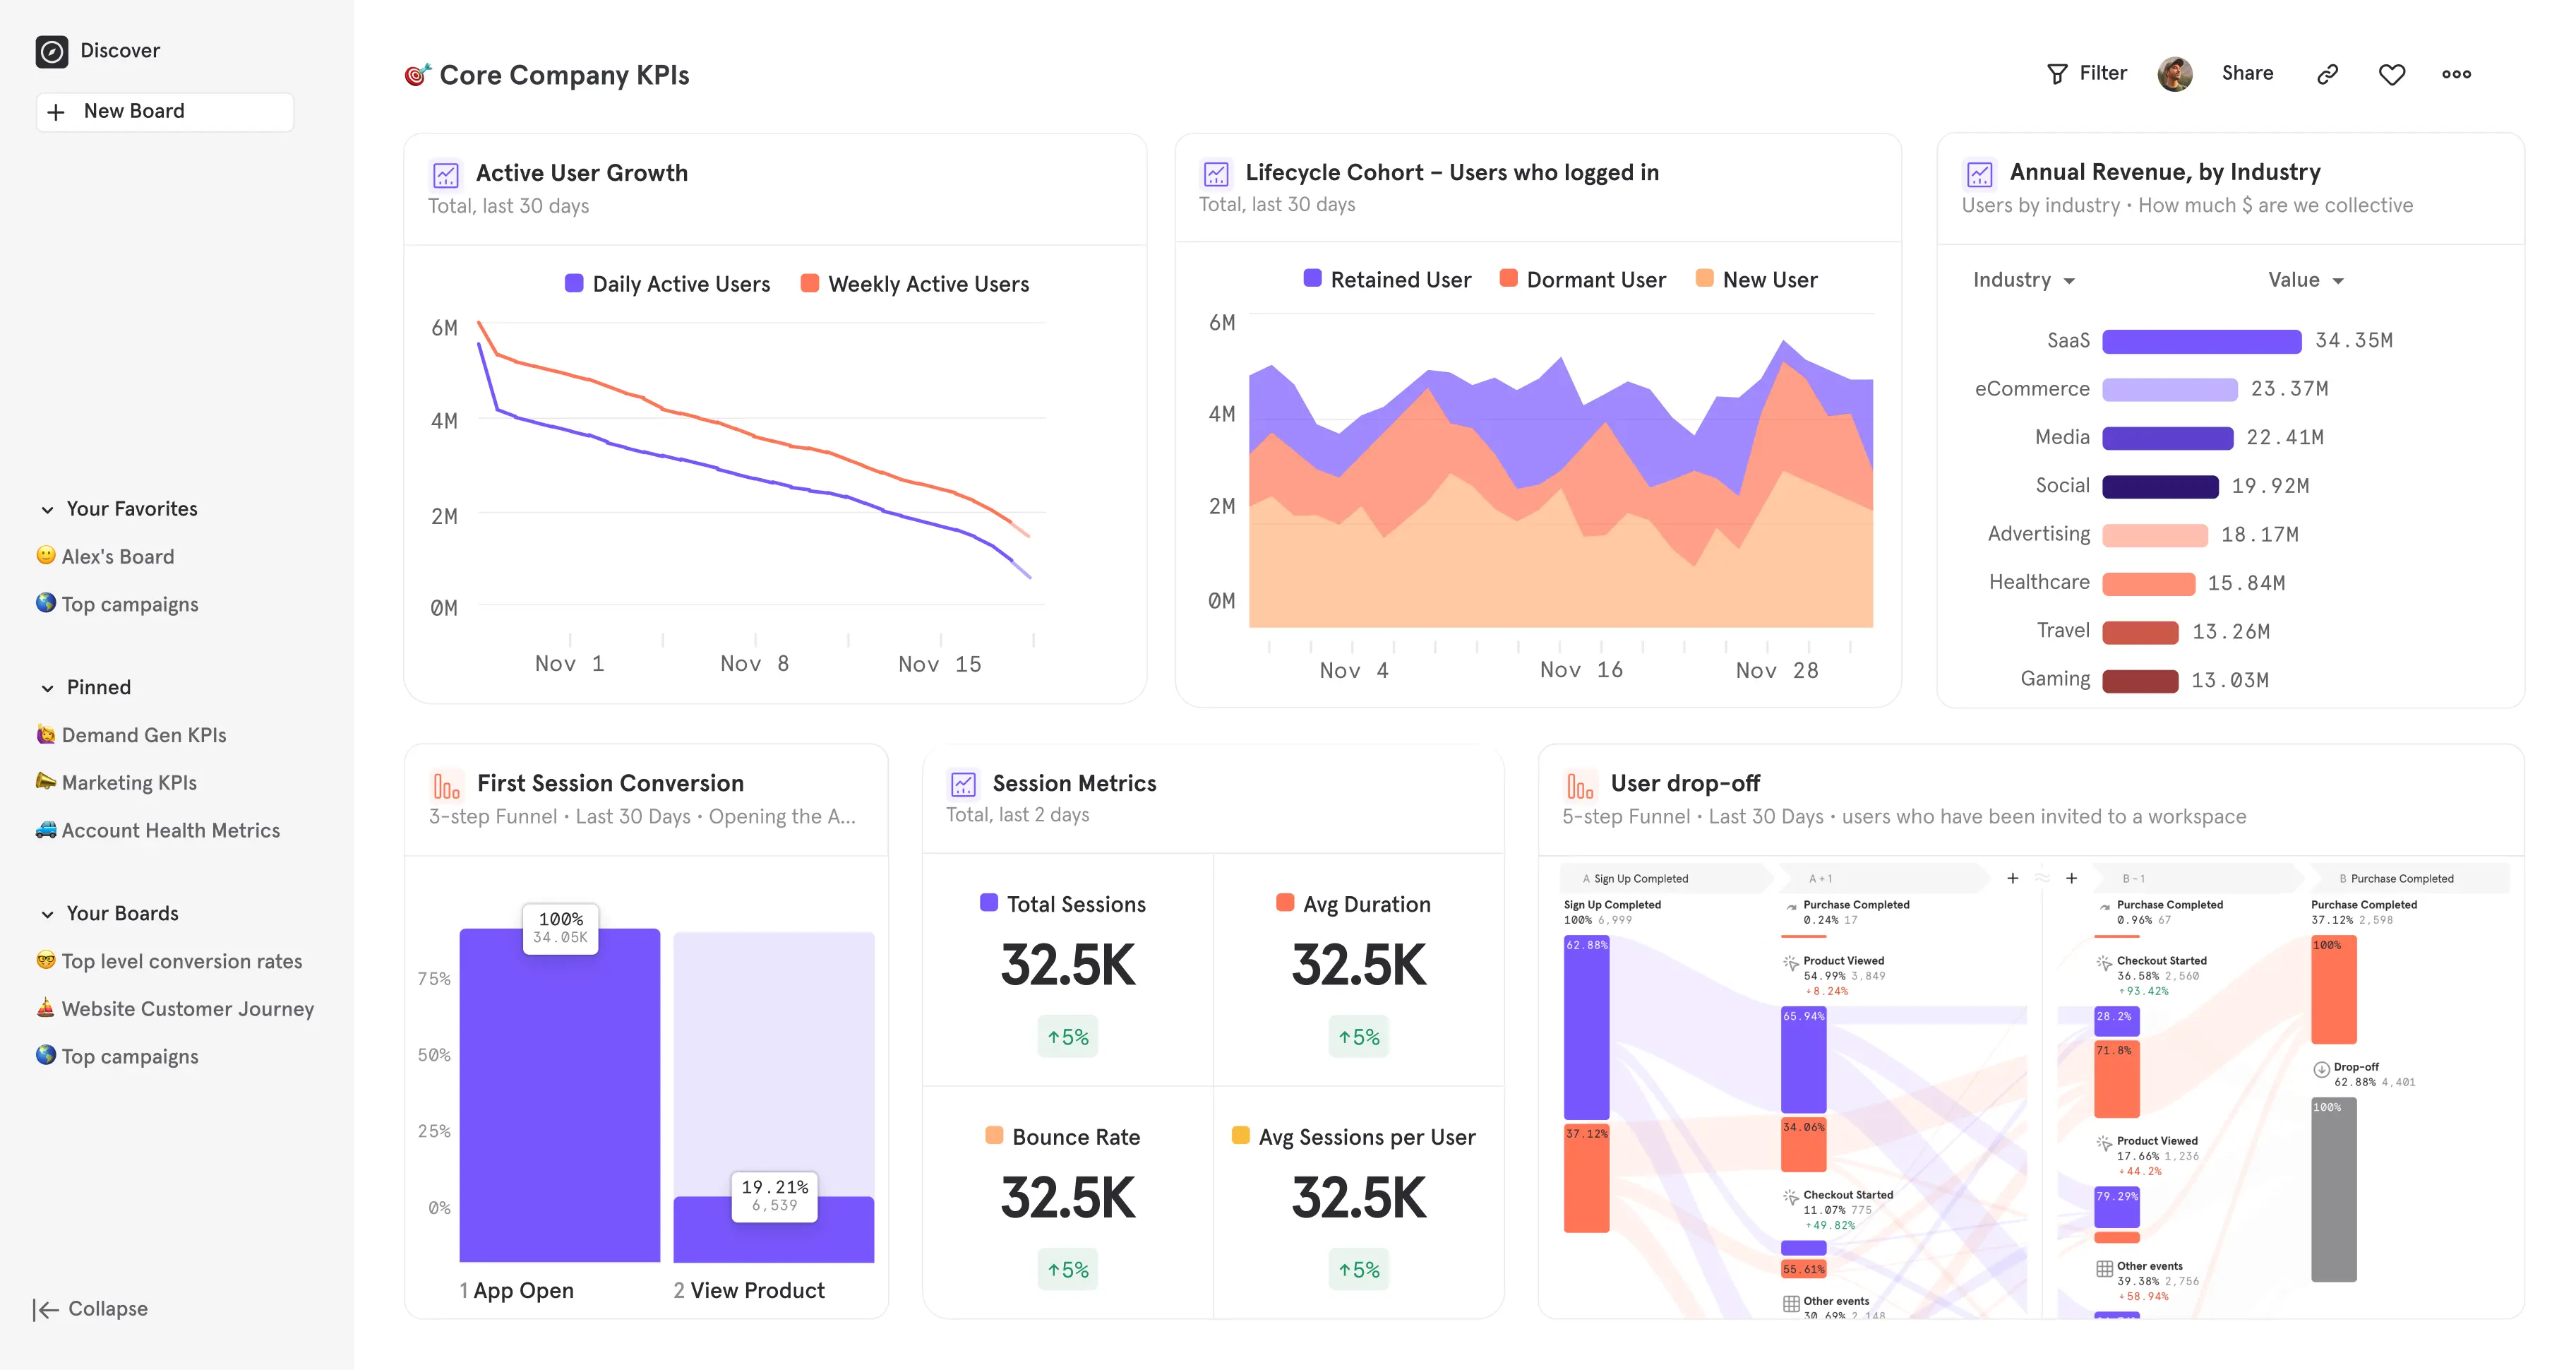
Image source: framerusercontent.com
Key features
- Advanced funnel analysis to pinpoint exactly where users drop off in a workflow.
- retention cohorts to track user loyalty and engagement over time.
- Interactive flow reports that visualize the most common paths users take.
- Impact analysis to measure how specific feature launches affect user behavior.
- Group analytics designed for B2B companies to track account-level usage.
- Scalable event tracking that handles high volumes of data without sampling.
Pros:
- Best-in-class for understanding user behavior and product usage.
- Real-time data availability.
- Very intuitive visualization of complex user flows.
Cons:
- Not designed for tracking top-of-funnel traffic sources.
- Can get pricey with high event volumes.
Why it wins
- Behavioral depth: It goes beyond vanity metrics like page views to reveal exactly how users interact with your product's specific features and buttons.
- Retention mastery: The laser focus on retention analysis helps SaaS companies maximize customer lifetime value (CLV) rather than just focusing on top-of-funnel acquisition.
- Self-serve answers: Its intuitive design empowers product managers to answer their own complex data questions instantly without relying on data scientists.
- Precision segmentation: The ability to segment users based on complex behaviors allows for highly targeted product improvements and personalized messaging strategies.
Pricing
Offers a generous free plan for low data volumes. Paid plans are only available for quotes.
5. Semrush: Comprehensive suite for SEO and competitive intelligence
Overview
Semrush is a comprehensive suite designed to improve your online visibility. It is primarily known for its SEO capabilities, allowing you to audit your website, research profitable keywords, and spy on your competitors' ad strategies. It turns the "black box" of search engine algorithms into actionable data.
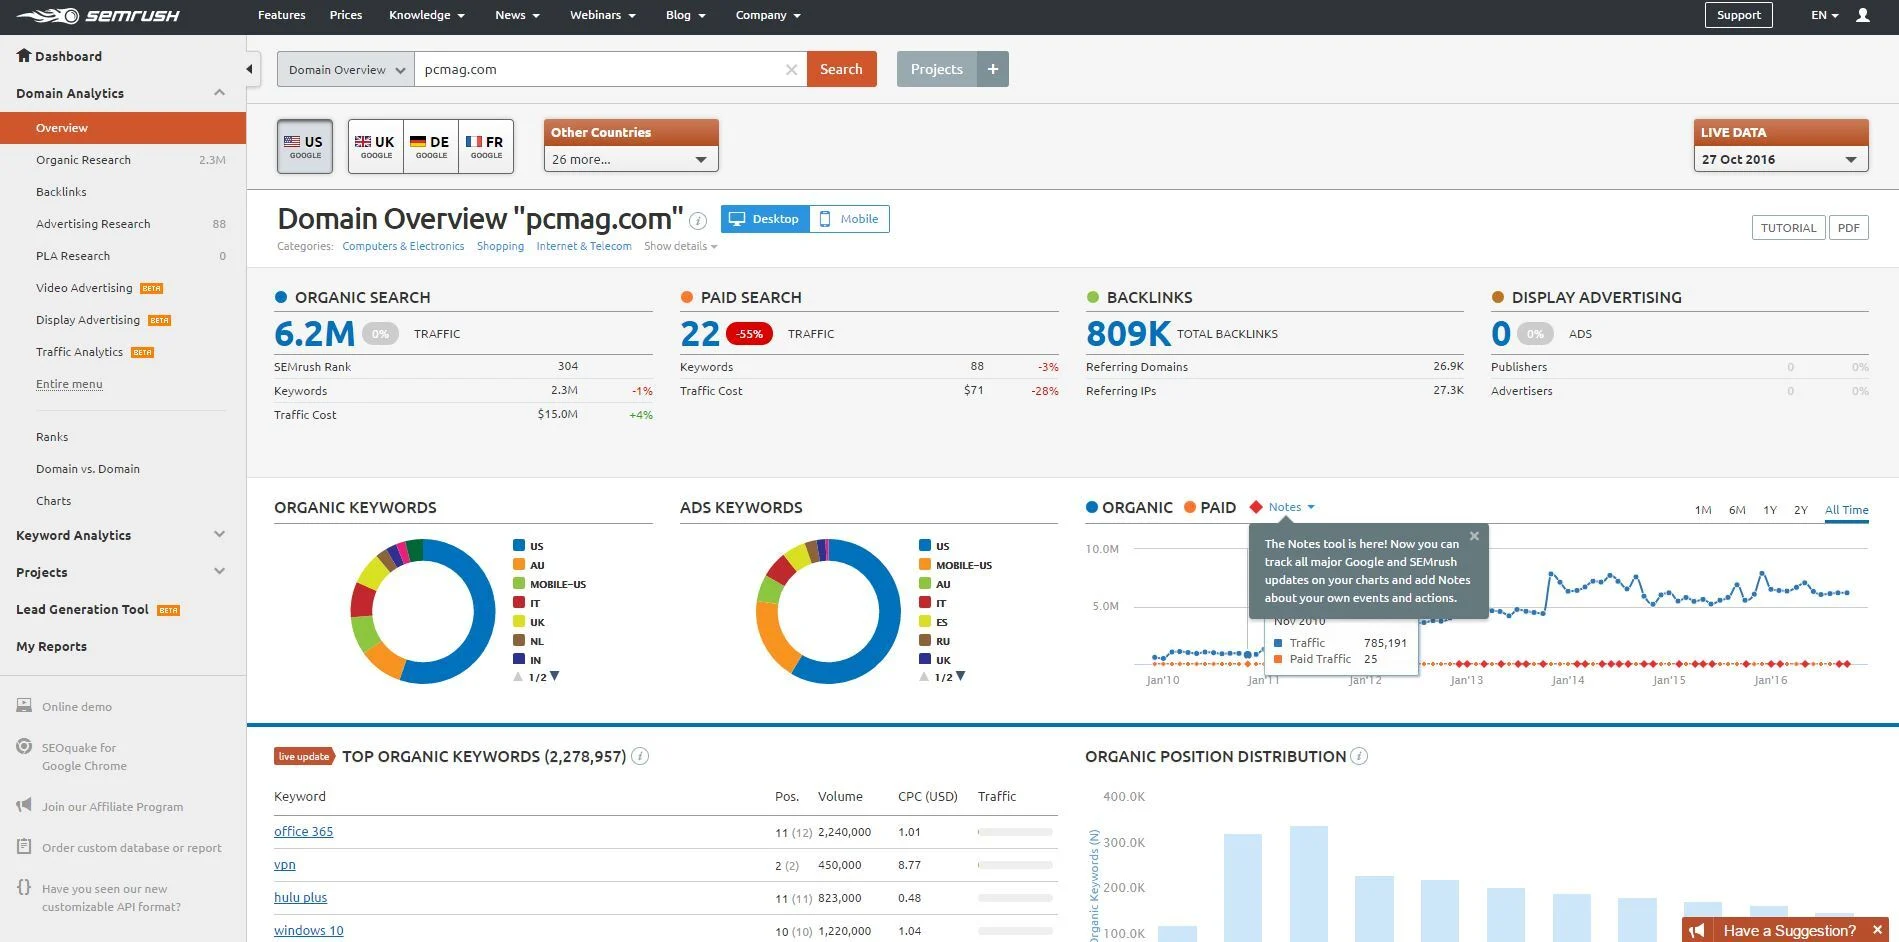
Image source: i.pcmag.com
Key features
- Comprehensive keyword research tools with volume, difficulty, and intent metrics.
- Technical site audit features to identify and fix SEO health issues.
- Competitor analysis tools to uncover rival traffic sources and ad strategies.
- Backlink gap analysis to find link-building opportunities your competitors are using.
- Daily rank tracking to monitor your position changes in search results.
- Content marketing toolkit to optimize on-page SEO and readability.
Pros:
- Unmatched data on competitor strategies.
- Covers SEO, PPC, and social media in one platform.
- Excellent reporting tools for agencies.
Cons:
- The interface can be overwhelming due to the sheer number of features.
- Can be expensive for freelancers or small startups.
Why it wins
- Competitor visibility: It offers unmatched visibility into competitor strategies, effectively letting you peek at their playbook to see what keywords and ads are driving their growth.
- Strategic discovery: The tool acts as a discovery engine, uncovering market gaps and keyword opportunities that would remain invisible with internal data alone.
- Tool consolidation: It consolidates SEO, content marketing, and competitor research into a single subscription, reducing the need for multiple disparate tools.
- Data-driven planning: The vast database of keyword and backlink data makes it indispensable for planning organic search and content strategies with high confidence.
Pricing
Monthly subscription model with tiers for individuals, agencies, and enterprises, with the lowest plan costing $165.17/user/month.
6. Tableau: Powerhouse for advanced data visualization and BI
Overview
Tableau is not strictly a marketing tool; it is a Business Intelligence (BI) platform that can visualize any data you throw at it. For marketing teams dealing with massive datasets from complex sources, Tableau offers the ability to blend data and create stunning, interactive visualizations that reveal hidden patterns.
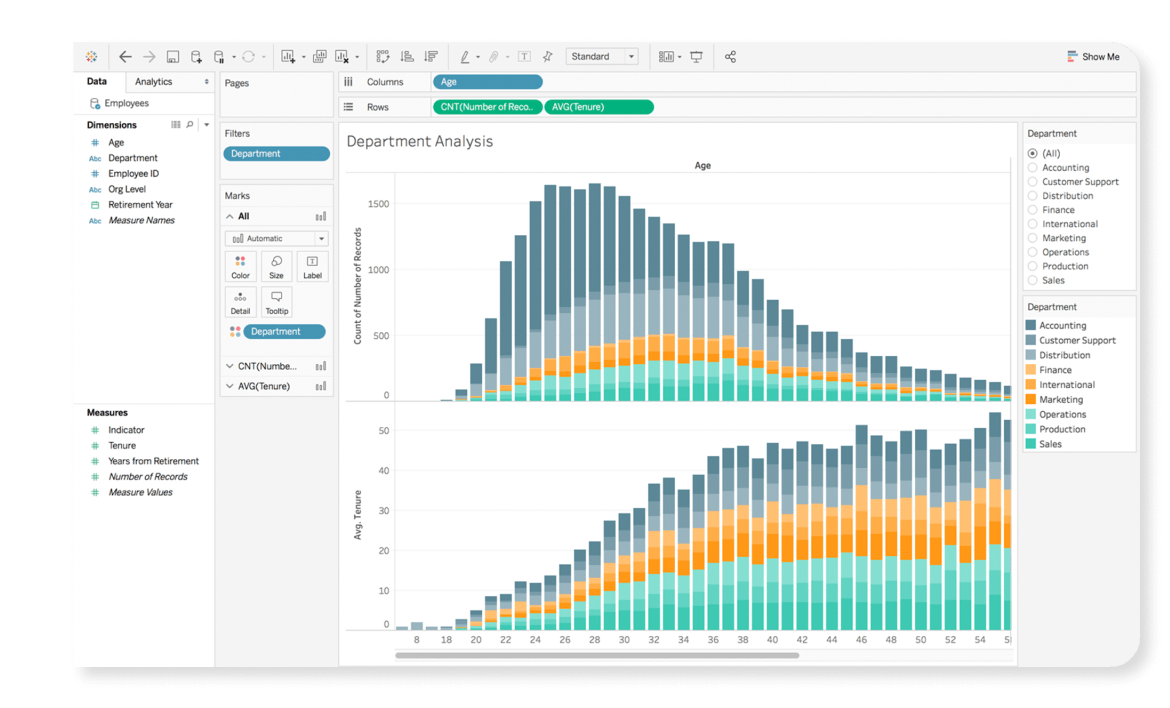
Image source: wp.sfdcdigital.com
Key features
- Drag-and-drop interface for building complex visualizations without coding.
- Data blending capabilities to combine sources like Excel, SQL, and cloud apps.
- "Ask Data" feature that allows users to query data using natural language.
- Interactive dashboards with drill-down capabilities for deeper exploration.
- Robust mobile optimization to ensure reports are readable on any device.
- Server and cloud sharing options for secure enterprise-wide collaboration.
Pros:
- Extremely powerful visualization capabilities.
- Can handle massive datasets without slowing down.
- Robust community and resource library.
Cons:
- Steeper learning curve; requires some data analyst skills.
- Overkill for small teams with simple tracking needs.
Why it wins
- Enterprise performance: It handles massive, complex datasets with speed and stability that standard web-based dashboards simply cannot match.
- Narrative flexibility: The flexibility of the visualization engine allows analysts to tell any specific data story without being restricted by rigid, pre-built templates.
- Data blending power: It excels at blending data from multiple disparate sources (SQL, Excel, cloud apps) into a single, coherent visual narrative.
- Community support: The robust user community and extensive resource library make it significantly easier to find solutions for complex visualization challenges.
Pricing
Charged per user/license (Standard, Enterprise and custom plans), with the lowest billed $75/user/month.
7. HockeyStack: Unified B2B attribution and revenue analytics
Overview
HockeyStack is a modern analytics platform built specifically for B2B SaaS companies. It solves the messy problem of B2B customer journeys, which often involve multiple stakeholders, long sales cycles, and offline touchpoints. It unifies marketing, sales, and product data to show exactly what drives revenue.
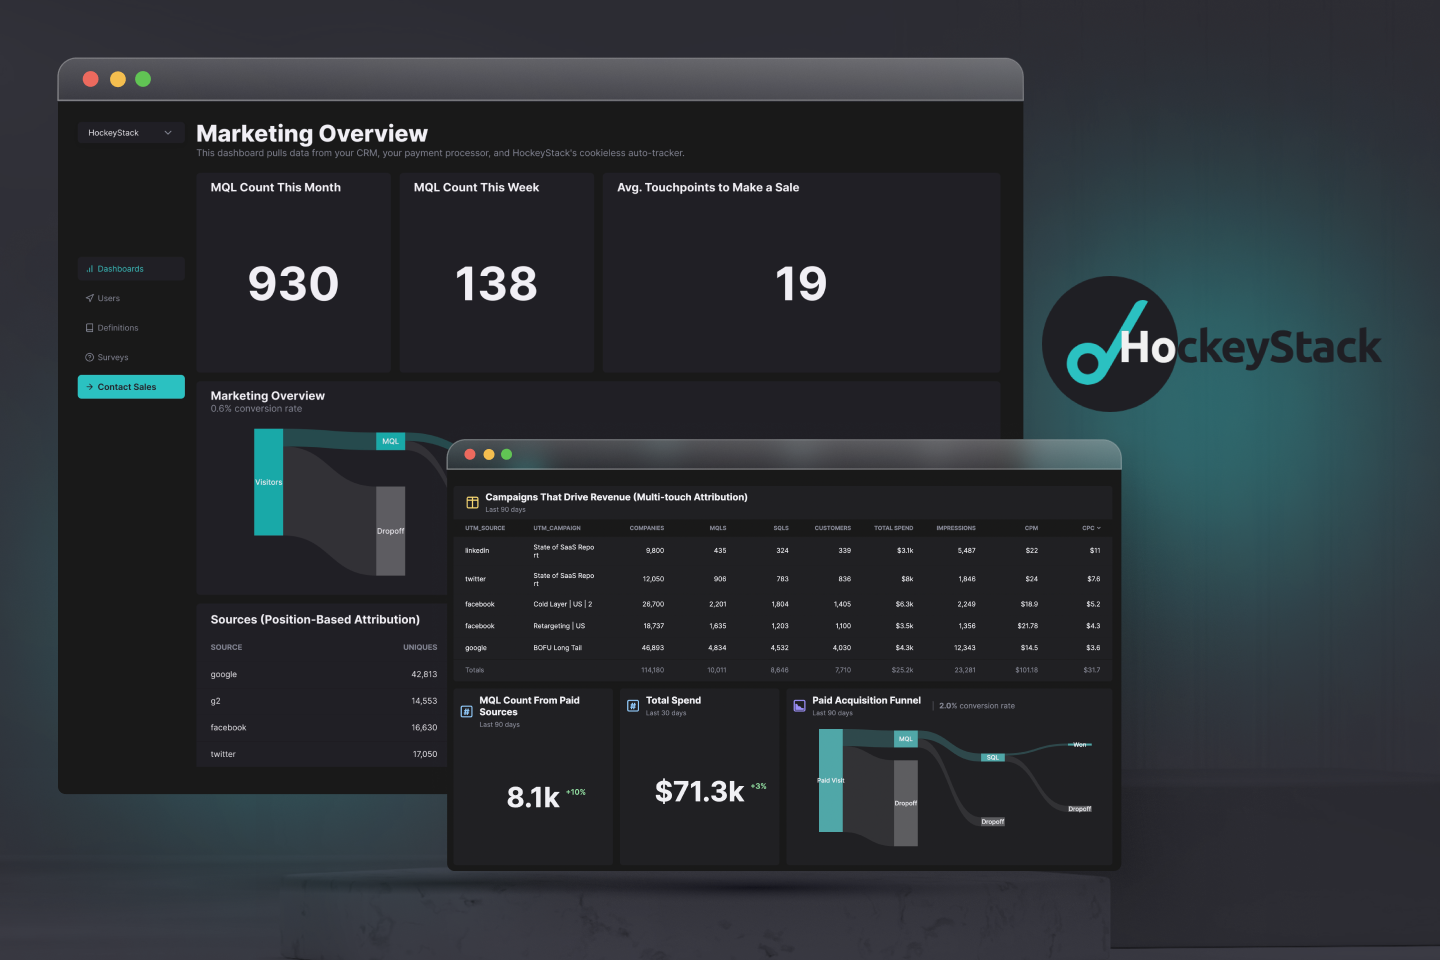
Image source: writerzen.net
Key features
- Unified customer journey mapping from the first ad click to closed revenue.
- Account-based analytics specifically designed for complex B2B sales cycles.
- Cross-domain tracking to connect website behavior with SaaS product usage.
- Native integrations with major CRMs (Salesforce, HubSpot) and payment processors (Stripe).
- Lift analysis to measure the incremental impact of marketing campaigns.
- No-code dashboard builder that enables non-technical teams to create reports.
Pros:
- Tailored specifically for the complexities of B2B SaaS.
- Fast implementation compared to legacy enterprise tools.
- Automatic tracking without manual event setup.
Cons:
- Less relevant for B2C or e-commerce brands.
- Newer to the market than established giants like Adobe.
Why it wins
- B2B specialization: It is purpose-built for the complex, non-linear purchase journeys typical of B2B SaaS companies, capturing nuances that generic tools miss.
- Revenue truth: The platform unifies marketing, sales, and product data to show the true source of revenue, moving the conversation beyond simple lead generation.
- Speed to value: Its no-code setup allows teams to implement advanced retrospective tracking in minutes rather than the months required by legacy enterprise tools.
- Alignment focus: The account-based view aligns perfectly with how B2B sales teams actually operate, bridging the operational gap between marketing and sales departments.
Pricing
Custom pricing based on the company's annual revenue and data needs.
8. Matomo: The privacy-first, open-source web analytics alternative
Overview
As privacy concerns grow, Matomo has emerged as the leading ethical alternative to the big tech giants. It is an open-source web analytics platform that gives you 100% ownership of your data. It is widely used by governments and privacy-conscious corporations.
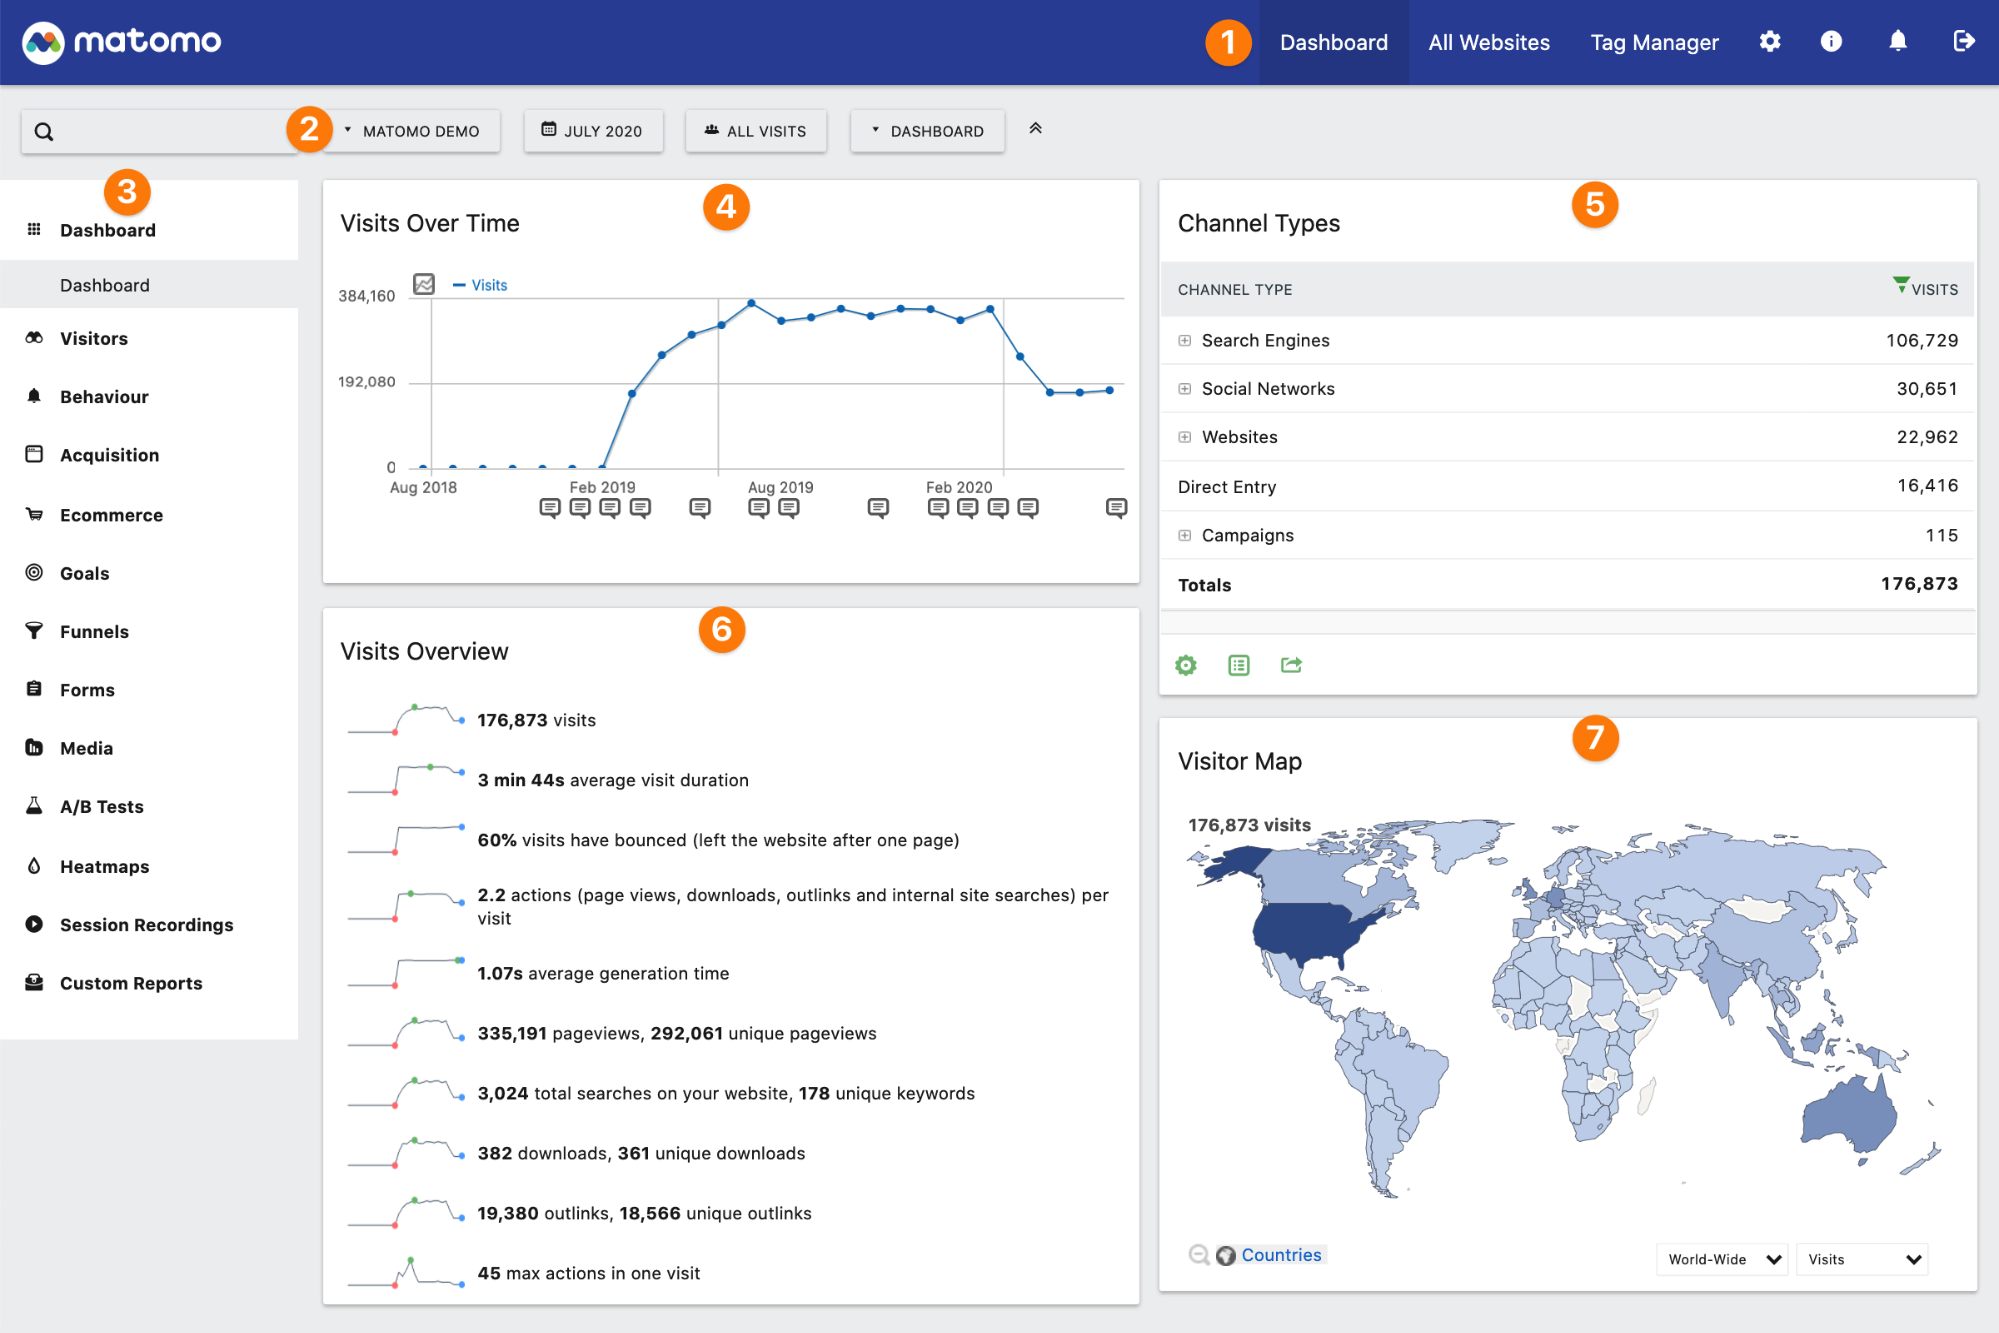
Image source: matomo.com
Key features
- 100% data ownership options via on-premise hosting to ensure complete privacy.
- Unsampled data reports to provide total accuracy regardless of traffic volume.
- Built-in heatmaps and session recordings to visualize user behavior.
- Form analytics to identify which fields cause users to abandon sign-ups.
- GDPR compliance manager to handle user consent and data deletion requests.
- Integrated tag manager for easy deployment of tracking codes without IT help.
Pros:
- Complete control over data and privacy compliance.
- Includes features like heatmaps that are usually paid add-ons.
- No data limits or sampling.
Cons:
- Self-hosting requires technical maintenance and server costs.
- Interface is functional but less polished than competitors.
Why it wins
- Compliance safety: It provides a safe haven for organizations that need strict compliance with GDPR, HIPAA, and other rigorous privacy regulations.
- Data sovereignty: The guarantee of 100% data ownership eliminates the risk of sharing sensitive user data with third-party tech giants or advertising networks.
- Unsampled accuracy: It offers unsampled data processing, ensuring that critical business decisions are based on the complete picture rather than statistical guesses.
- Open-source flexibility: The open-source nature of the platform allows for unlimited customization to fit unique and specific business requirements.
Pricing
The "On-Premise" version is free (you pay for your own hosting). The "Cloud" version has a monthly fee based on traffic, whose pricing is based on your needs.
9. Supermetrics: Automating data pipelines for spreadsheets and warehouses
Overview
Supermetrics is the glue that holds many marketing stacks together. It is an ETL (Extract, Transform, Load) tool that automates the transfer of marketing data from platforms like Facebook Ads, LinkedIn, and Stripe into destinations like Google Sheets, Excel, or BigQuery.
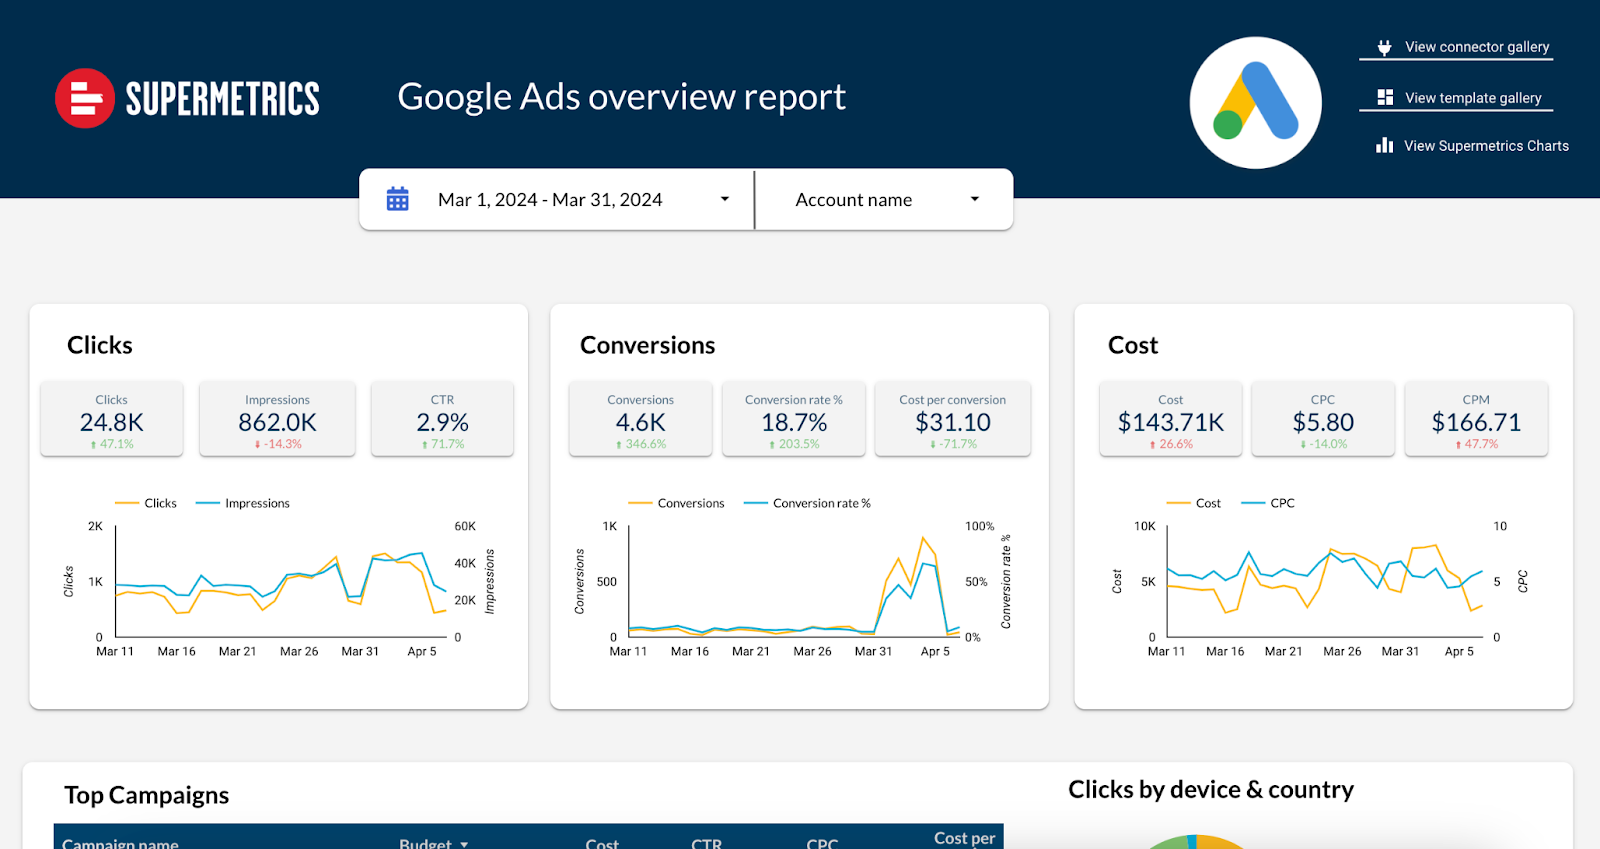
Image source: cdn.prod.website-files.com
Key features
- Automated data extraction from over 100 different marketing and sales platforms.
- Direct integration with Google Sheets, Excel, Looker Studio, and BigQuery.
- Scheduled data refreshes to ensure reports are always up-to-date.
- Data blending features to normalize metrics across different ad channels.
- Pre-built reporting templates to launch dashboards in minutes.
- Historical data retrieval to backfill reports with past performance metrics.
Pros:
- Saves countless hours of manual data entry and copy-pasting.
- Extremely reliable and secure data pipelines.
- Easy to set up with familiar tools like Google Sheets.
Cons:
- It is a connector, not a visualization tool (you need a destination).
- It can be expensive if you need many data sources or users.
Why it wins
- Time automation: It completely eliminates the error-prone manual drudgery of copy-pasting data from ad platforms into spreadsheets, saving hours every week.
- Connectivity depth: The sheer number of connectors ensures that virtually any marketing platform in your stack can be integrated into your central reporting.
- Platform familiarity: It allows marketers to analyze data within the tools they already know and love, such as Google Sheets and Excel, reducing the learning curve.
- Pipeline reliability: The reliability of its data pipelines ensures that client reports and internal dashboards are always ready and accurate on time.
Pricing
Tiered pricing based on the number of data sources and destinations, with the lowest billed $29/user/month.
10. Salesforce Marketing Cloud: Enterprise-grade customer journey and personalization engine
Overview
Salesforce Marketing Cloud is the heavyweight champion of enterprise marketing. It is a massive suite of tools designed to manage the customer experience across every channel—email, mobile, social, and web. It excels at personalization at scale, using data to trigger specific messages for millions of users.
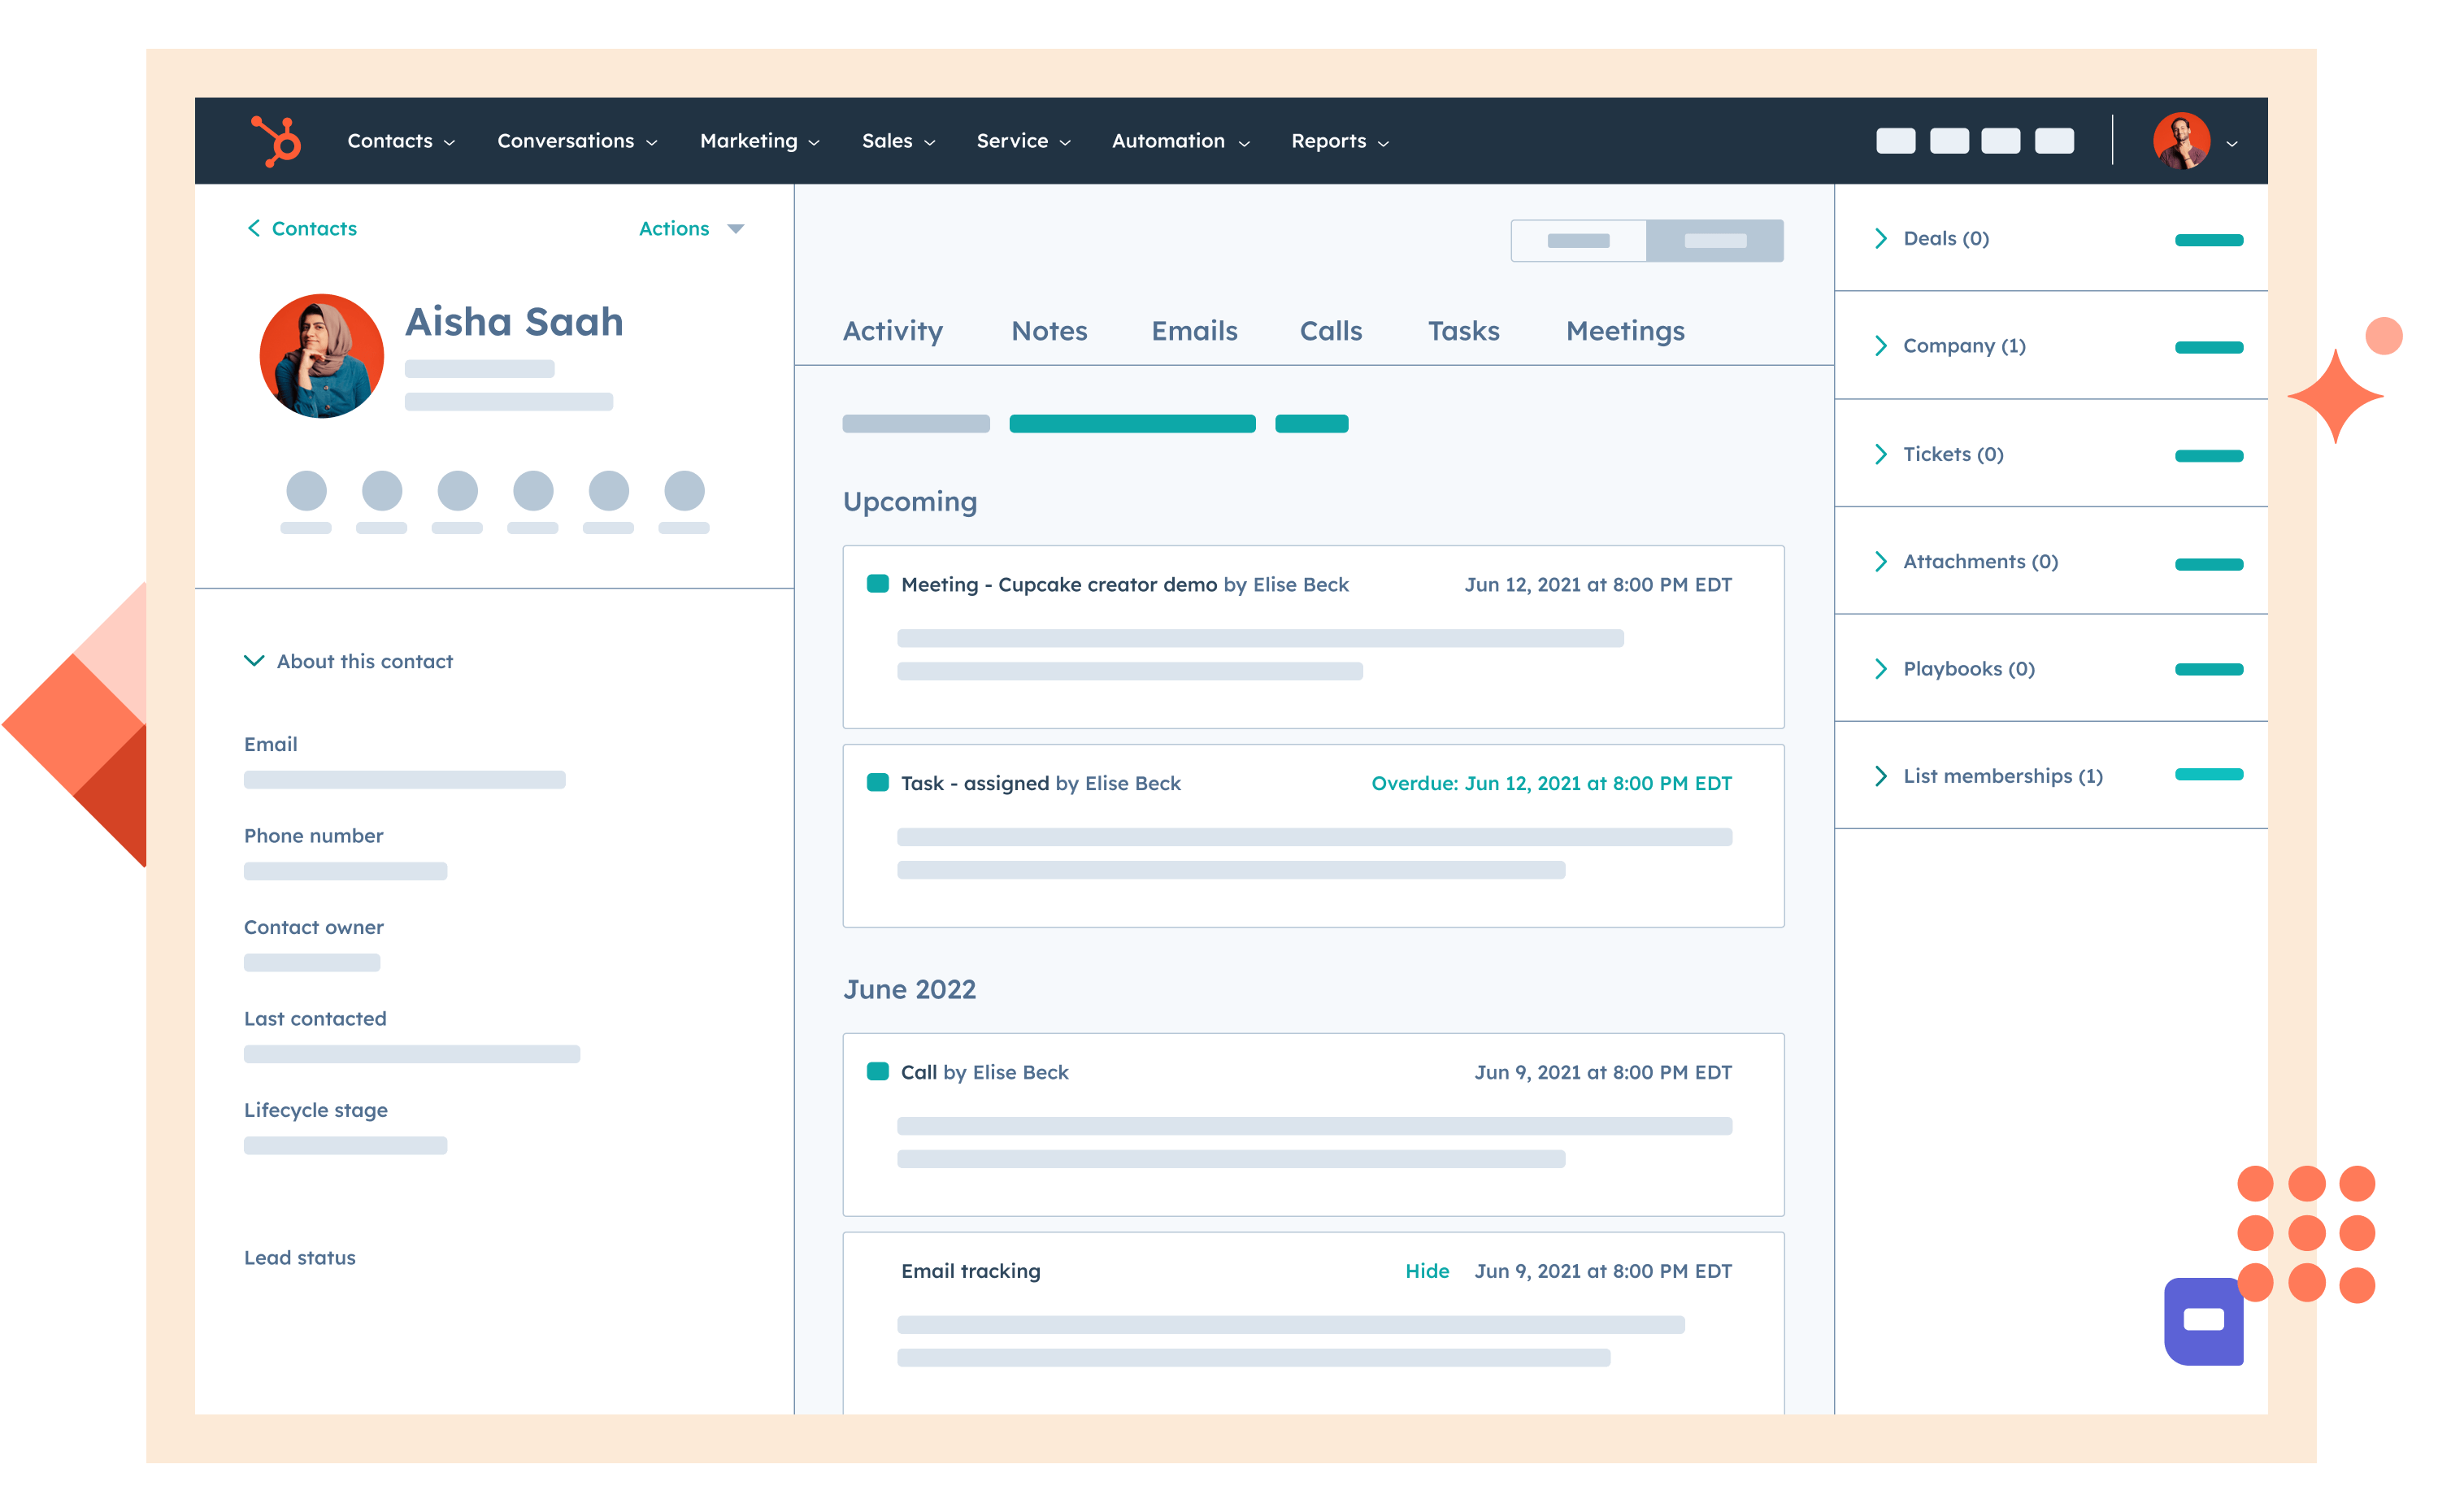
Image source: salesforce.com
Key features
- Visual journey builder to map and automate complex, multi-channel customer paths.
- Einstein AI to predict optimal send times and score content engagement.
- Audience Studio (DMP) for segmenting massive customer databases.
- Real-time interaction management to personalize web and mobile experiences instantly.
- Integrated email, mobile, and social studios for centralized campaign management.
- Datorama integration for unifying marketing data and visualizing ROI.
Pros:
- Unparalleled scalability for global brands.
- Deep integration with the Salesforce ecosystem.
- Highly sophisticated automation capabilities.
Cons:
- Extremely expensive and complex to implement.
- Requires dedicated specialists or consultants to manage.
Why it wins
- Enterprise scalability: It offers the robust infrastructure necessary to handle the massive data volume and complexity of global enterprise brands without faltering.
- CRM synergy: The native integration with the Salesforce CRM creates a seamless, real-time flow of data between sales and marketing teams.
- Omnichannel orchestration: Its ability to orchestrate highly personalized experiences across every channel (email, mobile, web) is unmatched at an enterprise scale.
- AI automation: The built-in AI features automate complex decision-making processes for millions of individual customers, saving thousands of manual hours.
Pricing
Custom enterprise pricing based on the specific modules and editions required. The lowest paid plan is $25/user/month.
Eager to get more features but spend less?
How to choose the right analytics tool for your business
With the explosion of the SaaS market, finding the perfect software can feel overwhelming. The "best" tool is subjective; it depends entirely on your specific needs and technical capacity. Selecting the wrong platform often leads to wasted budget and tools that are paid for but never used. To navigate this process effectively, follow these steps.
Step 1: Define your organizational maturity
Before examining features, assess your team's capabilities. Are you an early-stage startup needing basic traffic stats, or a mature enterprise requiring complex attribution modeling? Be honest about your resources. Implementing enterprise-grade marketing analytics software usually requires a dedicated team of specialists. If you are a small team of generalists, complex tools will likely go unused. Match the tool's complexity to your team's current growth stage to ensure adoption.
Step 2: Check the integration ecosystem
No tool exists in a vacuum. Your new platform must sync seamlessly with your existing tech stack, including your CRM, website, and email providers. The best marketing analytics tools offer native integrations to . For example, if your team uses Lark for collaboration, look for tools that connect via AnyCross or API. This allows you to pipe performance data directly into Lark Base, ensuring your reporting is actionable and accessible where your team actually works.
Step 3: Consider end-user usability
Consider who will actually use the software daily. Is it designed for data scientists writing SQL, or for creative marketers who need visual dashboards? Usability is critical; if a platform is too difficult to navigate, your team will revert to old spreadsheets. When evaluating marketing analytics software tools, prioritize drag-and-drop customization and plain-English reporting. The goal is to democratize data, enabling anyone to find answers without waiting for an analyst.
Step 4: Evaluate privacy and compliance features
With the regulatory landscape shifting, vetting a vendor's approach to data privacy is non-negotiable. Ensure the analytics software for marketing you choose complies with standards like GDPR and CCPA. For industries like healthcare or finance, features like IP anonymization and transparent data storage are legal requirements. Choose a tool that rather than increasing it.
Step 5: Assess the total cost of ownership
Pricing pages can be deceptive. Look beyond the monthly subscription fee to the total cost of ownership. Check for hidden costs regarding additional users, data event limits, or setup fees. Many marketing data analytics tools appear cheap initially, but become expensive as you scale. Meaningful comparison requires looking for transparent pricing models that align with your long-term growth trajectory.
Step 6: Test the support and community
Finally, technology will eventually break or confuse you. When that happens, the quality of the vendor's support is crucial. Look for tools used in marketing analytics that boast active user communities and responsive customer service. A strong community often allows you to troubleshoot common problems quickly without waiting days for a support ticket to be resolved.
Benefits of using marketing analytics tools
Investing in the right software transforms how your organization operates, moving teams from intuition-based decisions to data-backed strategies. This transition to sophisticated marketing analytics tools unlocks critical advantages that drive sustainable growth across every department.
Proven ROI and
The most immediate benefit is moving away from "vanity metrics" like shares and likes toward meaningful revenue indicators. Modern marketing data analytics tools allow you to track the entire funnel, linking ad spend directly to customer acquisition costs and lifetime value. By identifying exactly which channels drive paying customers versus those that burn cash, you can reallocate your budget with surgical precision. This ensures every dollar works harder, significantly improving your overall return on investment.
Speed of decision making
In the digital age, speed is a competitive advantage. Traditional reporting involving manual CSV exports often results in outdated data. Automated analytics tools marketing teams use today eliminate this latency with . If a creative asset is underperforming on a Tuesday morning, you can pause it by the afternoon rather than waiting for a monthly review. This agility allows teams to capitalize on fleeting trends and mitigate risks instantly. In addition, many teams rely on infrastructure like to monitor how ads appear in different regions, detect fraudulent impressions, and ensure campaigns are displayed correctly across networks.
Better customer experience and retention
Analytics helps you keep customers, not just acquire them. By utilizing web marketing analytics tools with features like heatmaps and funnel analysis, you can see your product through the user's eyes. Identifying friction points—like a long checkout form—allows you to proactively optimize the user experience. Furthermore, analyzing behavioral data helps personalize communication, ensuring customers receive relevant messages at the right time.
Predictive capabilities
Implementing advanced marketing analytics tools and techniques allows teams to predict trends rather than just react to them. Sophisticated platforms use historical data and machine learning to forecast seasonal spikes and churn probability. This power enables leaders to set realistic goals and prepare resources in advance, transforming the department from a reactive service center into a proactive strategic partner.
Unified team alignment
When different departments look at different data sets, conflict arises. Online marketing analytics tools serve as a single source of truth to eliminate discrepancies between sales, marketing, and product. When everyone agrees on the numbers, meetings focus on solving business problems rather than arguing over whose spreadsheet is correct. This clarity fosters a culture of transparency where the entire organization aligns around shared KPIs.
Embark on a marketing journey with the superapp Lark
Conclusion
The landscape of marketing technology is vast and constantly evolving, but the ultimate goal remains simple: clarity. In a world saturated with noise, the ability to extract clear, actionable signals from your data is what separates successful brands from the rest. Whether you are tracking website hits, optimizing a sales funnel, or predicting next quarter's revenue, the right marketing analytics toolkit provides the visibility you need to navigate with confidence. However, remember that data collection is only the first step. The real value lies in what you do with that data. Don't just let insights sit in a stagnant dashboard. Use platforms like to bridge the gap between insight and action, making data accessible to the whole team and integrated into your daily workflows. By choosing the right data analytics tools for marketing and fostering a culture of action, you can turn your metrics into a powerful engine for growth.
FAQs
What are marketing analytics tools?
These are software platforms used to measure and analyze campaign performance. While tools like GA4 track metrics well, they often lack collaboration features, creating data silos. Unified platforms that combine data visualization with team communication are increasingly preferred to bridge the gap between insight and action.
What are the 4 types of marketing analytics?
They are Descriptive (what happened), Diagnostic (why), Predictive (future forecasts), and Prescriptive (actions). While complex tools like Tableau visualize these deeply, they often require data analysts. Teams now favor user-friendly interfaces that turn these insights into immediate operational tasks without high technical barriers.
What are the 5 marketing tools?
Key categories are CRM (HubSpot), Analytics (GA4), SEO (Semrush), Social Media, and Email Automation. However, constantly switching between these five logins slows teams down. Consolidating alerts and data from these disparate apps into a single "Superapp" environment significantly streamlines efficiency and response times.
What are the 4 tools of marketing?
This typically refers to the "4 Ps" mix: Product, Price, Place, and Promotion. Managing these requires tight coordination. Relying on static spreadsheets or disconnected email threads often leads to errors, whereas modern platforms that unify database management and team chat offer real-time accuracy.
Do I need SQL to build advanced marketing reports?
Not necessarily. While powerhouses like Tableau offer depth, they demand steep learning curves or SQL skills. Modern no-code database platforms (like Lark Base) offer a user-friendly alternative, empowering non-technical marketers to build custom dashboards and automated workflows without needing engineering support.
Related reading