A complex architecture diagram is only useful if your team can actually find, understand, and act on it. For engineering teams, mapping out a new backend service or visualizing a legacy codebase is a routine requirement. Yet, many teams rely on isolated diagramming tools that trap these vital visualizations away from where daily work actually happens.
If you want to keep your technical documentation accurate and your remote team aligned, you need more than just a digital whiteboard. I will walk you through the top technical diagram software options available right now, and how to choose a tool that integrates your visual planning seamlessly into your team's broader workflows.
What defines technical diagram software?
Not all drawing apps are built the same. While a marketing team might need a basic flowchart tool to map out a customer journey, engineering and product teams require something far more robust. Technical diagram software is specifically designed to handle the complexity of software development, system architecture, and database structuring.
Initially, these tools need to support standardized visual languages. You should be able to easily create UML (Unified Modeling Language) diagrams, Entity-Relationship (ER) diagrams, and network topology maps. Second, technical diagramming often requires specialized inputs. Many software architects prefer text-to-diagram or code-to-diagram functionality—like Mermaid syntax—which allows them to generate complex charts without ever touching a mouse.
Finally, a true When you are building a software technical architecture diagram, the system is going to evolve. The software must support version control or dynamic embedding, ensuring that when the architecture changes, the diagram reflects those updates automatically across all your wikis and documentation.
Key features to look for in architecture diagram tools
When you are evaluating technical diagram software for your engineering team, checking the feature list against your actual daily habits and existing is crucial. A tool with a steep learning curve and massive feature bloat might impress on paper, but if your developers refuse to use it, it becomes a wasted expense.
Here are the critical features to prioritize:
- Developer-friendly inputs: Look for tools that allow keyboard-driven creation or support for Markdown-like syntax. Developers often find it faster to type out the structure of a diagram than to drag and drop dozens of tiny boxes.
- Dynamic embedding: If your diagram lives entirely inside its own app, it is already outdated. You need the ability to embed live, updating versions of your diagrams directly into your .
- Real-time collaboration: If you are managing a remote or hybrid team, are not always enough. You need tools that allow multiple architects to view and edit the same canvas simultaneously during a video meeting, complete with live cursors, commenting, and integrated .
Consider a brief scenario: Your team is planning a server migration. Instead of sharing a static PNG file in a chat thread—which gets lost after ten minutes of conversation—you embed the live architecture diagram into your project management document. When the database team spots an error and updates the map, the change is instantly visible to everyone reviewing the document.
Why standard flowchart apps fail engineering teams
Many growing organizations make the mistake of buying one generic . While standard apps are great for plotting out a basic HR onboarding process, they quickly fall apart under the weight of engineering needs.
The primary point of failure is the creation of knowledge silos. When you use a disconnected flowchart app, your workflow becomes deeply fragmented. A developer might spot an issue in the code, message the team in a chat app, open a separate project management tool to log the ticket, and then log into a third, completely isolated app to update the system map. This heavy context-switching creates friction, making it less likely that the documentation will ever be updated.
Furthermore, standard apps struggle with the sheer density of technical data. When you try to map out a large-scale microservices architecture in a basic tool, the canvas often becomes an unreadable web of overlapping lines. Engineering teams need software that can group, collapse, and link distinct layers of architecture logically, rather than just offering an infinite, messy whiteboard.
Tired of losing critical architecture diagrams in chat threads
Visualizing a technical debt vs software bugs diagram
Understanding the difference between long-term technical debt and immediate software bugs is notoriously difficult for non-technical stakeholders. A software technical debt diagram helps bridge this gap by mapping out structural codebase issues alongside isolated node fixes. Bugs are typically localized problems that require immediate patching, whereas technical debt represents systemic architectural shortcuts that require planned refactoring over time.
By visualizing these elements together, engineering leads can clearly demonstrate to product managers why certain features are delayed. You can show exactly how a cluster of bugs is actually a symptom of a larger, underlying technical debt node. Connecting this visual representation directly to your team's goal/OKR tracking ensures that refactoring efforts receive the proper resources and prioritization during sprint planning.
Top technical diagram software to consider
Before diving into the detailed reviews, here is a quick comparison of the top five technical diagram software options available right now to help you map your technical debt vs software bugs diagram.
1. Lark: The all-in-one unified workspace for embedded diagrams
The verdict: Lark stands out as an all-in-one productivity powerhouse, providing users with a unified platform to manage projects effectively. It is the best choice for remote and hybrid teams struggling with fragmented tool stacks who need their technical diagrams to live right alongside their daily communication and documentation.
is an AI-powered work management platform that gives teams the project management capabilities they expect from traditional tools, with built-in communication and collaboration that reduces friction and keeps work moving. Instead of creating system architectures in a siloed app, engineering teams can embed their visual assets directly into cloud-native documents where cross-functional alignment actually happens.
Deep dive
Centralized documentation for technical software architecture
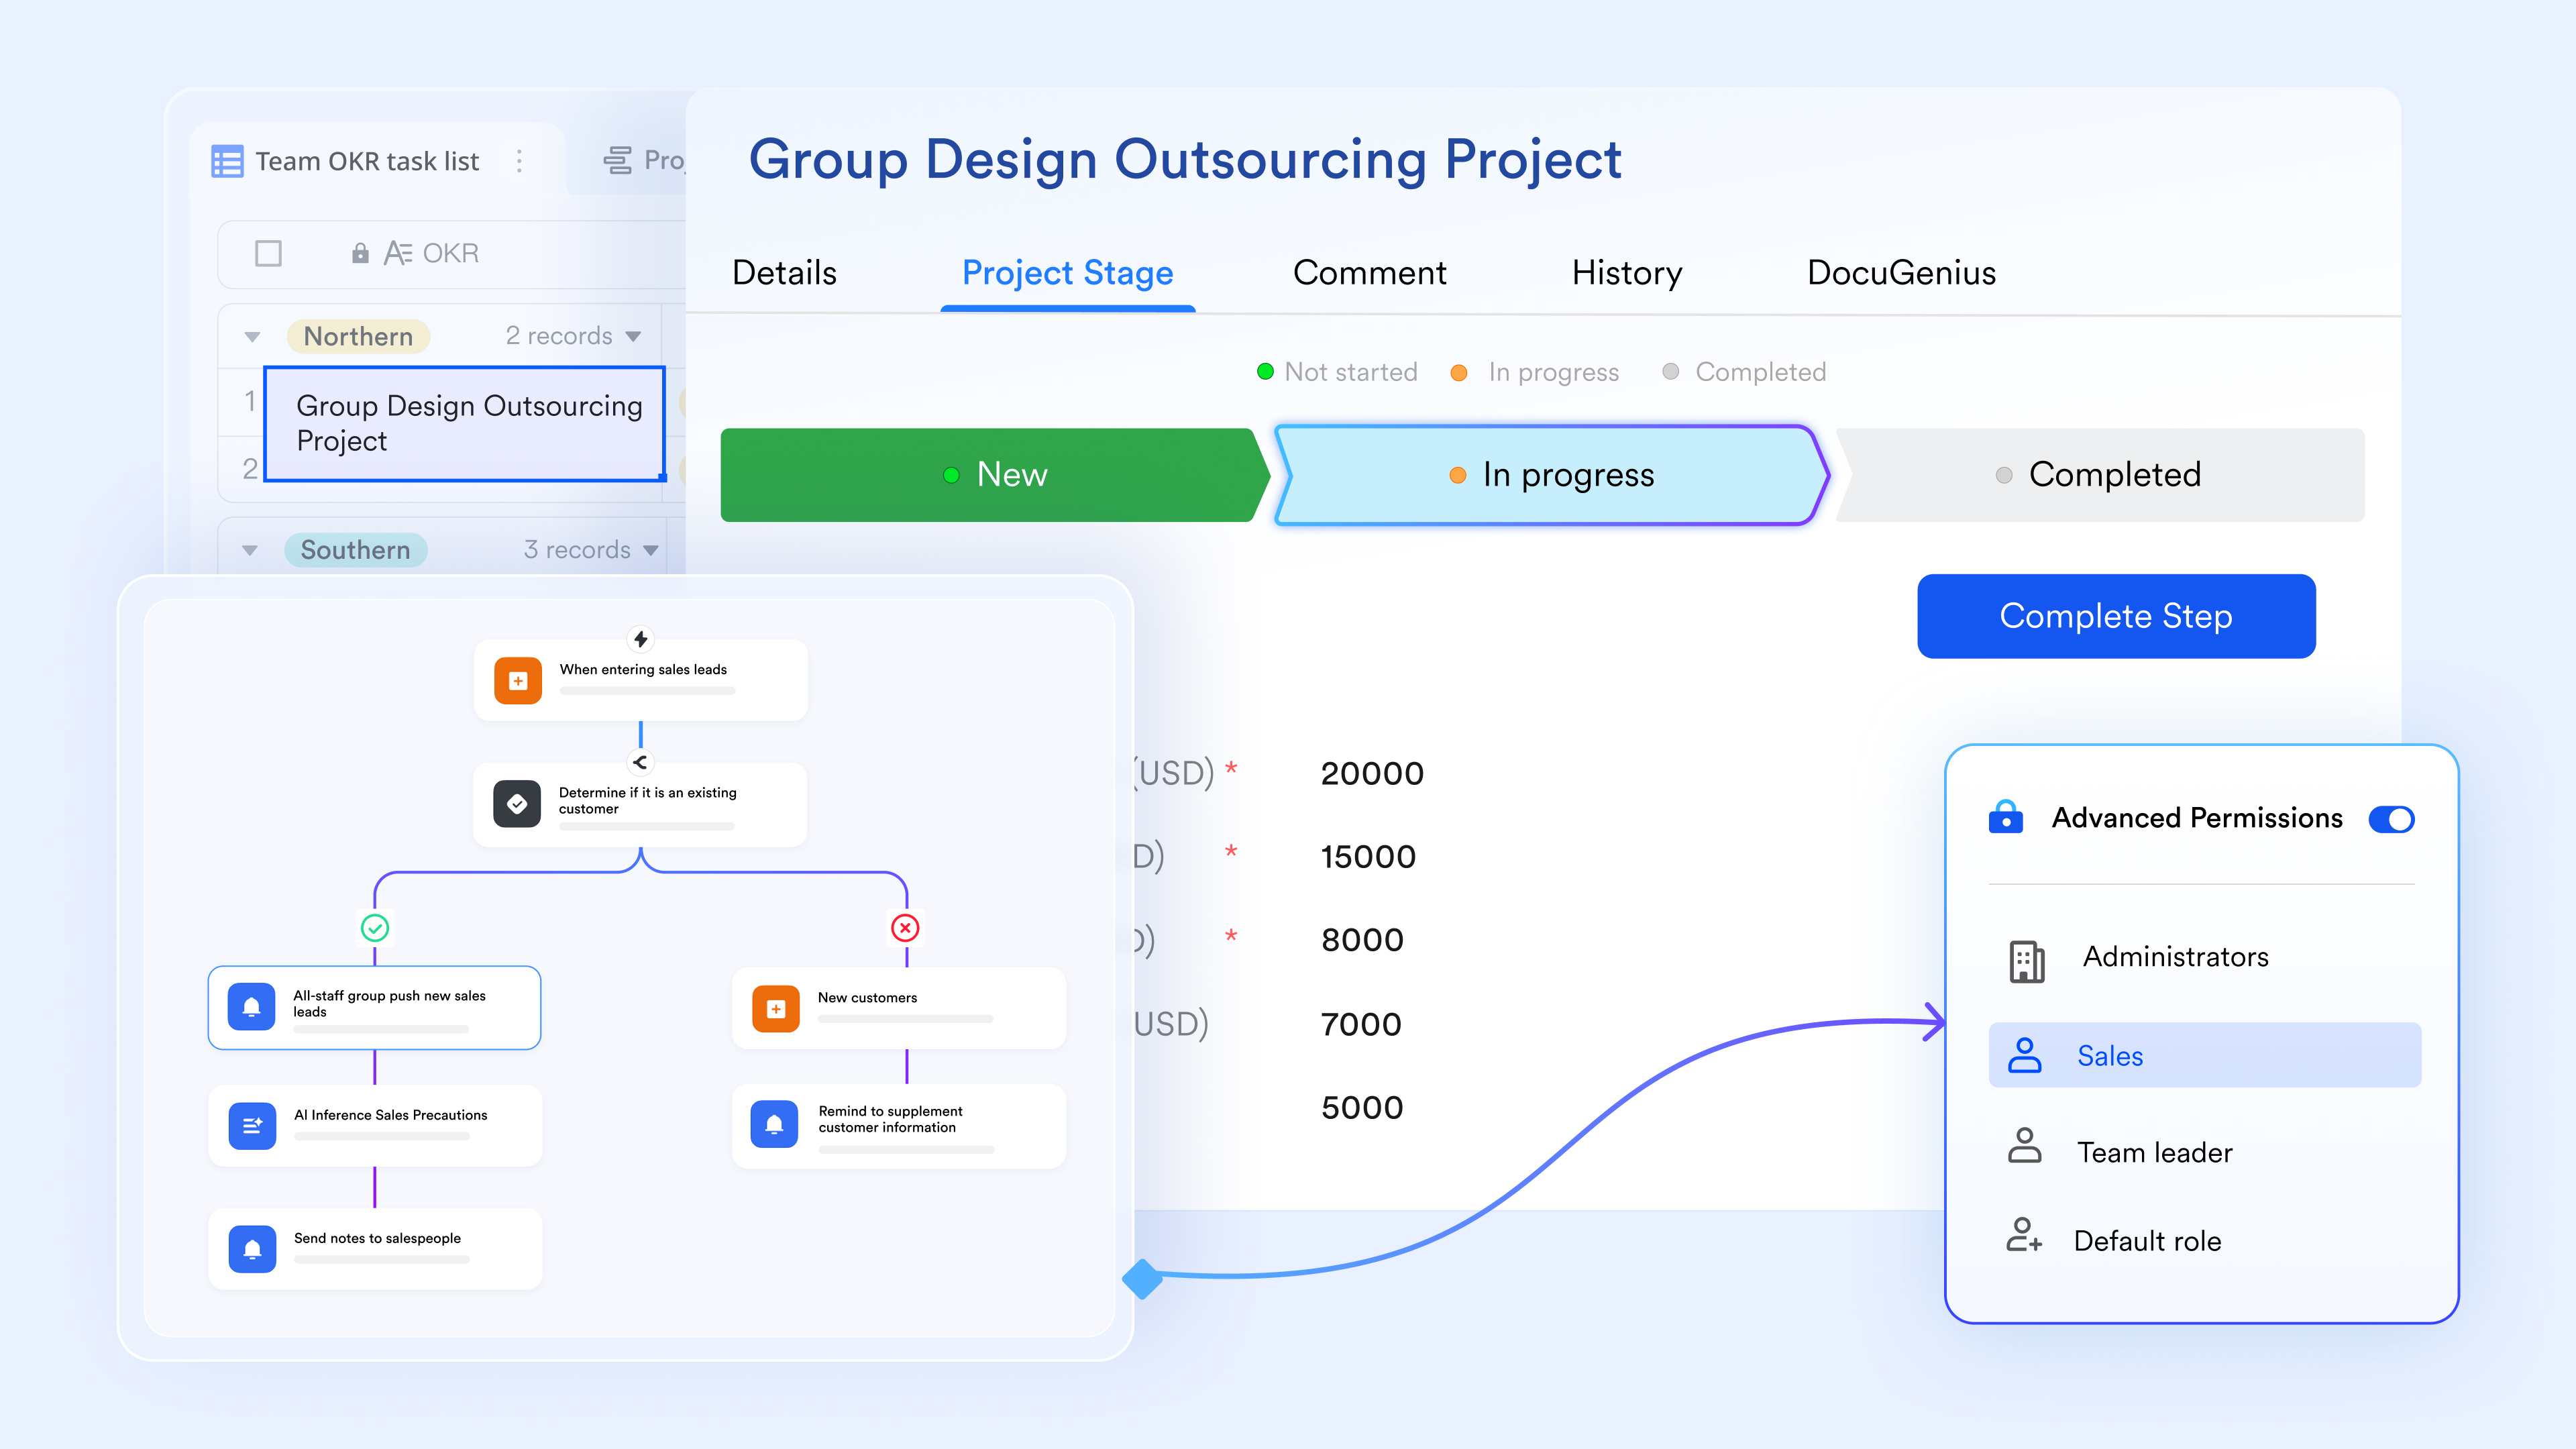
With , your team can embed live, updating technical diagrams directly into your internal wikis and project plans. This ensures that when an architecture map updates, the corresponding context and discussion remain attached to it.

Database tracking for technical debt vs software bugs
Use to connect visual elements of your technical debt diagram to actual database records. You can assign owners and deadlines to specific refactoring tasks, making abstract architectural issues actionable.
Automated triggers for deployment processes
Transform diagrammed processes into actual operational steps by integrating them with . This guarantees that architectural changes pass through the right engineering leads before any code reaches production.

Built-in communication for remote alignment
Discuss complex software technical architecture diagrams over integrated video meetings and chat groups without ever leaving the workspace. This reduces context switching and keeps the entire engineering department on the same page.

Pros
- Consolidates multiple specialized apps into one cost-effective subscription
- Offers a robust free plan that supports up to 20 users with generous storage
- Keeps diagrams directly connected to real-time chat and documentation
Cons
- The platform is incredibly feature-rich and may present a slight learning curve initially. However, the interface is highly user-friendly, and there are abundant tutorials in the and on YouTube to guarantee a quick onboarding experience.
- Teams deeply entrenched in legacy enterprise software might need dedicated time to migrate their existing wikis over to the unified platform.
:
- Starter plan: Free forever plan that includes 11 powerful tools for up to 20 users. It also comes with 100GB of storage, 1000 automation runs, AI translations, and more.
- Pro plan: $12/user/month (billed annually) for up to 500 users. It includes everything in Starter plus group calling for up to 500 attendees, 15TB of storage, 50,000 automation runs, and more.
- Enterprise plan: for custom pricing. Supports unlimited users and includes additional automation runs, as well as advanced security, compliance, and management features.
For small teams with simple communication needs

18 months message history
1000 Base automation runs/month
2000 rows per table in Base
Most POPULAR
For companies with comprehensive collaboration and management needs
Unlimited message history
500-participant video meetings
50k Base automation runs/month
20k rows per table in Base
For large companies with advanced security and organizational management needs
Get a personalized demo and pricing
Unlimited message history
500-participant video meetings
15 TB storage + 30 GB storage/user
500k Base automation runs/month
50k Base automation runs/month
Most POPULAR
For companies with comprehensive collaboration and management needs
Unlimited message history
500-participant video meetings
50k Base automation runs/month
20k rows per table in Base
2. Lucidchart: Advanced diagramming for complex systems
The verdict: Lucidchart is best for specialized system architects who need deep, native integrations with cloud infrastructure providers. It excels at mapping out complex network topologies and database schemas with precision.
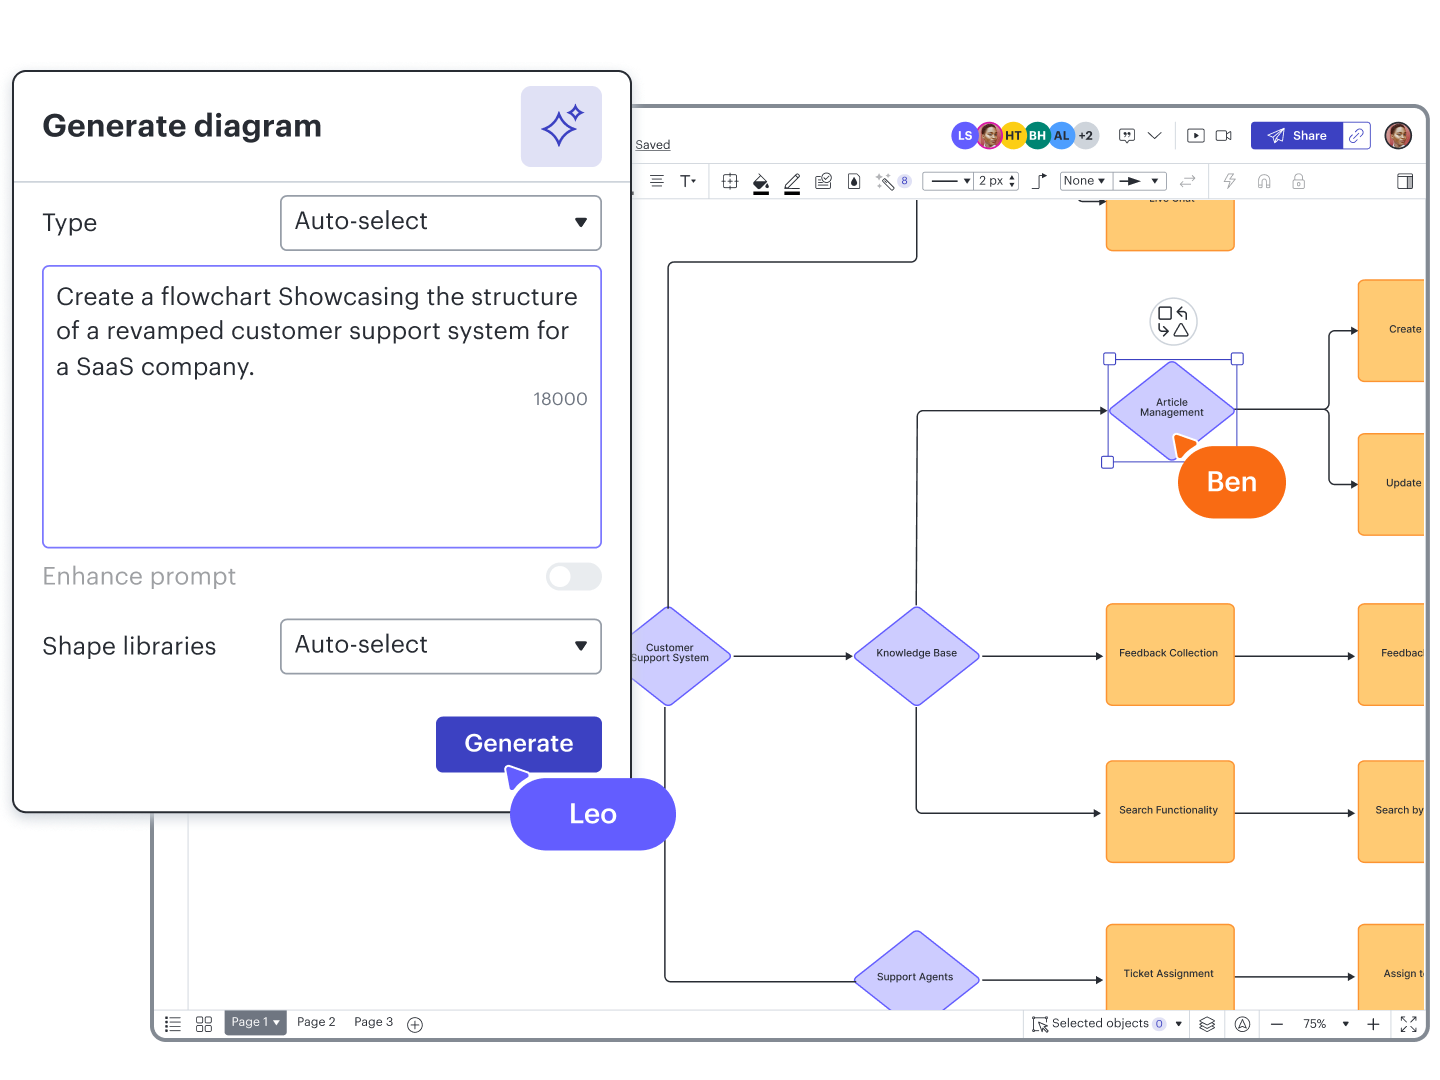
Image source: lucidchart.com
Deep dive
Lucidchart provides an expansive canvas for mapping out intricate software technical architecture diagrams. It offers a rich library of templates specific to engineering needs, including UML and AWS architecture shapes. The interface allows for real-time collaboration, meaning multiple developers can map out a server migration simultaneously.
The platform relies heavily on its ability to pull data directly from existing infrastructure, which helps in automating the creation of certain architectural maps. While highly capable, it remains a dedicated diagramming tool, meaning the diagrams must still be exported or integrated into your actual communication stack.
Pros
- Provides extensive shape libraries for standardized technical diagramming
- Integrates deeply with popular cloud service providers like AWS and Azure
- Features AI capabilities to assist in generating rapid visual structures
Cons
- Requires a separate paid subscription just for diagramming capabilities
- Can feel overwhelming for non-technical users who just need simple flowcharting
Pricing
- Free plan: Basic features for single users.
- Individual: $7.95/user/month.
- Enterprise: Contact sales.
3. FigJam: AI-powered collaborative diagramming
The verdict: FigJam is best for design and product teams looking to brainstorm visually alongside engineering concepts. It stands out for its highly collaborative environment and recent AI flowchart generation features.
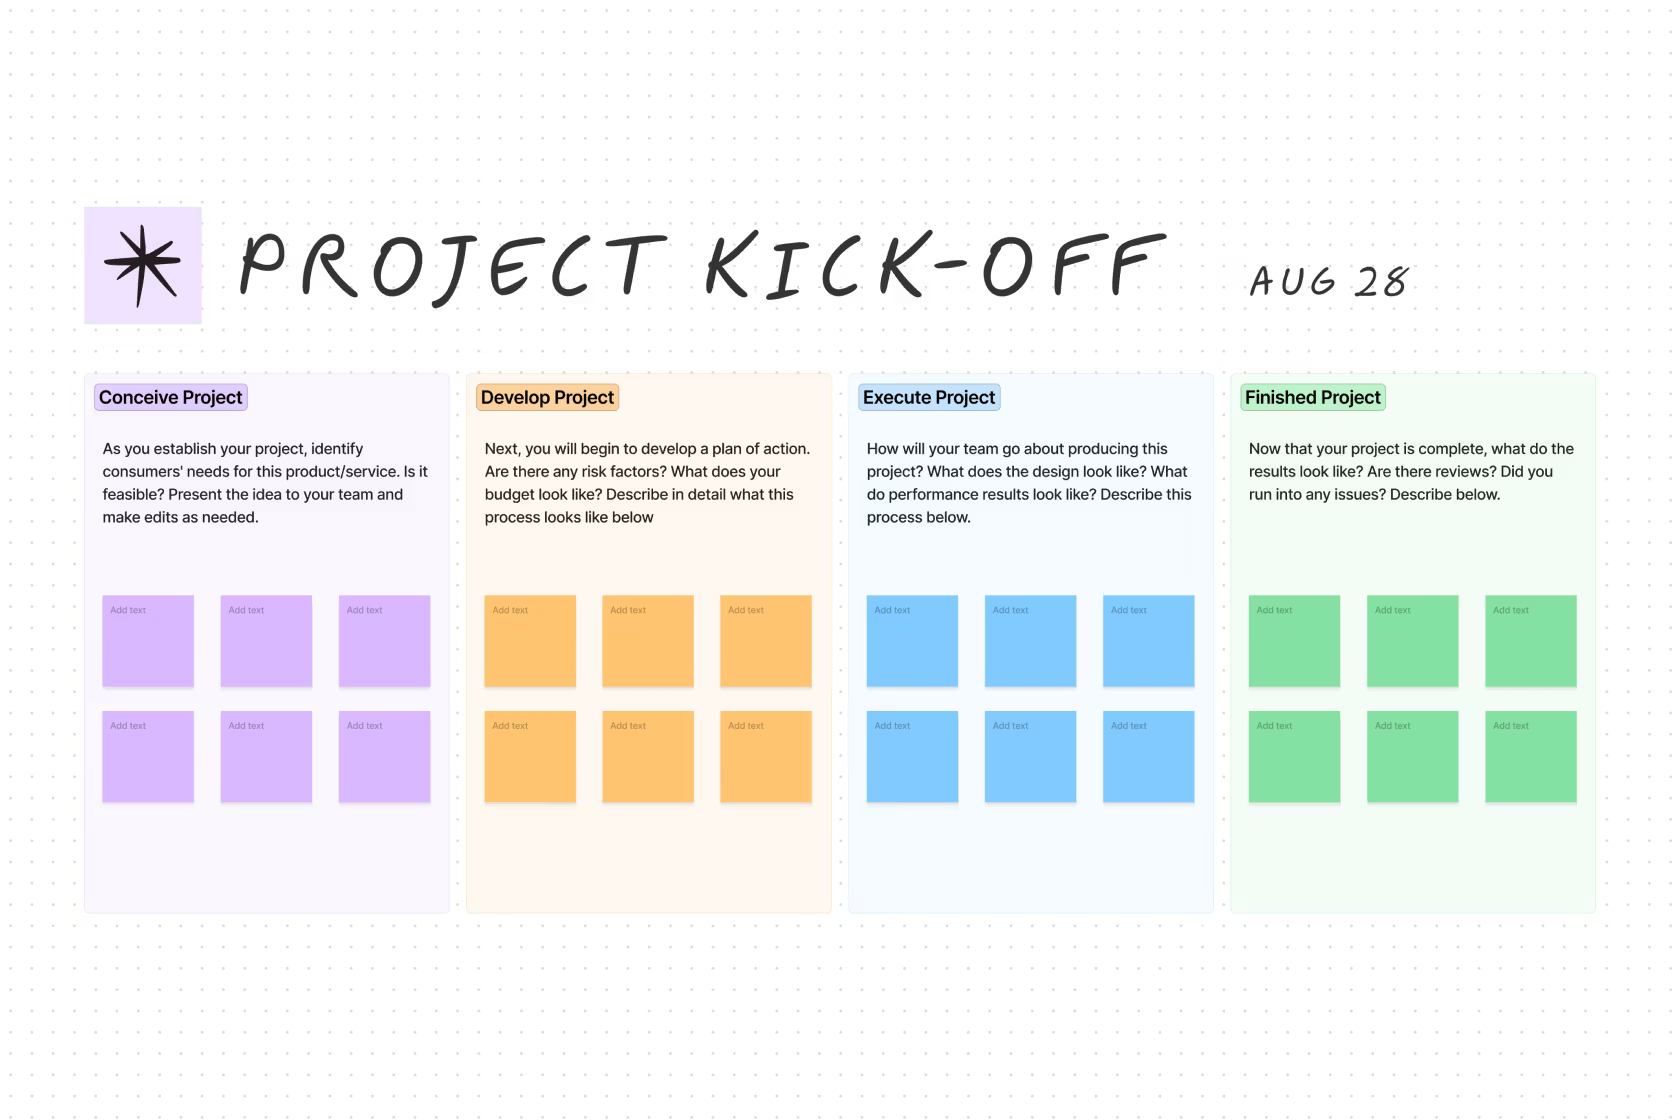
Image source: figjam.com
Deep dive
FigJam operates as a digital whiteboard that encourages free-flowing ideas. It is particularly useful when discussing a software technical debt diagram during sprint retrospectives. Teams can use sticky notes, voting widgets, and drawing tools to map out user flows and basic architectures.
While it is excellent for early-stage planning and team alignment, it does have limitations when handling highly complex, multi-layered technical diagrams compared to dedicated architectural software.
Pros
- Offers AI-powered flowchart generation to speed up the drafting process
- Integrates perfectly with Figma for teams already using that design ecosystem
- Provides a highly engaging and intuitive interface for non-technical stakeholders
Cons
- Struggles to maintain organization when dealing with massive system architectures
- Lacks the strict standardization required for formal UML documentation
Pricing
- Starter: Free for 3 active boards.
- Professional: $3/user/month (billed annually).
- Organization: $5/user/month (billed annually).
4. Zapier Canvas: Business process diagramming
The verdict: Zapier Canvas is best for operations and automation teams who need to visualize workflows before they build them. It stands out by connecting static diagrams directly to functional automation paths.
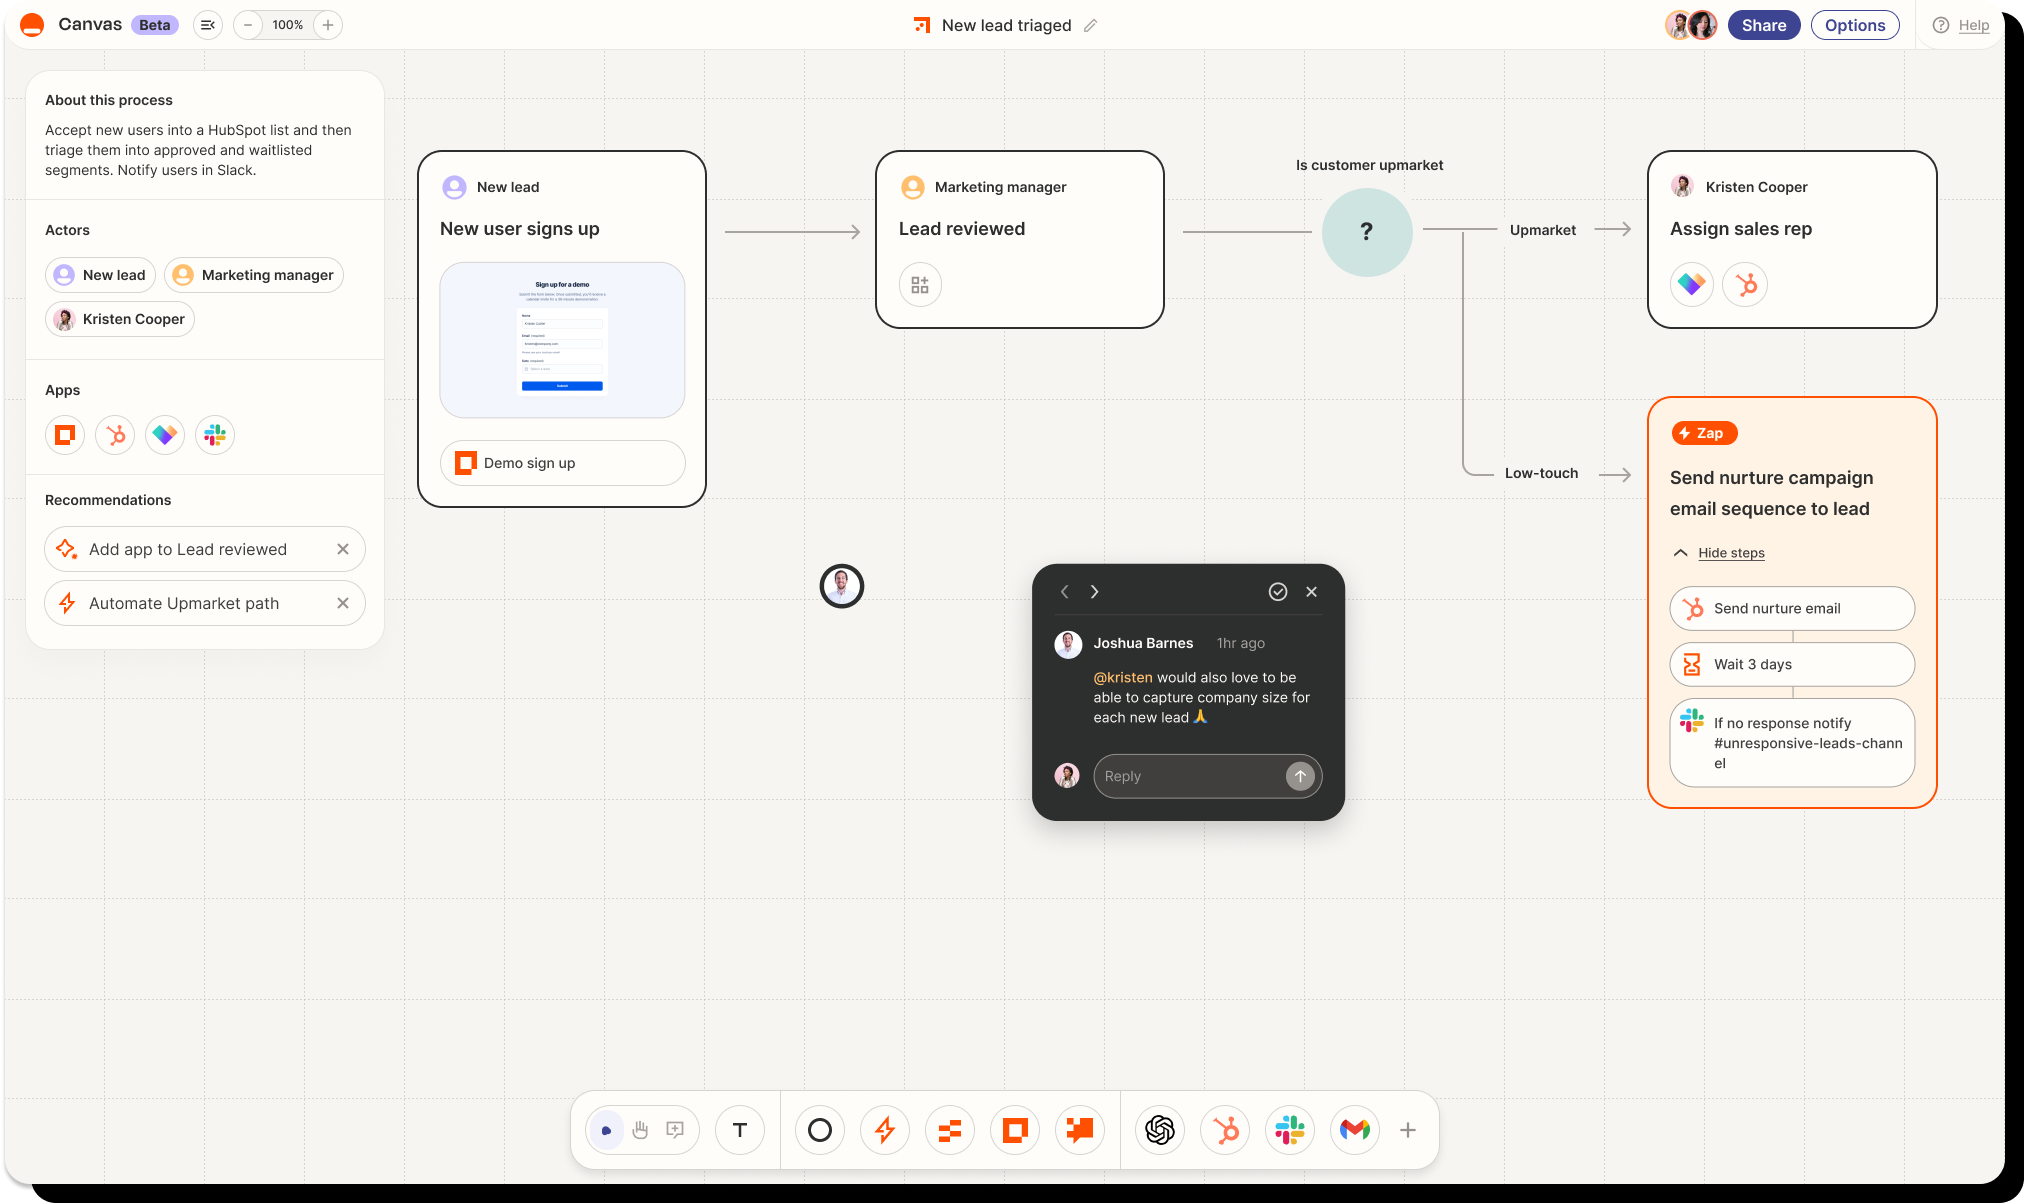
Image source: zapier.com
Deep dive
Zapier Canvas allows users to map out their business processes and technical workflows with an intuitive interface. It bridges the gap between planning and execution by allowing users to transition a visual diagram straight into an active Zapier automation.
This tool is highly effective for teams looking to eliminate manual tasks. However, it is heavily geared toward workflow automation rather than deep software architecture mapping or database schema design.
Pros
- Connects visual planning directly to active software automations
- Simplifies the process of mapping out complex API triggers and actions
- Offers a clean, modern interface that is easy to adopt
Cons
- Not suited for traditional software architecture or network topology diagrams
- Requires reliance on the broader Zapier ecosystem to maximize its value
Pricing
- Free plan: Available with basic features.
- Paid plans: Tied to Zapier subscription tiers (starting around $19.99/month for the whole platform).
5. SmartDraw: Quick diagram creation
The verdict: SmartDraw is best for professionals who need to generate professional-grade diagrams rapidly without worrying about manual formatting. It stands out for its intelligent formatting engine.
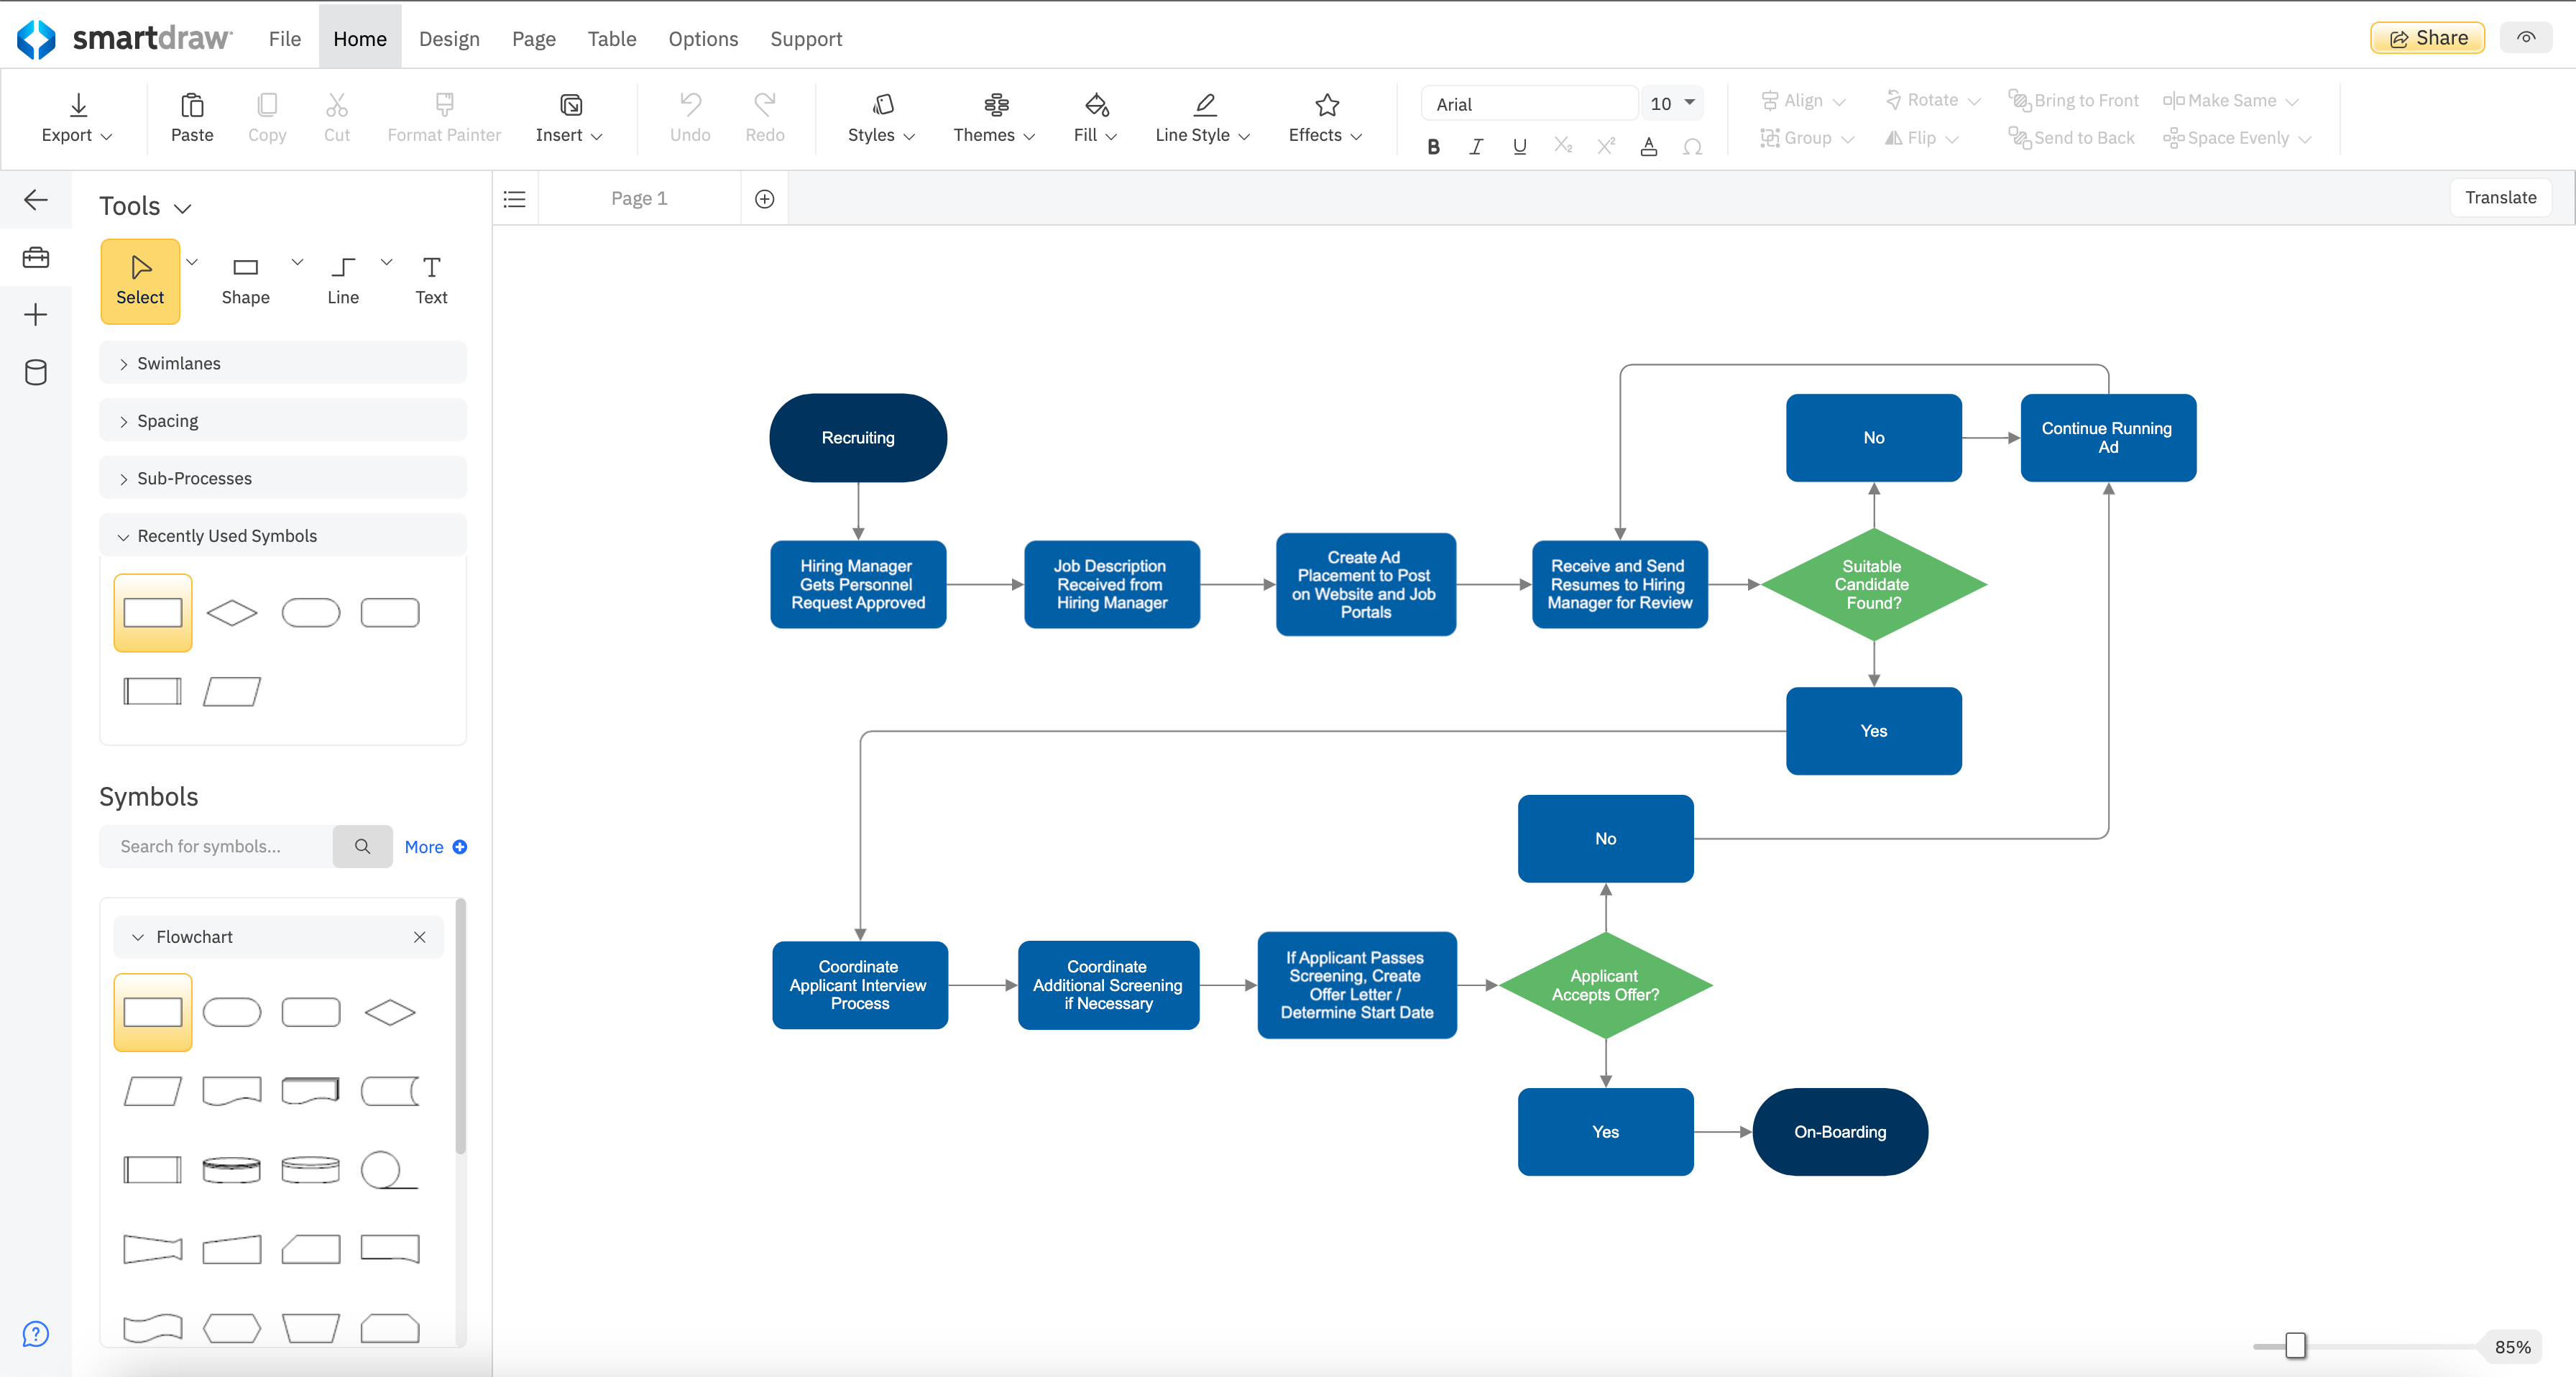
Image source: smartdraw.com
Deep dive
SmartDraw automates much of the tedious work associated with building a technical diagram. As you add shapes and nodes, the software automatically aligns and spaces them perfectly. This makes it an excellent choice for creating a clean software technical debt diagram in minutes.
The software includes thousands of templates across various industries. While it is powerful, the interface can feel slightly dated compared to modern web-first collaborative whiteboards.
Pros
- Automates shape alignment and line routing to save formatting time
- Includes a massive library of templates for almost any technical use case
- Integrates well with Microsoft Office and Google Workspace
Cons
- The user interface is less modern than newer collaborative tools
- Real-time collaboration features are not as smooth as cloud-native competitors
Pricing
- Individual: $9.95/user/month (billed annually).
- Team: $8.25/user/month (billed annually).
6. EdrawMax: AI-assisted diagramming with presentation tools
The verdict: EdrawMax is best for managers and consultants who need to present complex technical information to executives. It stands out for its AI-assisted functionality and deep PowerPoint integration.
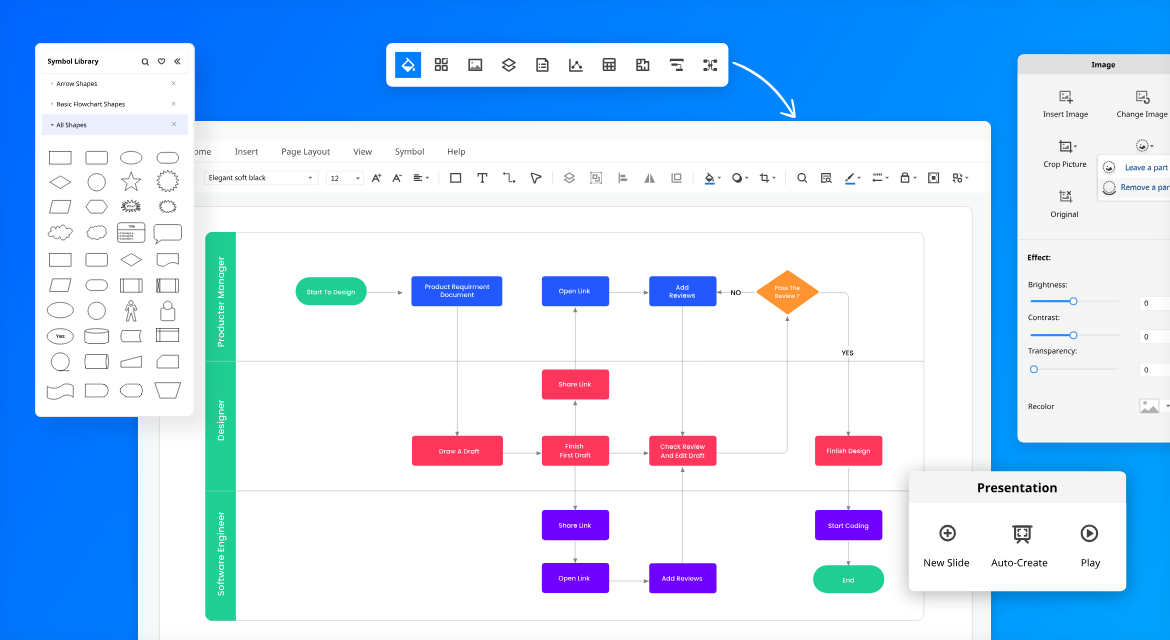
Image source: edrawmax.com
Deep dive
EdrawMax offers a versatile platform for creating everything from floor plans to complex software technical architecture diagrams. It recently introduced AI features that help generate basic diagram structures based on text prompts, reducing the initial setup time.
The software is particularly strong when it comes to exporting and presenting. Users can easily convert their massive diagrams into multi-slide presentations. However, it can be resource-heavy when used as a desktop application.
Pros
- Features AI tools to assist with rapid diagram generation
- Offers robust export options, particularly for Microsoft PowerPoint
- Supports both cloud-based collaboration and a fully offline desktop app
Cons
- The sheer volume of features can make the tool feel cluttered
- Pricing models can be confusing, with varying subscription and lifetime options
Pricing
- Subscription: $99/user/year.
- Lifetime plan: $198 (one-time payment).
- Team plan: $119/user/year.
7. Draw.io: Free and focused offline diagramming
The verdict: Draw.io is best for teams that need a free, open-source solution for creating quick technical diagrams without relying on cloud-based subscriptions. It stands out for its simplicity and offline capabilities.
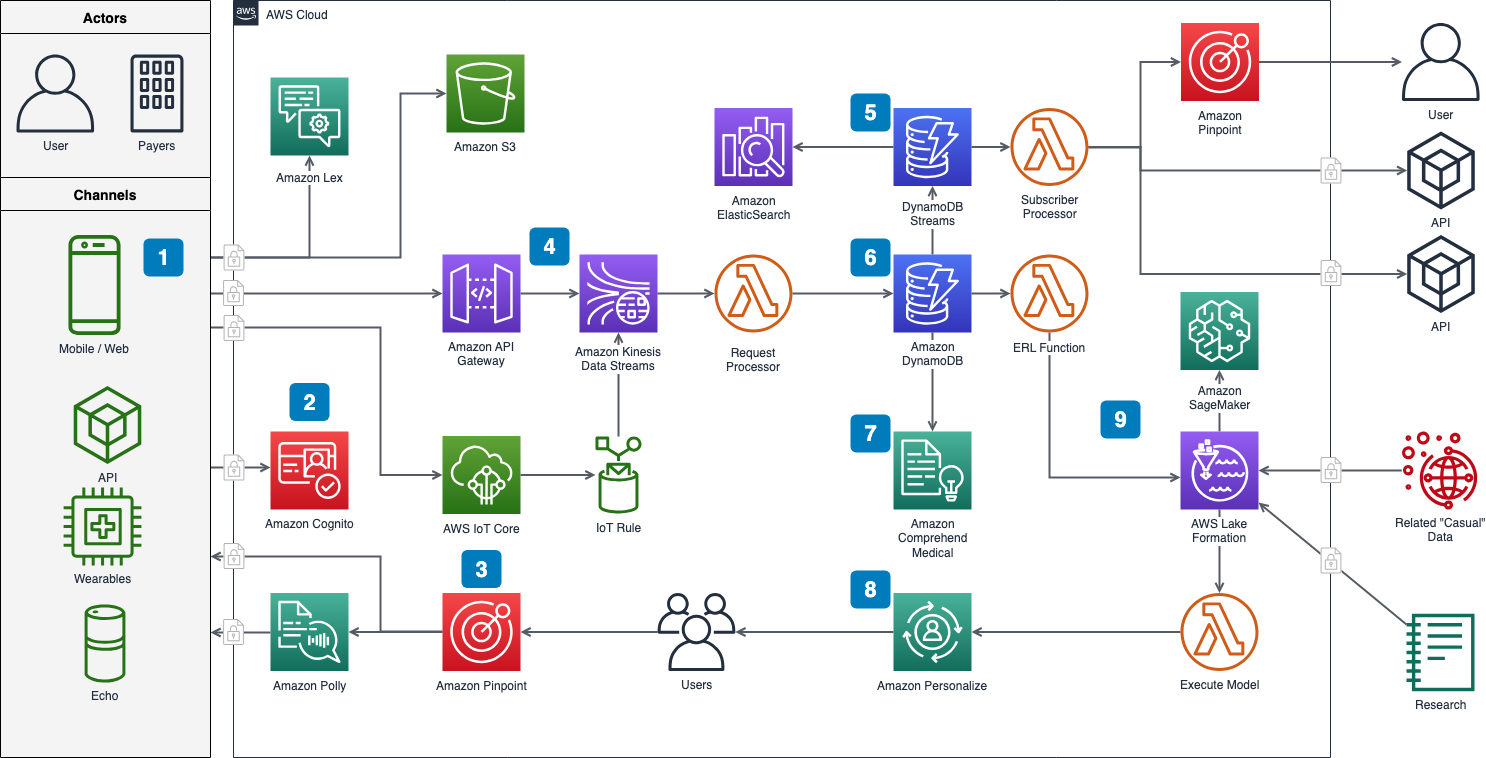
Image source: drawio.com
Deep dive
Draw.io offers a straightforward environment for creating detailed software technical architecture diagrams. Because it can be used entirely offline or integrated directly into tools like GitHub, developers appreciate its respect for data privacy and security.
The tool does not force users to create accounts, allowing for rapid deployment across an engineering department. However, it lacks native real-time collaboration features on its own.
Pros
- Completely free to use with no hidden subscription fees
- Functions seamlessly offline for high-security environments
- Saves files directly to local storage or preferred cloud drives
Cons
- Lacks native real-time collaboration without relying on third-party integrations
- The interface feels rigid compared to modern digital whiteboarding tools
Pricing
- Free: Completely free for core usage.
- Paid integrations (e.g., for Atlassian products) vary by user count.
8. Mermaid: Text-based chart generation for developers
The verdict: Mermaid is best for developers who prefer to generate technical diagrams using markdown-inspired text syntax. It stands out by treating diagrams as code, making version control effortless.
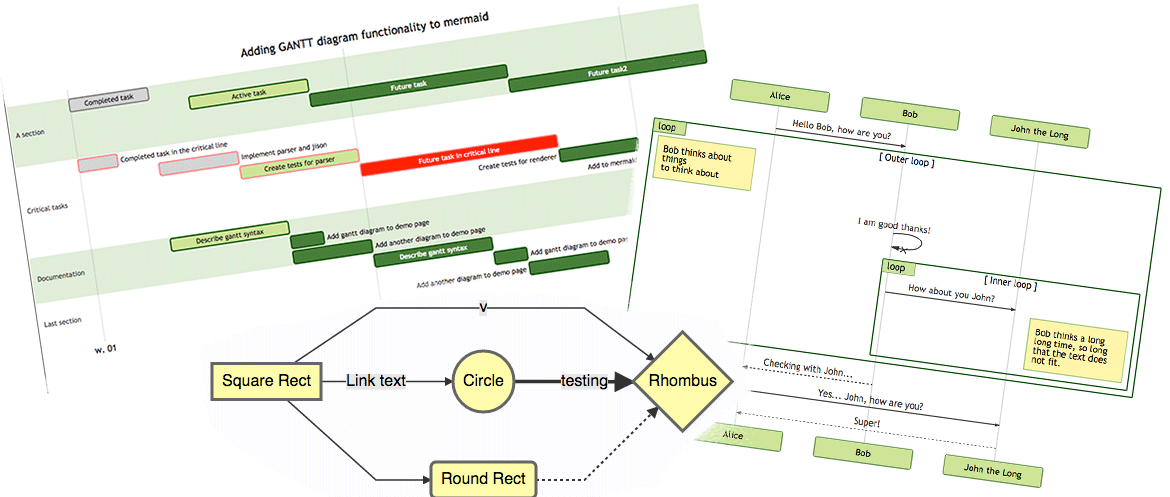
Image source: mermaid.com
Deep dive
Mermaid allows engineers to render complex flowcharts and sequence diagrams using simple text definitions. This means your software technical debt diagram can live right inside your codebase repository as a markdown file, updating visually whenever the code is pushed.
Because it relies on text inputs rather than drag-and-drop mechanics, it integrates perfectly into existing developer workflows. It eliminates the need for manual layout adjustments, though it requires users to learn its specific syntax.
Pros
- Allows diagrams to be treated as code for perfect version control alignment
- Eliminates time wasted on manual shape formatting and canvas alignment
- Integrates natively into markdown files and major developer repositories
Cons
- Requires learning a specific markdown-like syntax to generate visuals
- Offers very limited customization for colors, branding, and shape styling
Pricing
- Free: Open-source and free to use.
- Plus: CN¥35 per user/month
- Premium: CN¥70 per user/month
- Enterprise: Custom pricing
How to embed software architecture diagrams into agile workflows
Keeping your visual documentation actionable means connecting it directly to your agile ceremonies. Start by embedding your software technical into your main project wiki. During sprint planning, use the diagram to identify dependencies before assigning tickets. If a specific node on the architecture map represents a high-priority technical debt issue, link that node directly to your structured database or issue tracker.
By doing this, whenever an engineer updates the status of a bug fix, the corresponding section of the architecture wiki reflects that progress. This turns a static image into an operational dashboard, ensuring that remote teams stay aligned without needing constant status update meetings.
Bring your technical debt and sprint planning into perfect alignment
Conclusion
Choosing the right technical diagram software comes down to how your team actually communicates. If you rely on isolated flowchart apps, your documentation will likely become outdated the moment it is exported. To keep engineering teams aligned and processes moving efficiently, prioritize tools that embed your system architecture and technical debt diagrams directly into your unified workspace. Experience seamless collaboration and streamlined project management by choosing —your all-in-one platform for real-time teamwork and productivity.
FAQs
What is the best free tool for technical diagrams?
Draw.io is generally considered the best free tool for technical diagrams due to its comprehensive shape libraries, offline capabilities, and lack of mandatory subscriptions. For text-based generation, Mermaid is the top open-source choice.
How do I visualize technical debt effectively?
Visualize technical debt by mapping out your current system architecture and color-coding or highlighting nodes that require structural refactoring. Distinguish these nodes from temporary bug fixes to clarify resource needs for non-technical stakeholders.
Can I generate technical diagrams from code?
Yes, tools like Mermaid allow you to generate charts and diagrams using a Markdown-inspired text syntax. This allows developers to treat diagrams as code, ensuring they are easily updated and version-controlled alongside the actual software.
Related reading