AI Dashboard: Visualize, Analyze & Optimize Your Data Base with AI

Alex Miller

Technical Product Marketing Specialist

Aug 5, 2026

Alex Miller

Technical Product Marketing Specialist

Aug 5, 2026

Try Lark for free
15 min read
Static reports are falling behind the speed of modern business. An AI dashboard changes the equation — using machine learning, natural language, and automation to surface meaningful insights instead of just displaying charts. Unlike traditional BI tools that require days of engineering, modern AI dashboard builder can generate AI analytics dashboard from raw data in minutes. In this guide, we'll show you how an AI dashboard works, how to implement your AI dashboard, and how teams use them to drive faster decisions.
Executive summary: AI dashboards
  • The paradigm shift: AI dashboards automate data prep and chart selection, replacing static BI with predictive analytics, NLP conversational queries, and real-time anomaly detection.
  • Lark-driven workflows: Integrating dashboards into Lark (Base, Docs, Messenger) embeds insights directly into daily operations, turning static charts into active platforms that trigger team workflows and alerts.
  • Key pitfalls: Organizations must secure underlying data quality, establish governed semantic layers to align metric definitions, and maintain human-in-the-loop validation to prevent hallucinated AI outputs.

Understanding dashboard AI: Beyond traditional BI to AI analytics dashboard intelligence
Traditional business intelligence (BI) dashboards have been around for quite some time, providing valuable insights into historical data. However, they often fall short in several key areas. They typically require manual data aggregation, rely on predefined metrics, and offer limited predictive capabilities. They reflect what has happened, not necessarily what will happen.
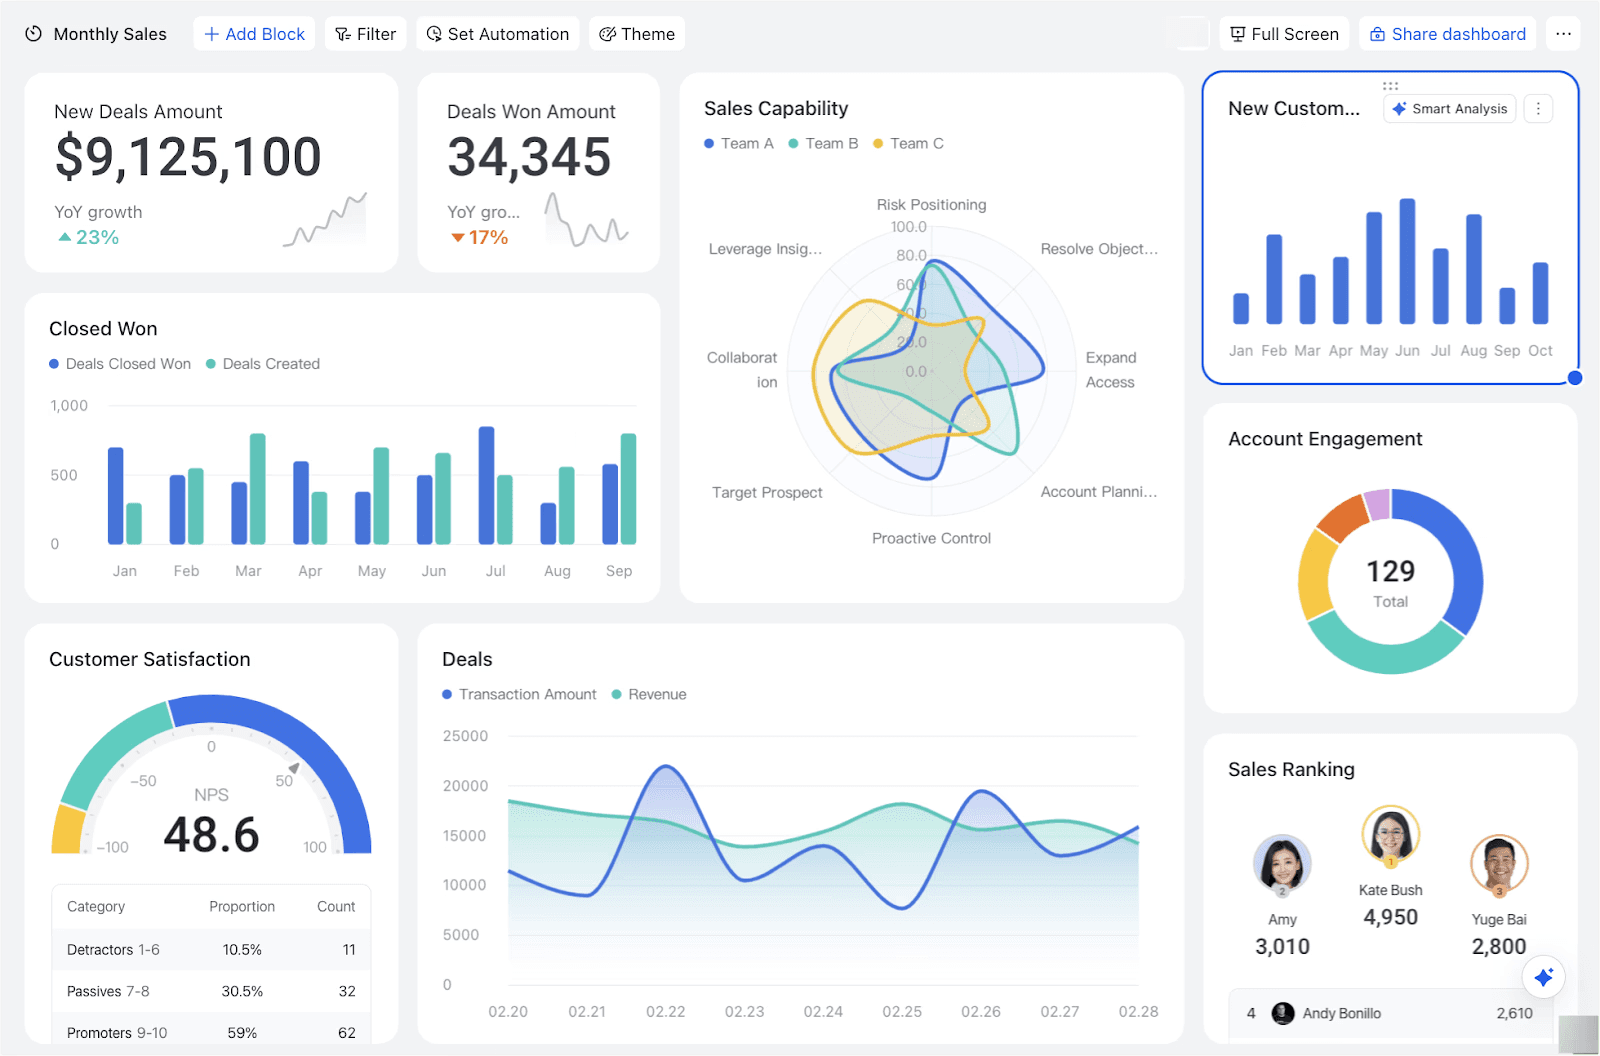
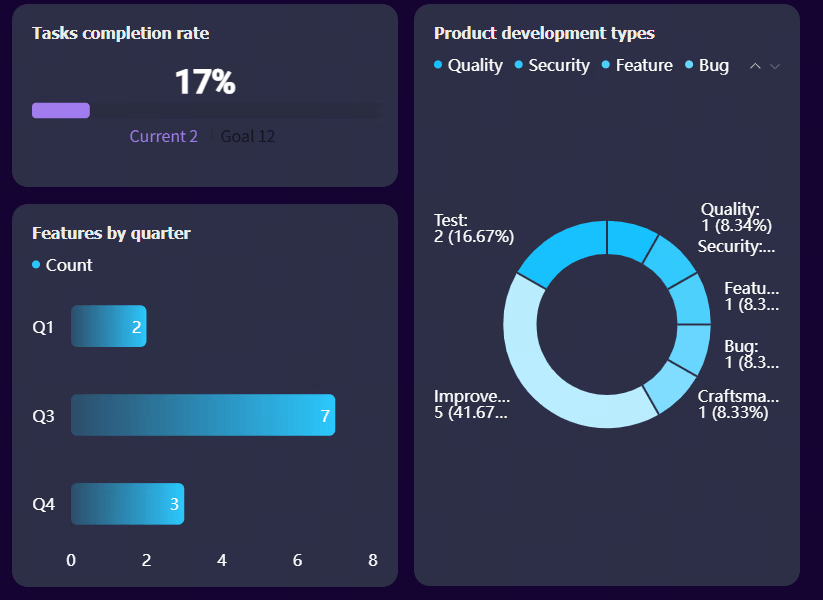
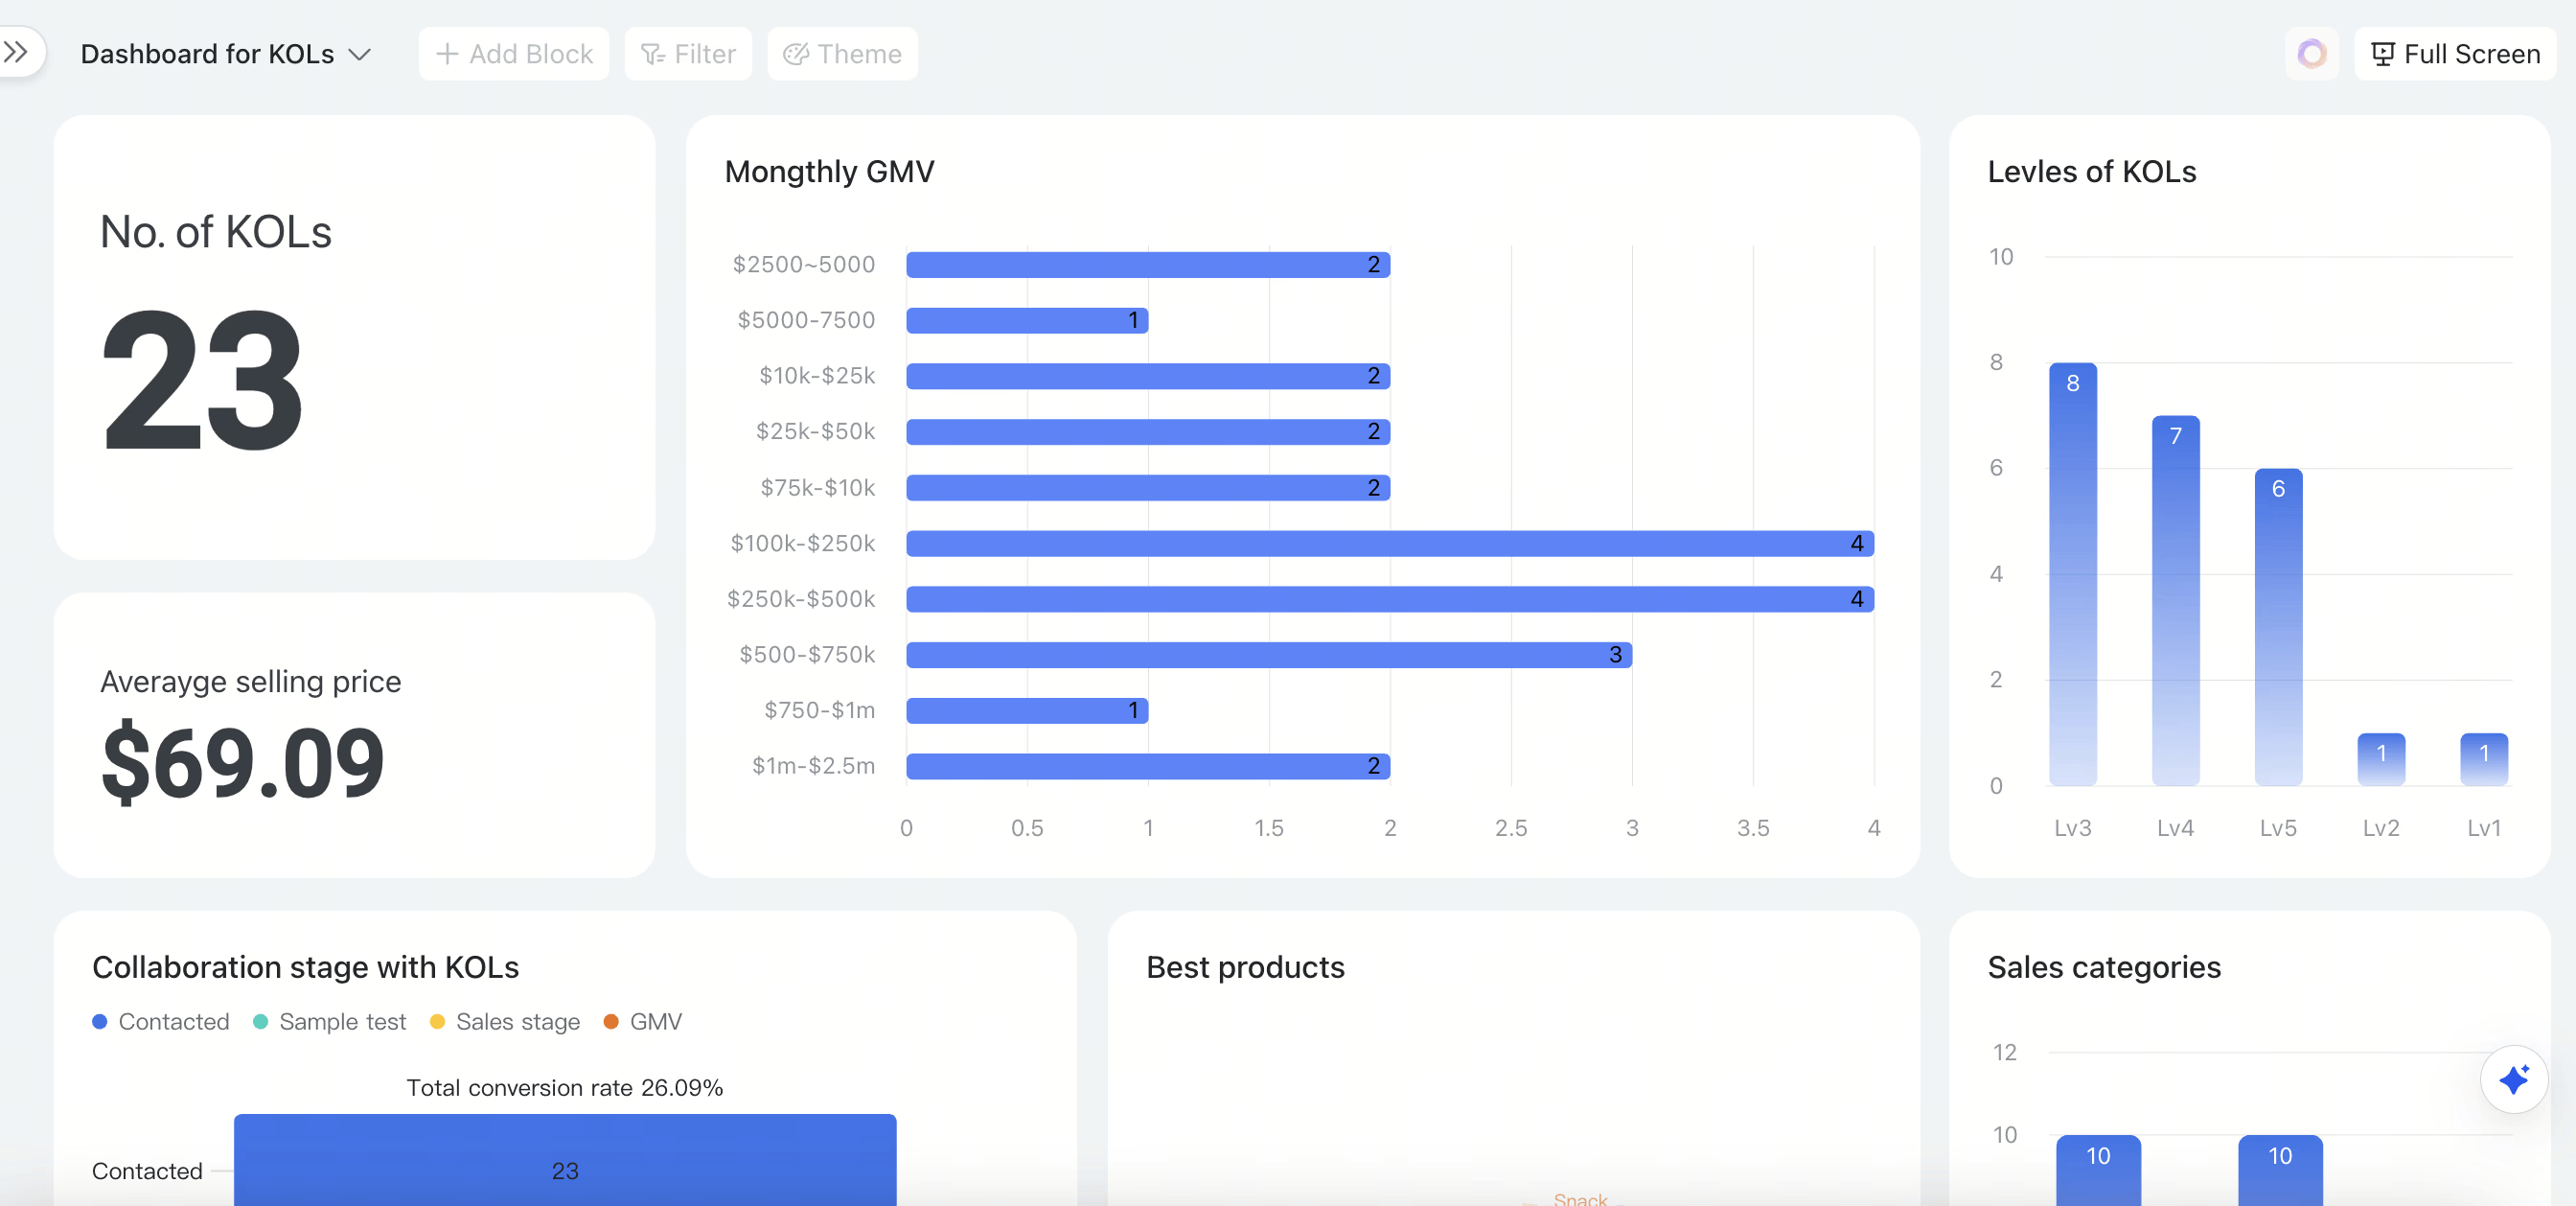
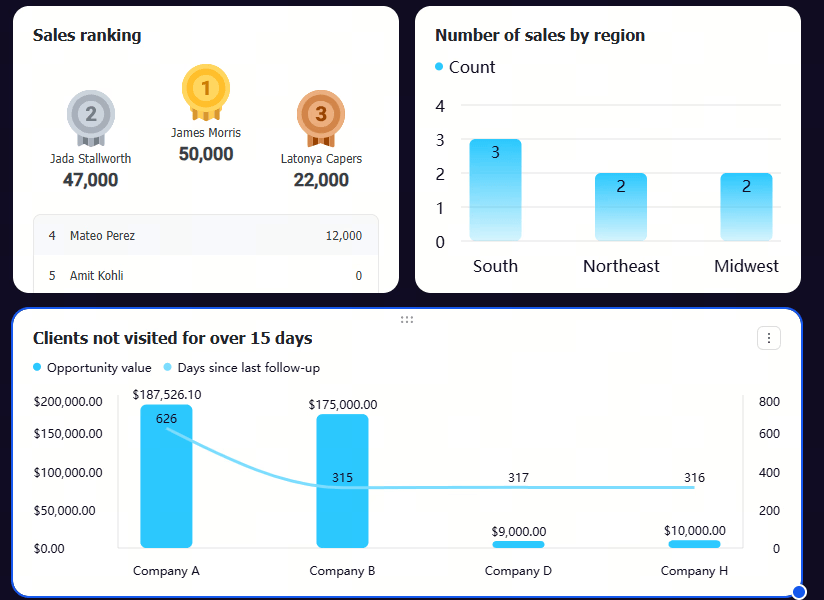
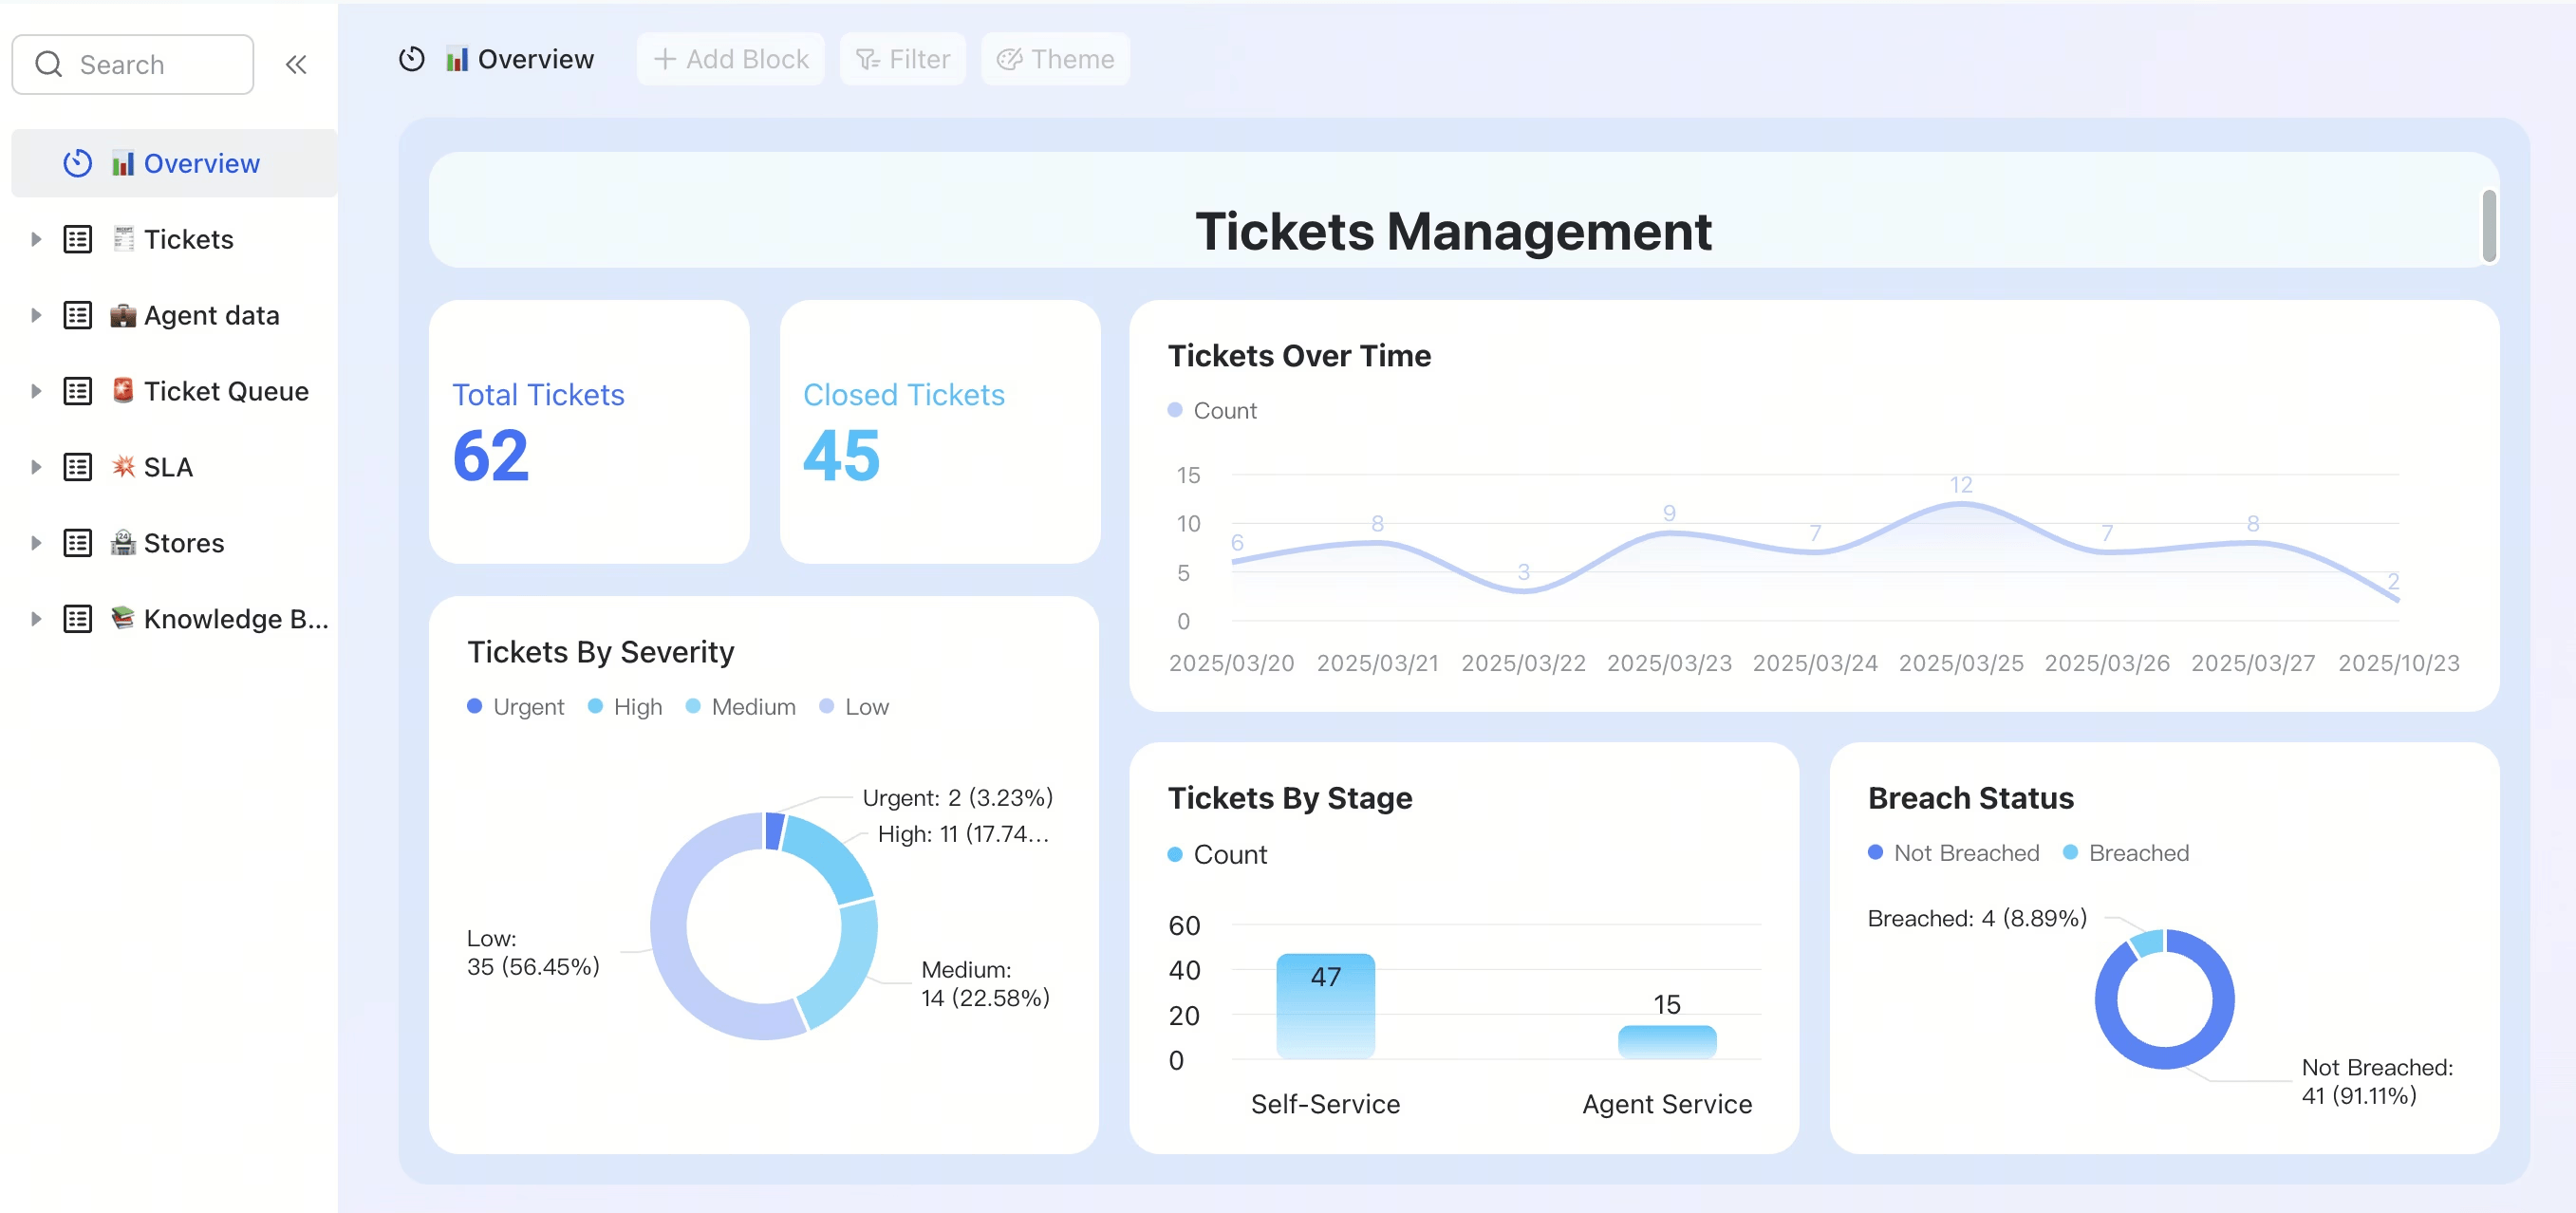
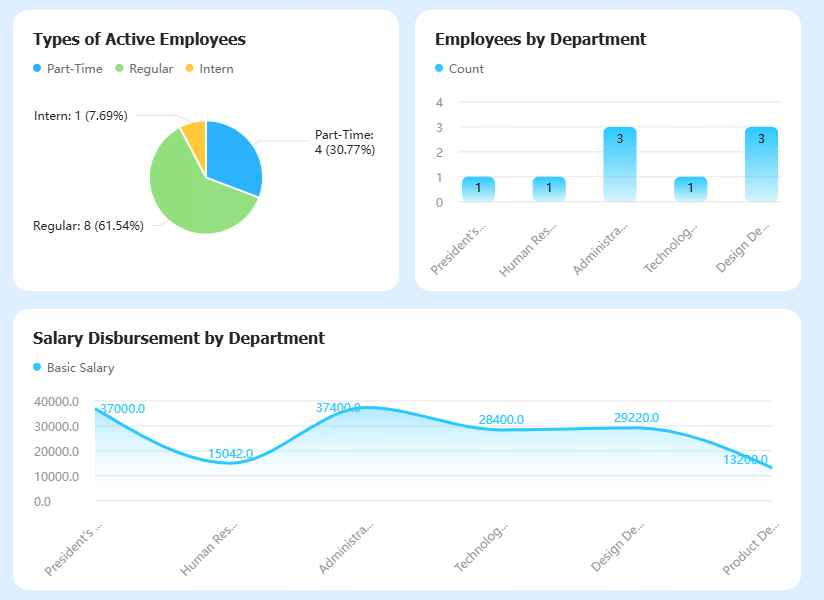
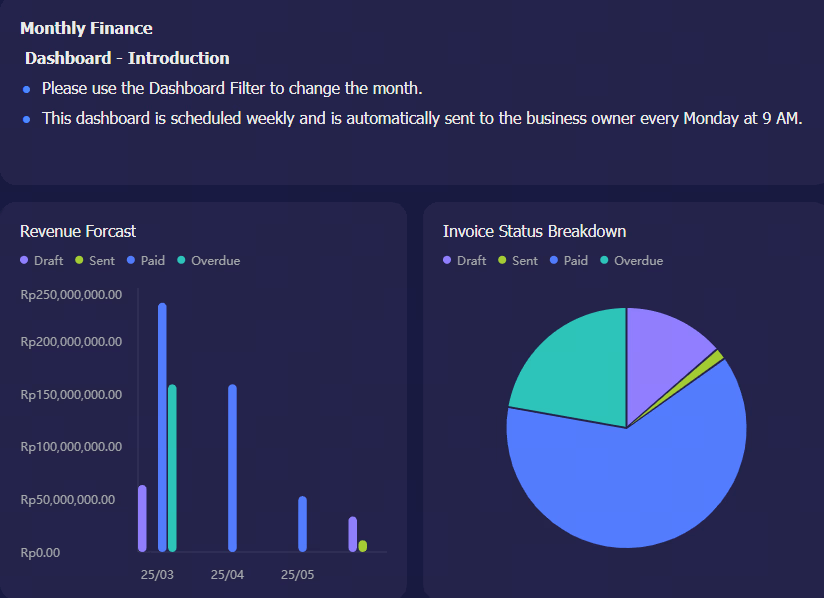
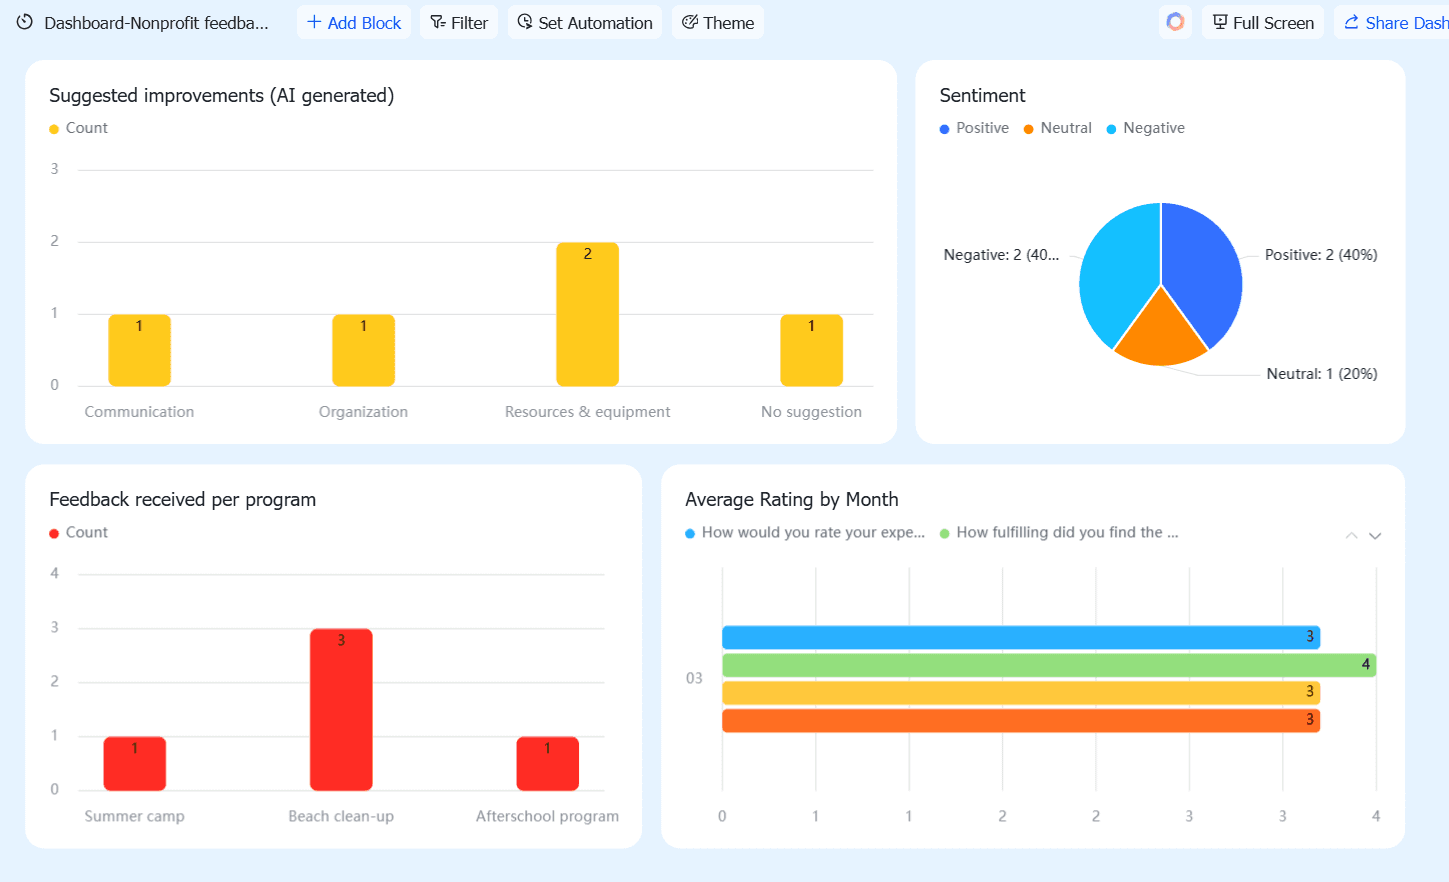
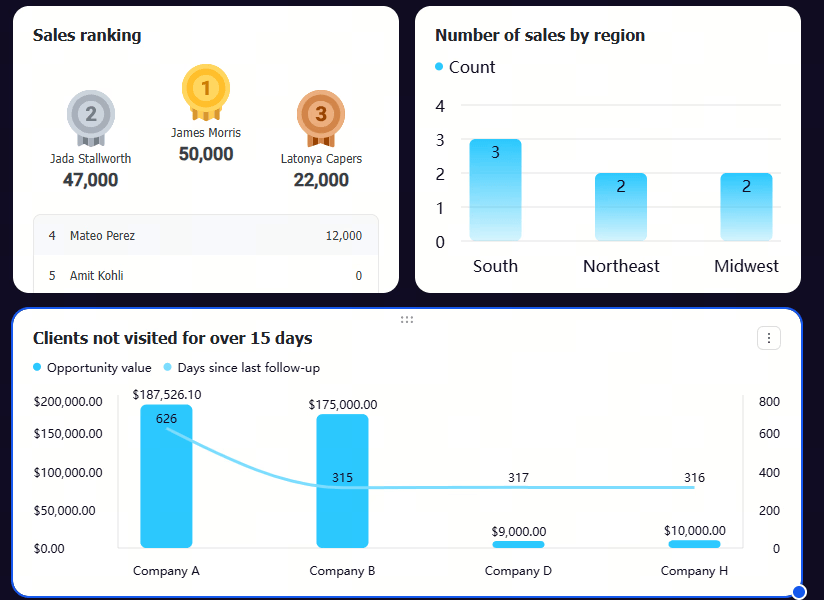
AI dashboard in Lark
AI dashboards take business intelligence to a whole new level. They leverage the power of AI and machine learning to automate data analysis, identify complex patterns, and generate accurate predictions. Here's a closer look at some of the key capabilities that set AI dashboards apart:
  • Automated data discovery: AI algorithms can automatically scan through vast datasets, identify relevant variables, and uncover hidden relationships without requiring extensive manual intervention.
  • Predictive analytics: AI dashboards go beyond simply reporting on past performance. They can use machine learning models to forecast future trends, predict customer behavior, and identify potential risks.
  • Real-time insights: Many AI dashboards can connect to live data streams, providing real-time updates and alerts. This allows you to stay on top of critical metrics, identify potential problems as they arise, and make timely decisions based on the latest information.
  • Personalized recommendations: AI dashboards can personalize the information displayed to each user based on their role, interests, and responsibilities.
  • Natural language processing (NLP): Some AI dashboards incorporate NLP capabilities, allowing users to interact with the dashboard using natural language. The use of voice commands is an increasingly popular option with NLP as well.
  • AI-powered search: An AI search dashboard lets users query all connected data sources conversationally — typing questions like "which region had the highest churn last quarter?" and getting instant visual answers rather than navigating pre-built reports.
  • Anomaly detection: AI-powered anomaly detection can automatically identify unusual patterns or outliers in the data, alerting you to potential problems or opportunities. This can help you detect fraud, identify equipment failures, or spot emerging market trends.
By combining the power of AI with the visualization capabilities of traditional dashboards, AI dashboards provide a more comprehensive, insightful, and actionable view of your data. They empower you to move beyond simply understanding what has happened and start predicting what will happen next.

Unlock deeper insights with an AI analytics dashboard.

How AI dashboards work under the hood

AI dashboards reduce dashboard creation time to seconds by automating the pipeline that traditionally required weeks of engineering. An AI dashboard builder handles everything from data ingestion to visualization without manual coding. Here's the flow:
  • Connect your data: Hook into databases, SaaS tools, CSV files, or Excel files. For teams still relying on spreadsheets, an Excel dashboard AI tool can parse sheets and auto-generate visualizations without SQL. Many AI dashboard tools can connect to over 500 data sources for real-time updates.
  • AI profiles and cleans: The system detects column types (dates, categories, currency), handles missing values, deduplicates rows, and normalizes schemas. AI dashboards automate data preparation processes so you spend less time wrangling.
  • Generate KPIs and chart types: AI models identify key performance metrics and auto-select optimal chart types-line charts for trends, bar charts for comparisons, scatter plots for correlations.
  • Create an interactive dashboard: Multiple visualizations combine into a complete dashboard with filters, drill-downs, and KPI cards. AI dashboard tools can even create mockups from sketches rapidly.
  • Continuously learn from usage: The system tracks which insights users engage with, refining prompts and layouts over time.

Why your business needs an AI dashboard: A data-driven revolution

According to NAB's Q1 2026 SME survey, about 40% of SMEs are actively using AI, many moving from manual reporting toward AI-assisted dashboards that cut analysis time by 40–60%. Product teams use them to monitor feature adoption with AI-generated cohort analysis. Marketing teams track campaign performance and ROAS with narrative summaries delivered each morning.
The benefits of AI dashboards are far-reaching and can impact virtually every aspect of your organization. Here are some compelling reasons why your business needs an AI dashboard:
  • Improved decision-making: AI dashboards provide you with the insights you need to make more informed, data-driven decisions. By leveraging predictive analytics and real-time data, you can anticipate future trends, identify potential risks, and make proactive decisions that improve your bottom line. Decisions are no longer made by gut feeling; they are made by analyzing data.
  • Increased efficiency and productivity: By automating data analysis and providing personalized recommendations, AI dashboards can significantly improve efficiency and productivity. Your team can spend less time on manual tasks and more time applying insights from business analytics courses to strategic initiatives that drive business growth. By understanding where time is spent, employees can find ways to optimize their time and use it more effectively.
  • Enhanced customer experience: AI dashboards can help you gain a deeper understanding of your customers' needs and preferences. By analyzing customer data, you can personalize your marketing efforts, improve customer service, and build stronger relationships. Understanding customer behavior can lead to increased retention and brand loyalty.
  • Optimized operations: AI dashboards can help you optimize your operations by identifying bottlenecks, predicting equipment failures, and improving resource allocation. This can lead to significant cost savings and improved efficiency. Predictive maintenance, for example, reduces downtime and unexpected repair costs.
  • Competitive advantage: In today's competitive landscape, businesses that can effectively leverage their data have a significant advantage. AI dashboards empower you to make faster, more informed decisions, identify new opportunities, and stay ahead of the curve. By quickly adapting to market changes, businesses can seize opportunities and maintain a competitive edge.
  • Better resource allocation: By understanding which areas are performing well and which are not, AI dashboards help you allocate your resources more effectively. This ensures that your investments are generating the best possible return. Identifying underperforming assets or campaigns allows you to reallocate resources to higher-yield opportunities.
  • Risk mitigation: AI dashboards can identify potential risks and vulnerabilities, allowing you to take proactive steps to mitigate them. This can help you protect your business from financial losses, reputational damage, and other negative consequences. Early warnings allow for preventative measures to be taken, minimizing the impact of potential crises.
A practical guide to implementing your AI dashboard

So, you're convinced an AI dashboard is the right move. Excellent! But knowing why you need one is only half the battle. The real work begins with how you bring that vision to life. Let's break down the implementation process into manageable, actionable steps.

Step 1: Define your objectives

Before you write a single line of code or select a single visualization, you need a crystal-clear understanding of what you want to achieve. What specific business questions are you trying to answer with your AI dashboard? What actions do you hope it will drive? This is where defining clear objectives and key performance indicators (KPIs) comes in. For example, if you're in sales, maybe your objective is to increase lead conversion rates. Your KPIs might then include metrics like lead scoring accuracy, time-to-conversion, and average deal size for AI-assisted deals.
Think about the different user roles that will be using the dashboard. What information is most relevant and actionable for each role? A marketing manager might be interested in campaign performance and customer segmentation, while a product manager might focus on user behavior and feature adoption. Tailoring the dashboard to the specific needs of each user group will significantly increase its adoption and impact.

Step 2: Data audit and preparation

AI dashboards are only as good as the data that fuels them. This step involves a thorough audit of your existing data sources. Identify what data you have, where it's stored, its quality, and how easily accessible it is. You'll likely find that data is scattered across various systems, in different formats, and with varying degrees of cleanliness.
Data preparation is often the most time-consuming part of the process, but it's absolutely crucial. It involves cleaning your data (removing errors, inconsistencies, and duplicates), transforming it into a consistent format, and integrating it from different sources. Consider using data pipelines or ETL (Extract, Transform, Load) tools to automate this process and ensure data quality. Data governance policies become extremely important in this stage, as maintaining data integrity is not a one-time activity. For large organizations, an enterprise AI governance dashboard provides centralized visibility into data lineage, model performance, access controls, and compliance status across all deployed AI assets.

Step 3: Choosing the right technology stack

The technology you choose will heavily influence the capabilities, scalability, and maintainability of your AI dashboard. You'll need to consider several key components:
  • AI platform: This is the engine that powers your dashboard, providing the machine learning algorithms and predictive analytics. Options range from cloud-based AI services (like those offered by AWS, Google Cloud, and Azure) to open-source frameworks (like TensorFlow and PyTorch). Consider factors like ease of use, scalability, cost, and the availability of pre-trained models relevant to your industry.
  • Data visualization tools: These tools allow you to present your data in a clear, compelling, and interactive way. Popular options include Tableau, Power BI, and open-source libraries like D3.js. Look for tools that offer a wide range of chart types, customization options, and the ability to drill down into the data.
  • Data storage: Choose a data storage solution that can handle the volume and velocity of your data. Options include cloud-based data warehouses (like Snowflake and BigQuery), traditional relational databases, and NoSQL databases.
  • Integration platform: A robust integration platform will allow you to connect your AI platform, data sources, and visualization tools seamlessly. Think about using an integration platform as a service (iPaaS) or tools like Lark and Apache Kafka.
Choosing the right technology stack is not just about picking the "best" tools; it's about selecting the tools that best fit your specific needs, budget, and technical expertise.

Step 4: Design and development

With your data prepared and your technology stack in place, it's time to start designing and developing your AI dashboard. Focus on creating a user-friendly interface that provides clear and actionable insights.
  • Prioritize key information: Don't overwhelm users with too much data. Focus on the key objectives you defined in Step 1 and present them prominently. Use visual cues (like color-coding and alerts) to highlight important trends and anomalies.
  • Enable interactivity: Allow users to drill down into the data, filter by different dimensions, and explore different scenarios. This will empower them to uncover deeper insights and make more informed decisions.
  • Mobile-first design: Ensure your dashboard is accessible and functional on mobile devices. Many users will want to access the dashboard on the go, so mobile optimization is critical.
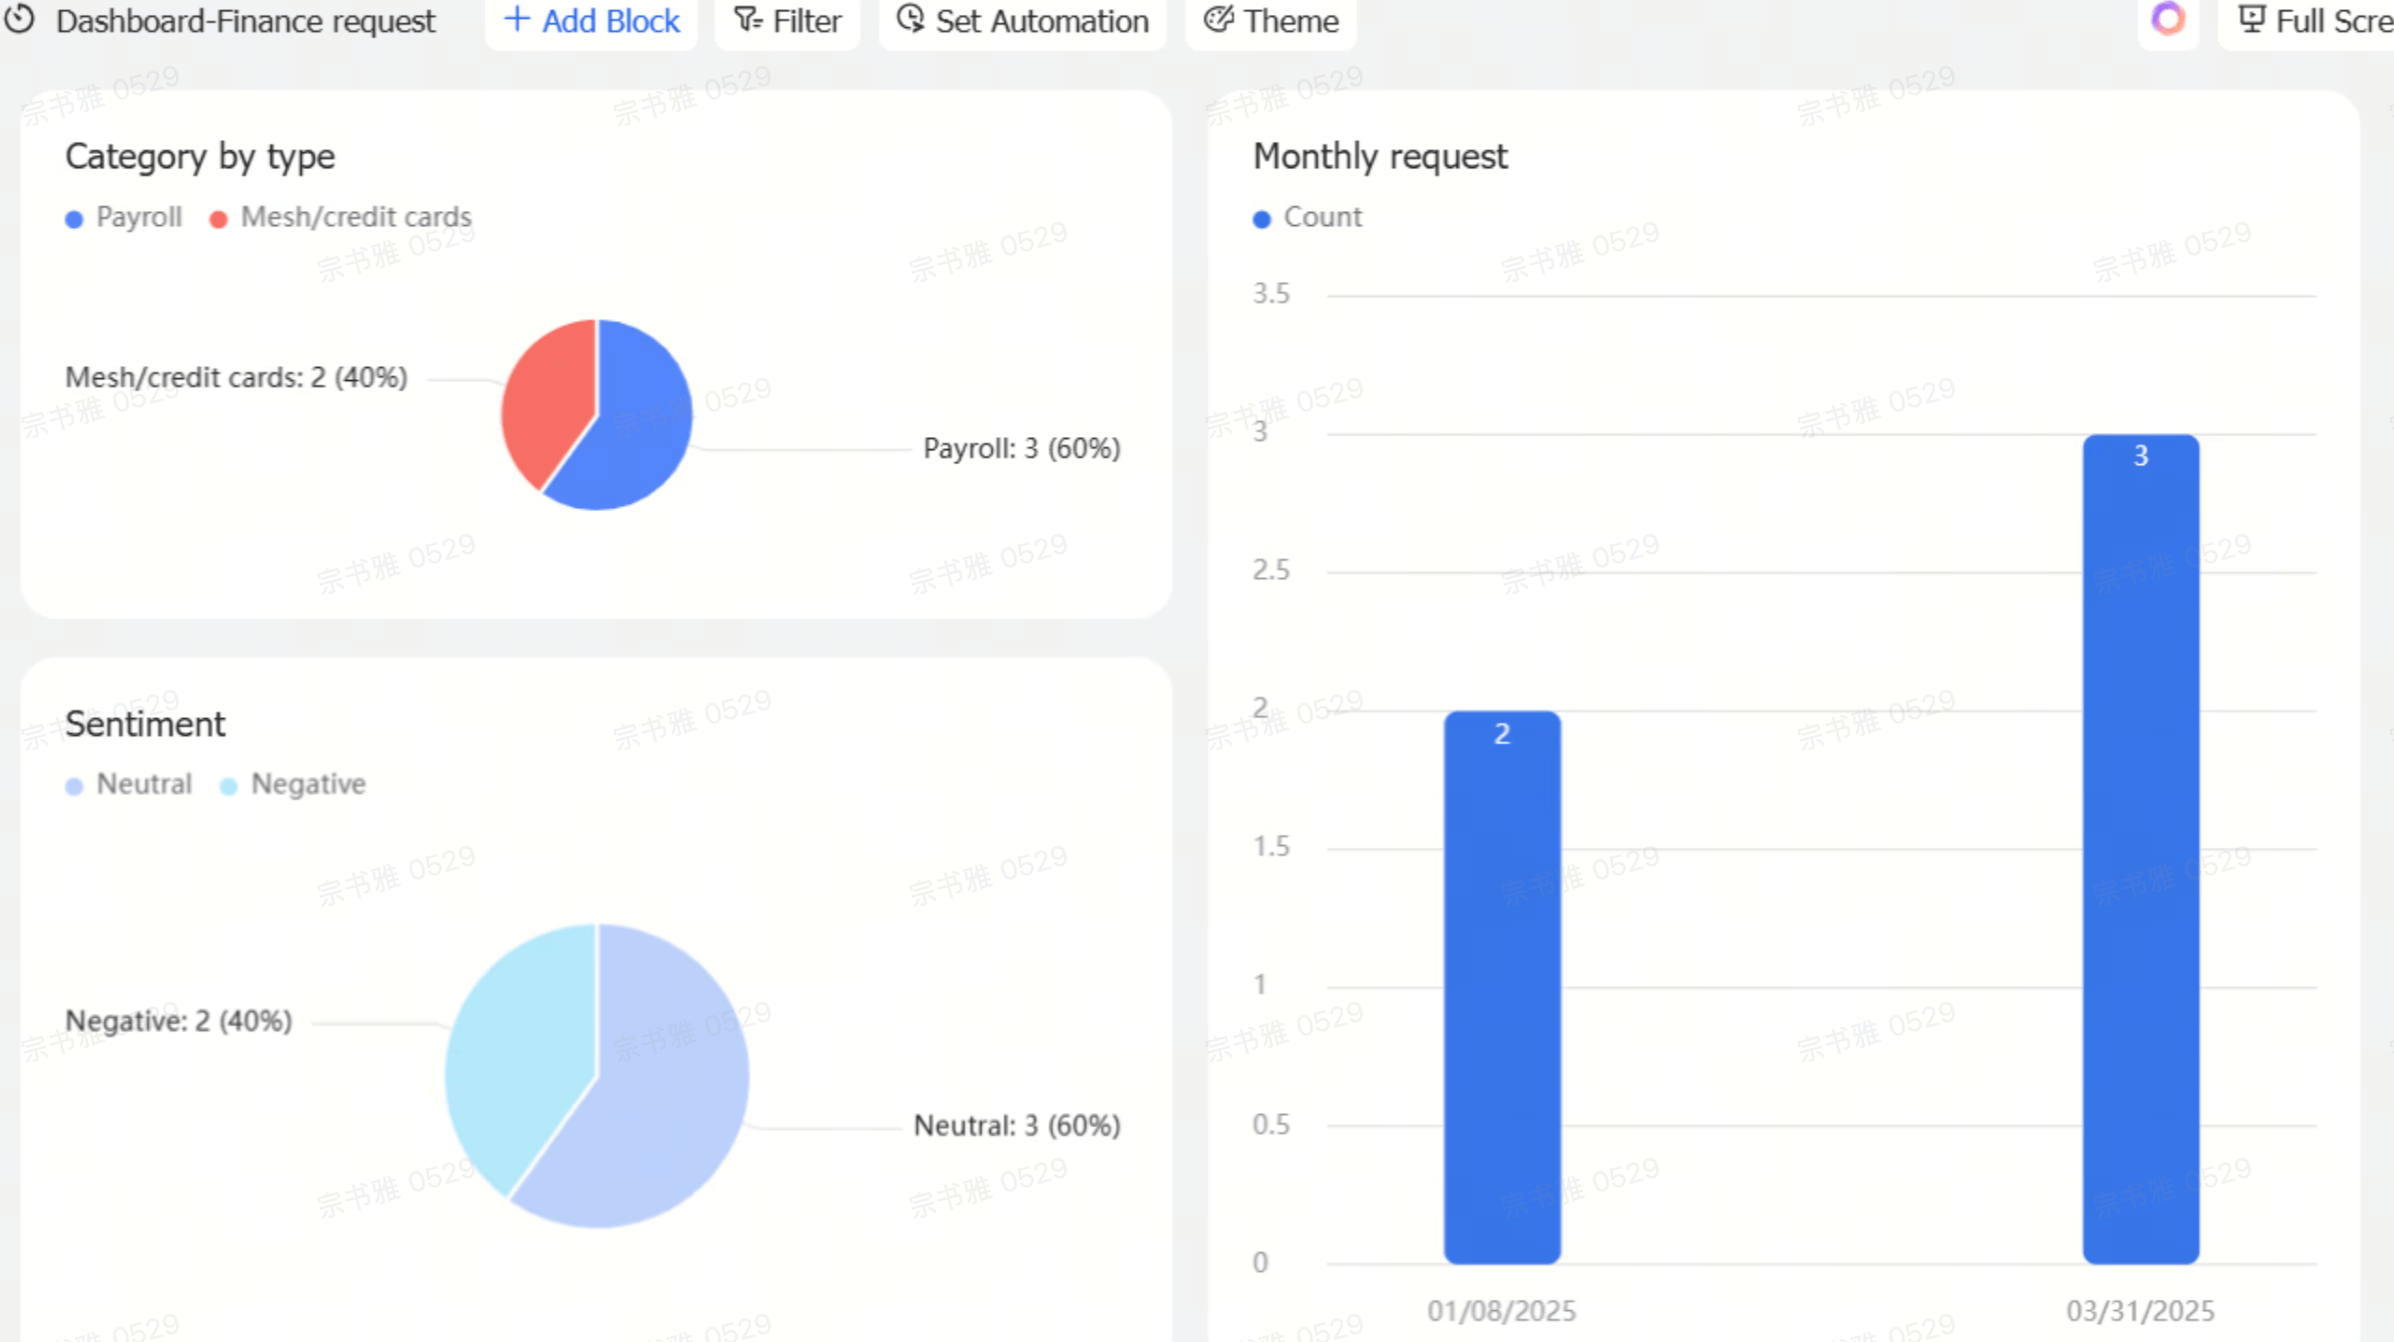
Before you roll out your AI dashboard to the entire organization, it's essential to test it thoroughly with a small group of users. Gather feedback on the design, functionality, and accuracy of the data. Use this feedback to iterate and improve the dashboard.

Step 5: Testing and iteration

Before you roll out your AI dashboard to the entire organization, it's essential to test it thoroughly with a small group of users. Gather feedback on the design, functionality, and accuracy of the data. Use this feedback to iterate and improve the dashboard.
Testing should include verifying the accuracy of the data, the performance of the AI models, and the usability of the interface. Consider conducting A/B testing to compare different design options and identify the most effective ways to present the data.

Step 6: Deployment and training

Once you're satisfied with the results of your testing, it's time to deploy the AI dashboard to the entire organization. This should be accompanied by comprehensive training for all users. Make sure they understand how to use the dashboard, how to interpret the data, and how to take action based on the insights it provides.
Training should cover not only the technical aspects of using the dashboard but also the business context behind the data. Explain how the AI models work, what assumptions they are based on, and what limitations they have. This will help users to trust the data and use it responsibly.

Step 7: Continuous monitoring and improvement

An AI dashboard is not a "set it and forget it" solution. It requires continuous monitoring and improvement. Track usage patterns, gather feedback from users, and monitor the performance of the AI models. As your business evolves and your data changes, you'll need to update your dashboard accordingly.
Regularly review the KPIs you are tracking and make sure they are still relevant to your business objectives. Be prepared to adjust the dashboard as your needs change.

Streamline AI model deployment and monitoring with Lark.

How Lark empowers your AI dashboard
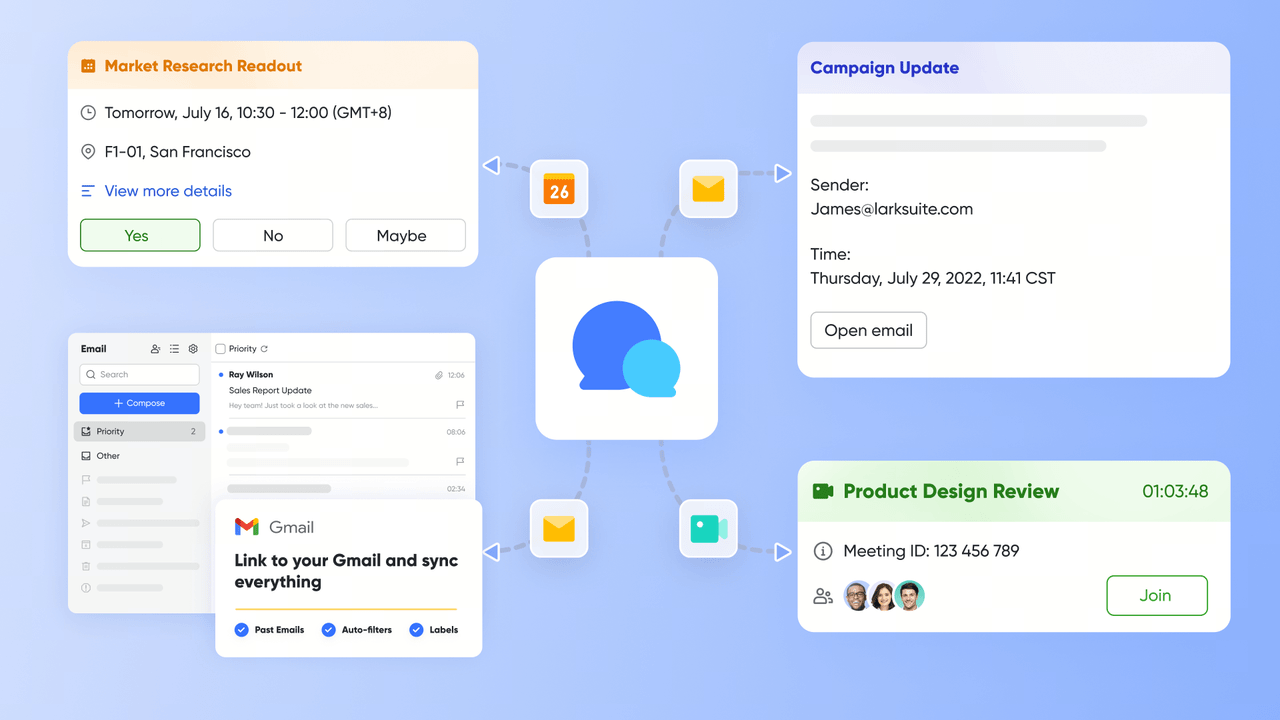
Lark is an all-in-one collaboration platform encompassing chat, video meetings, docs, sheets, calendar, email, and workflow automation, and serves as the natural home for AI dashboards. Integrating an AI dashboard with a platform like Lark can amplify its effectiveness. Instead of analytics living in a siloed BI tool, insights sit where teams already work.
Here’s how:
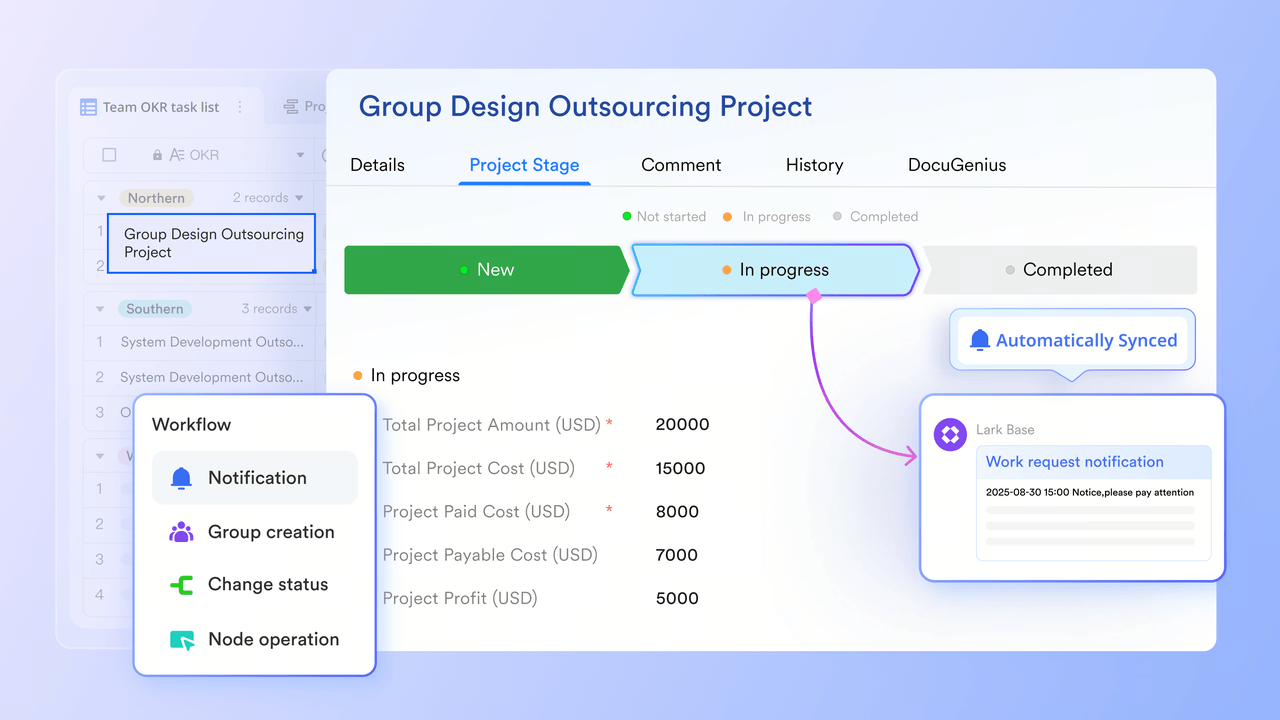
Automated workflow: Lark Base’s workflow automation capabilities can be triggered by insights from your AI dashboard. This turns Lark into a live AI workflow automation dashboard, where insights don't just sit on a screen — they drive action. For example, if the dashboard detects a significant drop in sales leads, it could automatically trigger a workflow in Lark to notify the sales team, escalate the issue to management, and initiate a root cause analysis.
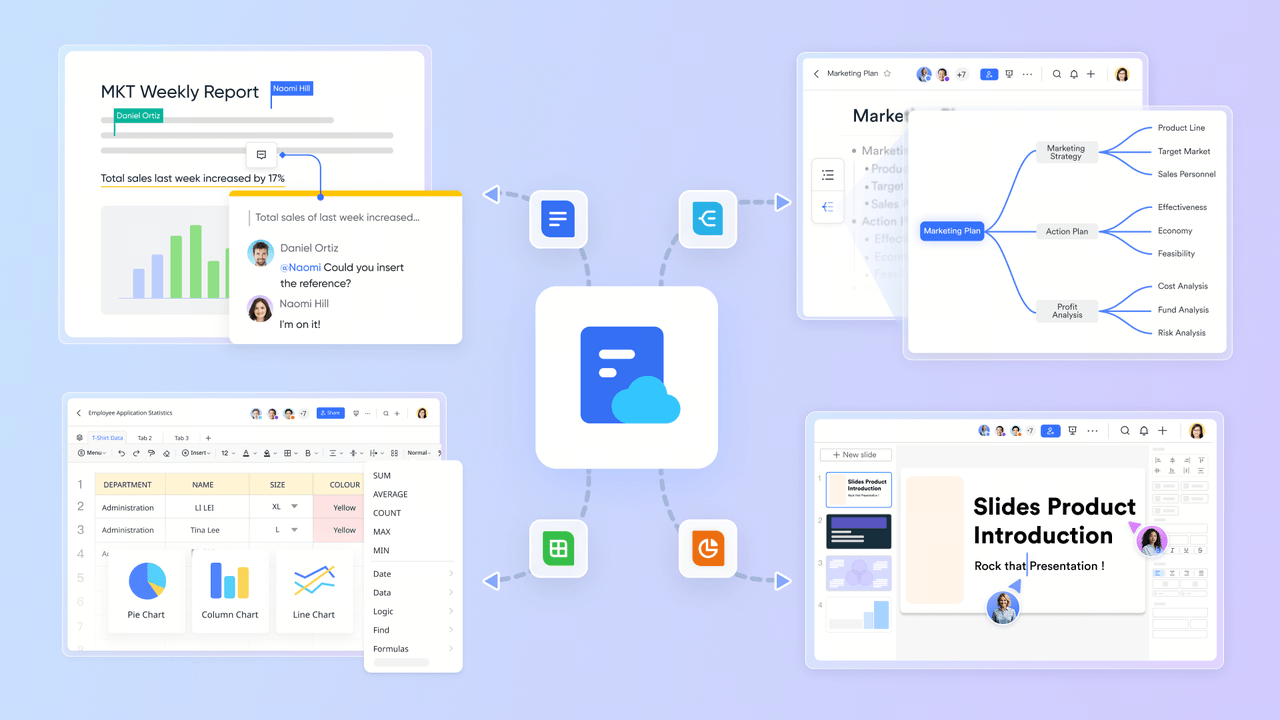
Enhanced knowledge sharing: Lark Docs's document collaboration features are invaluable for documenting the insights generated by your AI dashboard. You can create shared documents to explain the methodology behind the AI models, document best practices for using the dashboard, and share case studies of successful applications. This helps to build a data-driven culture within your organization.
Real-time communication and collaboration: Imagine your AI dashboard identifies a critical issue with a particular marketing campaign. Instead of emailing screenshots or scheduling meetings, you can instantly share the relevant dashboard view within a Lark Messenger group chat, tag the responsible team members, and initiate a discussion right then and there. This speeds up decision-making and allows for more agile responses.
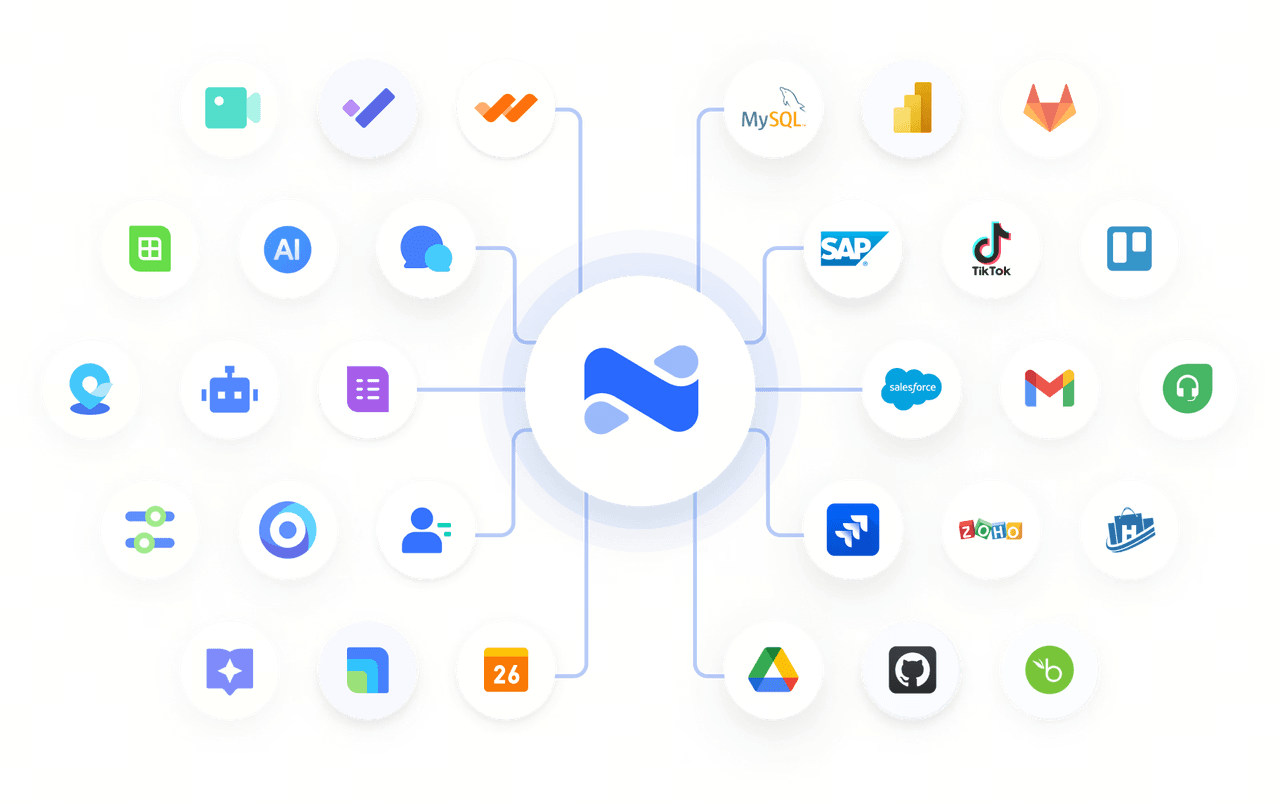
Seamless data integration: Lark Base connects to a wide range of data sources, making it easier to bring relevant information into your AI dashboard. Think of pulling data from your CRM, project management tools, and marketing automation platforms all within Lark AnyCross's ecosystem, making data access more streamlined.
By leveraging Lark's capabilities, you can transform your AI dashboard from a static reporting tool into a dynamic, collaborative, and action-oriented platform. It’s about making data a part of everyone's daily workflow.
Don't just take our word for it — here's what our customer has to say:

"Lark transformed our business. We were able to replace over 8 different collaboration tools with just one app. The best part is how customizable it is: we've built our own personalized dashboards, workplace structure, and automation tools, to specifically cater to our business needs. Our team management has never been this easy, fast, and productive than now."

Alexei Dela Cuesta

CEO at Surgo Media

Learn more about Lark's pricing:
  • Starter plan: Free forever plan that includes 11 powerful tools for up to 20 users. It also comes with 100GB of storage space, 1000 automation runs, AI translations, and more. No credit card needed.
  • Basic plan: $6/user/month (billed annually) for up to 500 users. It includes everything in Starter and unlimited message history, 5TB of storage space, 1,000 automation runs, and more. Some users may need to contact sales to purchase this plan.
  • Pro plan: $12/user/month (billed annually) for up to 500 users. It includes everything in Basic plus group calling for up to 500 attendees, 15TB of storage space, 50,000 automation runs, and more.
  • Enterprise plan: Contact sales for custom pricing. Supports unlimited users and includes even more automation runs and advanced security, compliance, and management features.
Starter
Pro
Enterprise

Starter

For small teams with simple communication needs

$0

/ user / month

Try for free

No credit card needed

20 users max
18 months message history
1-on-1 video meetings
100 GB storage
Lark Docs & Mail
1000 Base automation runs/month
2000 rows per table in Base

Pro

For companies with comprehensive collaboration and management needs

$12

/ user / month

Billed annually

500 users max
Unlimited message history
500-participant video meetings
15 TB storage
Lark Docs & Mail
50k Base automation runs/month
20k rows per table in Base

Enterprise

For large companies with advanced security and organizational management needs

Get a personalized demo and pricing

Unlimited users
Unlimited message history
500-participant video meetings
15 TB storage + 30 GB storage/user
Lark Docs & Mail
500k Base automation runs/month
50k Base automation runs/month
Single sign-on (SSO)

Pro

For companies with comprehensive collaboration and management needs

$12

/ user / month

Billed annually

500 users max
Unlimited message history
500-participant video meetings
15 TB storage
Lark Docs & Mail
50k Base automation runs/month
20k rows per table in Base

Core use cases for AI dashboards across the business

AI dashboards serve every function. Here are concrete applications with specific metrics:

1. Product

Track feature adoption rates, funnel drop-offs, and retention by cohort (Day-1, Day-7, Day-30). In April 2026, a product team spots that onboarding drops at step 3; the AI clusters users by acquisition source to explain why. Product teams gain granular clarity without analyst bottlenecks.

2. Marketing

AI dashboards can monitor marketing performance across multiple channels-ROAS, CAC, CPA, impressions, CTR. Auto-generate executive summaries for weekly campaign performance reports. Reduce ad spend in channels where predicted ROI falls below threshold.

3. Sales & Revenue

AI dashboards are used for sales forecasting and revenue trend analysis. Monitor pipeline, win rates, ARR, and churn. AI flags key accounts at risk based on slowing engagement patterns.

4. Finance & Operations

Build financial overview dashboards for cash flow, burn rate, and budgets vs. actuals. A manufacturer cut unplanned downtime by 22% using real-time OEE dashboards with anomaly detection for operational incidents.

5. People / HR

Monitor headcount, hiring funnel efficiency, turnover by department, and engagement survey results. AI dashboards make this data accessible to non-analytics HR teams. When automated triggers are added, the view evolves into an AI workflow automation dashboard that routes turnover-risk alerts directly to managers in chat.

6. AI Agents & Automation

As AI agents take on more operational tasks, an AI agent dashboard monitors agent performance, task completion rates, and escalation patterns. For organizations deploying multiple agents at scale, an enterprise AI agents dashboard becomes mission control, tracking every agent's status, cost per task, and ROI across departments.
AI dashboards help both individual contributors (frontline, operational views) and executives (board-ready summaries and forecasts). For CEOs, an AI competitive intelligence dashboard is one of the most valuable CEO tools available. It consolidates market shifts, competitor moves, and internal performance signals into a single strategic view that supports faster, more confident decisions at the top.

Common pitfalls and how to avoid them

Even the most well-designed AI analytics dashboard can run into issues. Here are the most common pitfalls and how to avoid them:

1. Poor data quality

Missing values in customer IDs, inconsistent currency formats, or duplicated rows mislead AI models.
Mitigation: Define a data owner and run automated validation checks before data feeds into dashboards.

2. Unclear metric definitions

If "churn" means different things to sales and product, AI-generated insights will confuse rather than clarify.
Mitigation: Document metric formulas in a Lark Wiki and anchor dashboards to a governed semantic layer.

3. Over-reliance on AI outputs

Accepting AI-generated charts or narratives blindly risks errors-hallucinated metrics or misinterpreted visualizations.
Mitigation: Always do human review for financial or compliance-related views; treat AI as a draft author, not a final authority.

4. Dashboards too complex for the audience

An operations director and a board member need different views.
Mitigation: Build role-specific layouts and use AI summaries to bridge the gap between detail and overview.

5. Change management gaps

Users unused to AI features may distrust or ignore them.
Mitigation: Run pilot rollouts with one or two teams first, record short walkthrough videos, and schedule quarterly audits of dashboard accuracy and real world usage.

Conclusion: Embracing the power of AI dashboards

AI dashboards are no longer a futuristic concept but a tangible and transformative tool that can revolutionize how businesses operate. From streamlining workflows and improving decision-making to driving innovation and enhancing customer experiences, the benefits of implementing an AI dashboard are undeniable.
By understanding the trends shaping the future of these powerful tools and proactively addressing the challenges of implementation, organizations can unlock unprecedented levels of efficiency, innovation, and growth. The insights gleaned from a well-designed AI dashboard are incredibly valuable, providing the edge needed to make informed choices and confidently navigate the complexities of the modern business world.
Consider how Lark's integrated platform can further enhance your AI dashboard experience, fostering collaboration and streamlining your workflows. It's a powerful combination to drive your organization forward. Let Lark be the catalyst that unleashes your AI dashboards true potential.

Ready to build your AI generated dashboard?

FAQs about AI dashboard
What is an AI dashboard?

An AI dashboard is an advanced data visualization tool integrated with machine learning and natural language processing. Unlike traditional static dashboards that only show past metrics, an AI dashboard actively analyzes data to explain "why" things happened, predict future outcomes, and allow users to explore data dynamically using natural language.

What’s the best AI-powered dashboard generator?

Top industry solutions include Microsoft Power BI (powered by Copilot) and Tableau (with Einstein AI) for enterprise-scale data. For teams seeking a highly collaborative and lightweight alternative, Lark is an excellent choice. It allows users to build powerful, multi-dimensional dashboards and custom charts using AI-assisted setup, making database management and visual tracking seamless within a shared workspace.

What features are in an AI dashboard?
  • Natural language querying (NLQ): Allows users to type conversational questions to generate instant charts and reports.
  • Predictive analytics: Uses historical data and machine learning to forecast future trends.
  • Automated insights & anomaly detection: Automatically flags outliers, drops, or sudden spikes in data without manual configuration.
  • Dynamic personalization: Tailors the visual layout and data views based on the specific user’s role and past interactions.
How to fix AI analytics dashboard issues?
  • Resolve data quality issues: Ensure the underlying data pipelines (ETL/ELT) are clean and feeding accurate, real-time data.
  • Address model drift: Regularly retrain and recalibrate your machine learning models to adapt to shifting business patterns.
  • Check integration and API health: Verify that your data connectors, API endpoints, and database permissions are functioning correctly.
  • Optimize performance: Use data caching or summary tables to reduce query latency on heavy AI-driven computations.
How to build an AI visibility dashboard?
  1. Identify key metrics: Define the AI parameters you want to track, such as model latency, token costs, user queries, and system accuracy.
  2. Establish data pipelines: Collect and aggregate logs from your AI APIs, LLM gateways, or model deployment endpoints.
  3. Select a dashboard platform: Use specialized LLM observability platforms (such as Langfuse or Arize) for deep engineering metrics, or leverage Lark Base to quickly build team-facing trackers for costs, usage, and project milestones.
  4. Configure AI visualizations: Implement automated charts and predictive models to continuously monitor system performance and alert the team to anomalies.

Related Reading

Alex Miller

Technical Product Marketing Specialist

Alex is a Technical Product Marketing Specialist. With extensive experience in managing complex projects, he explores advanced solutions and offers valuable insights on optimizing workflows and driving digital transformation for organizations.

Keep reading