














Best Sales Dashboard Examples to Inspire Your Team in 2026

Ryan Tanner
Product Marketing Specialist
Sep 18, 2026
Ryan Tanner
Sep 18, 2026

17 min read


Sales dashboards are the backbone of effective decision-making, turning raw numbers into actionable insights that every sales leader can trust. In this article, we'll explore the best sales dashboard examples for 2025, covering everything from a sales performance dashboard template free to real-time forecasting views. You'll see how different types of dashboards, such as sales pipelines, revenue, and marketing-to-sales funnels, help teams stay aligned while driving measurable growth. We'll also share free templates that you can start using right away, along with practical tips on selecting the right KPIs to track. With so many project management software options available today, such as Lark, building powerful dashboards has never been easier or more collaborative.

What is a sales dashboard?
A sales dashboard is a visual tool for tracking sales performance, pipeline health, and essential KPIs. It consolidates metrics such as deals closed, conversion rates, and revenue targets into a single view, allowing teams to see whether they're on track or falling behind. According to a recent SaaS study, 78% of companies embed dashboards in their software products, and 75% of organizations using real-time dashboards report an improvement in operational efficiency. With Lark Base, dashboards update dynamically as sales reps log activities, providing real-time insights that lead to faster decisions. These tools help managers monitor funnels, leadership see topline metrics, and sales & marketing stay aligned around common goals. In short, a sales dashboard turns scattered data into clarity and alignment.
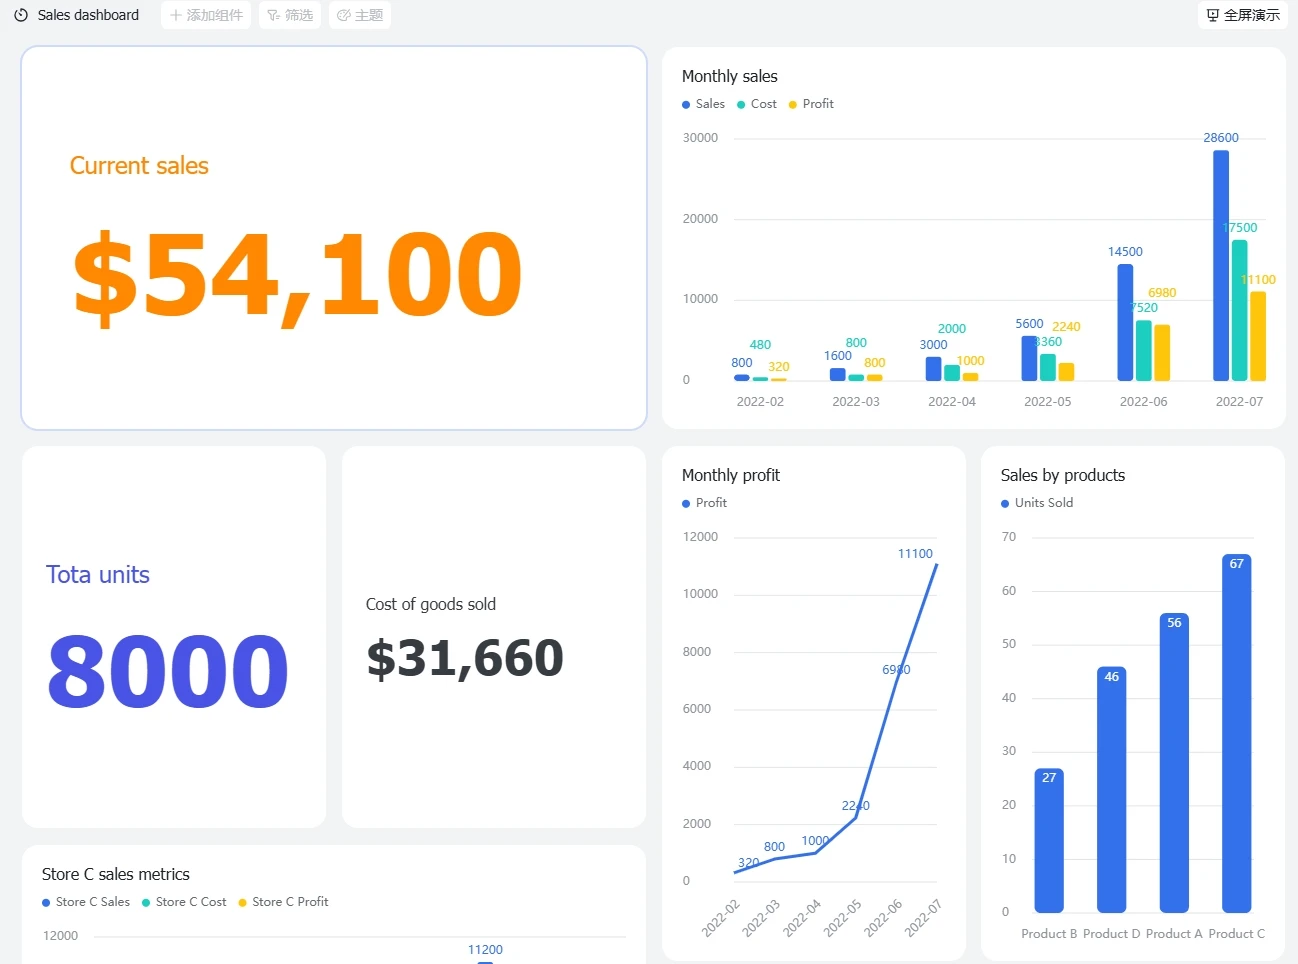
Sales dashboard examples by use case
Different teams need different insights, which is why sales dashboard examples vary by use case. From tracking performance KPIs to forecasting revenue, each dashboard highlights unique metrics that drive more intelligent decisions. Some practical examples are mentioned below.
1. Sales performance dashboard
A sales performance dashboard gives leaders and reps a clear view of how the team is progressing against revenue goals and KPIs. Tracking key metrics, such as deals closed, win rate, and overall sales activity, highlights whether the team is on pace or falling behind. This type of dashboard doesn't just measure results; it motivates reps by making targets visible and achievements transparent. With tools like Lark, managers can share sales performance dashboards in real time, ensuring accountability, fostering competition, and keeping everyone aligned on collective goals.
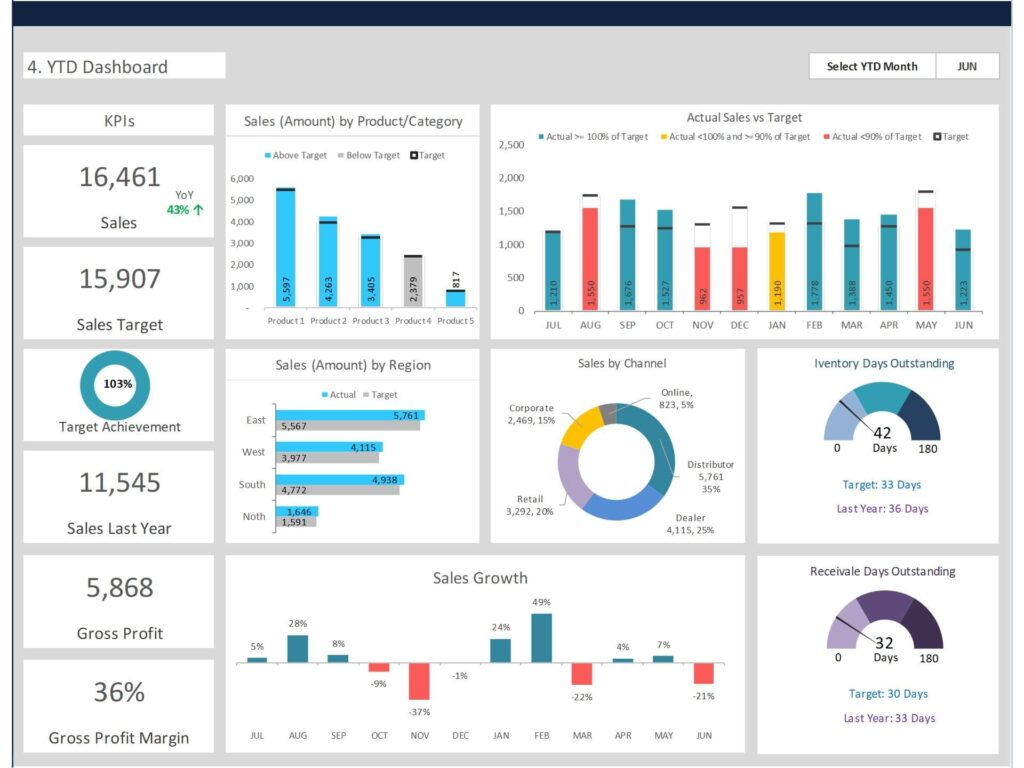
Image source: bizinfograph.com
2. Sales pipeline dashboard
A sales pipeline dashboard gives visibility into deals in progress and the value of opportunities at each stage of the pipeline. By tracking metrics such as conversion rates, sales velocity, and forecasted revenue it highlights how efficiently prospects are moving through the funnel. This sales pipeline dashboard is crucial for spotting bottlenecks that may slow down deal flow and for helping managers prioritize the most promising opportunities. With solutions like Lark, teams can visualize the sales pipeline in real time, ensuring resources are directed where they'll have the most significant impact on closing deals.
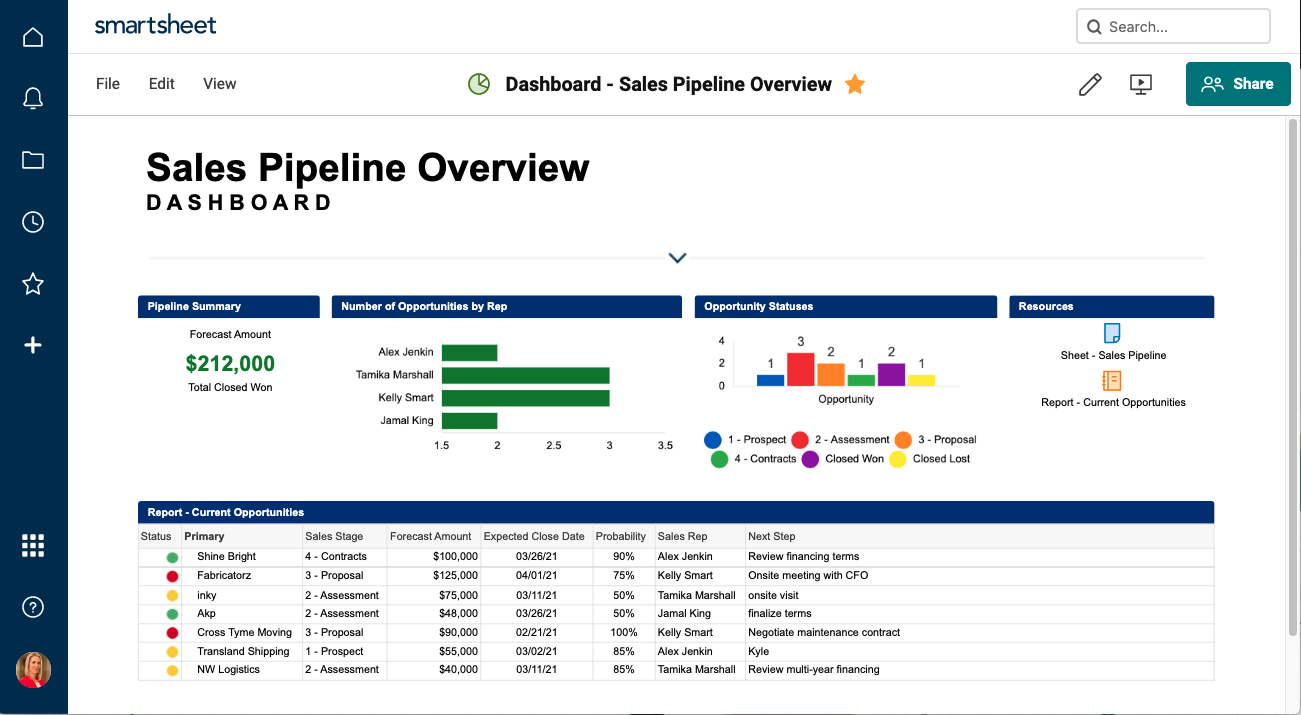
Image source: smartsheet.com
3. Sales forecast dashboard
A sales forecast dashboard focuses on predicting future revenue by analyzing current pipeline data and historical performance. It tracks metrics such as forecasted revenue vs. quota, pipeline coverage ratios, and probability scoring of open opportunities. By offering a forward-looking view, this dashboard enables leadership to plan strategically, allocate resources effectively, and set realistic growth targets with platforms like Lark. The forecasts are updated dynamically as new deals enter or progress through the sales pipeline, giving sales teams a reliable, data-driven foundation for decision-making and long-term business planning.
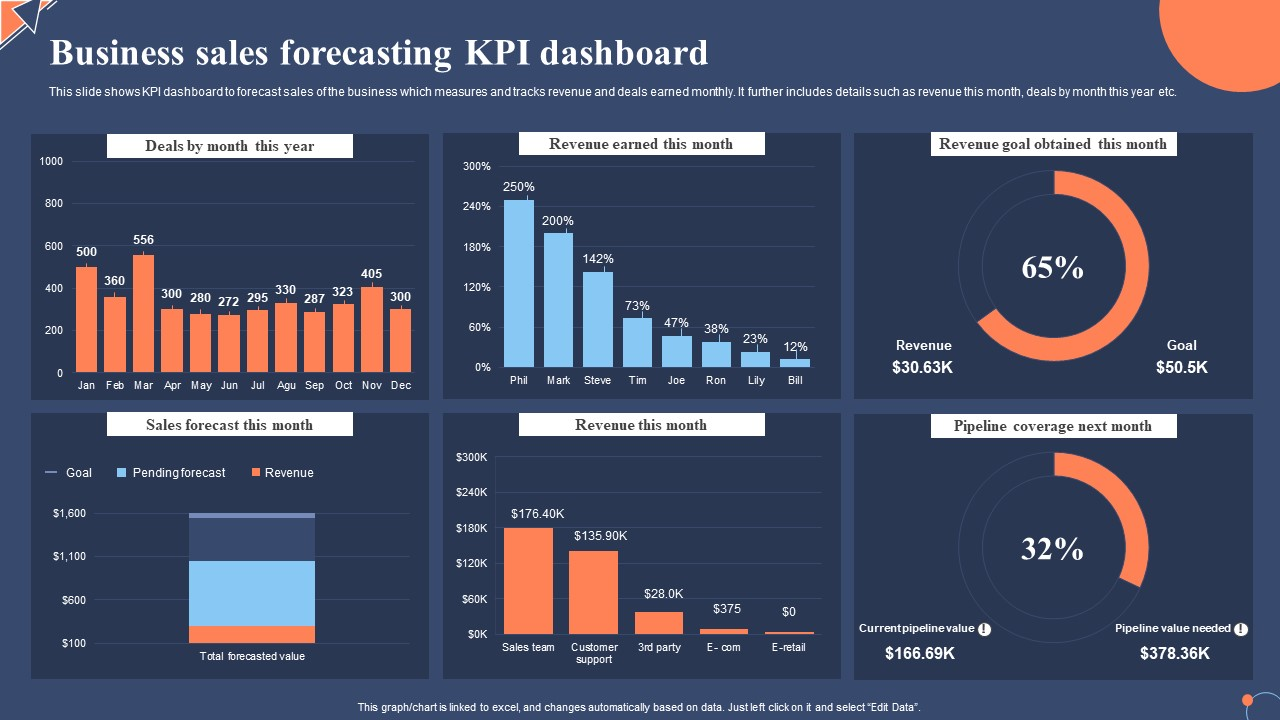
Image source: slideteam.net
4. Sales and marketing dashboard
A sales and marketing dashboard bridges the gap between lead generation efforts and their impact on the sales pipeline. It highlights metrics such as marketing-qualified leads (MQLs), sales-qualified leads (SQLs), campaign ROI, and funnel drop-offs to show how effectively marketing campaigns are fueling revenue opportunities. This dashboard is essential for aligning the goals of both teams, ensuring that marketing generates high-quality leads and sales follow up effectively. With Lark, sales and marketing dashboards can be shared in real time, helping both functions collaborate, track performance, and maximize conversion rates together.
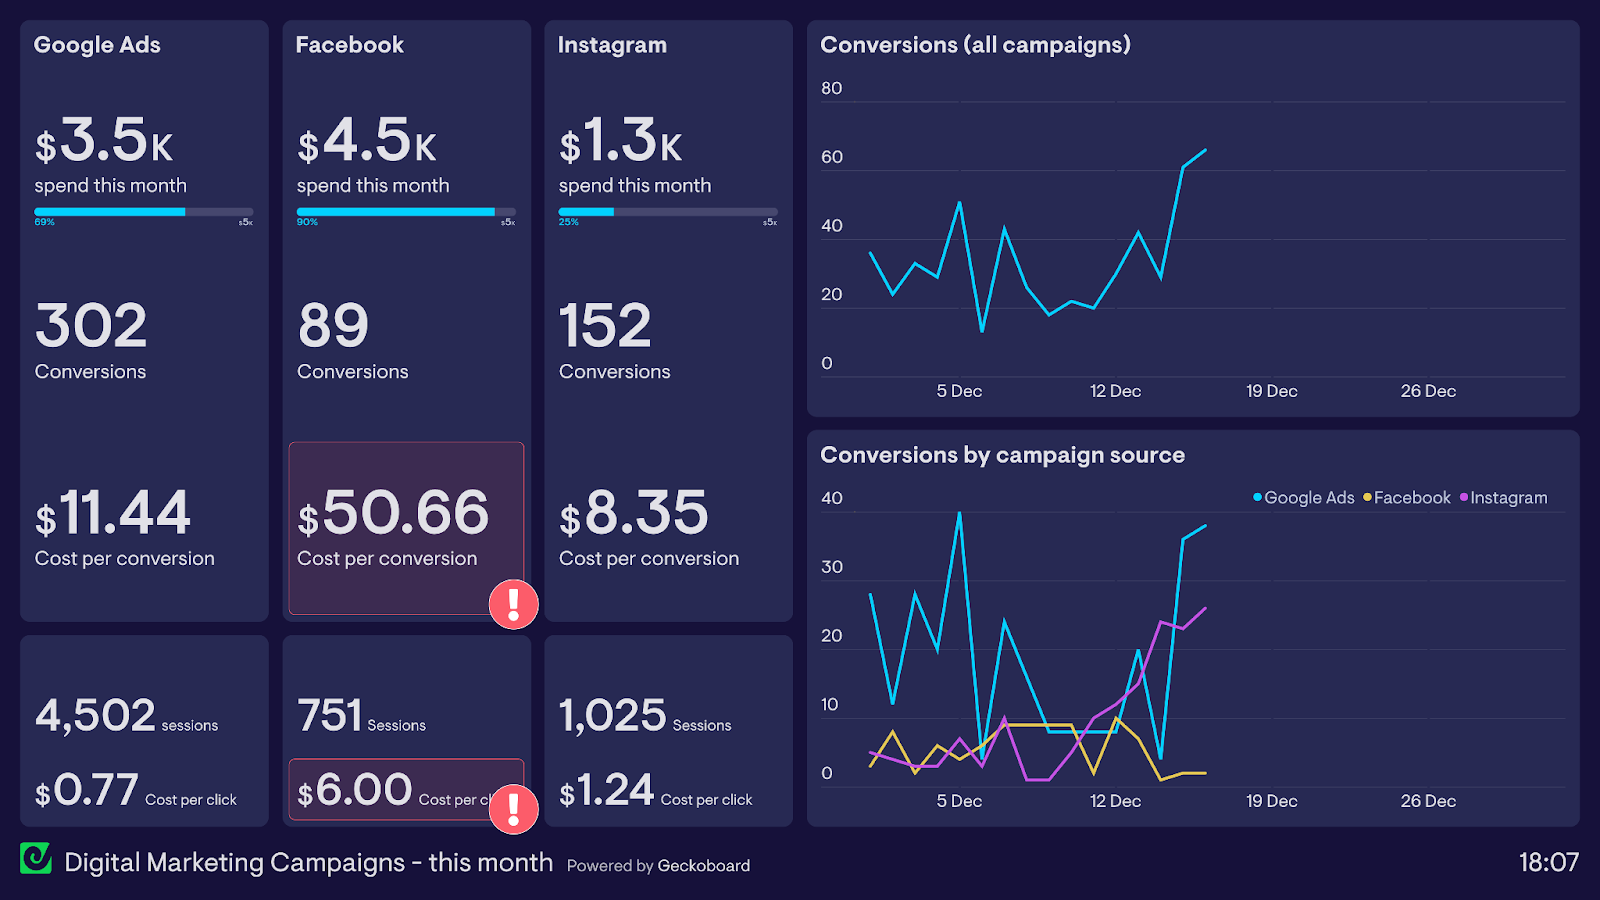
Image source: geckoboard.com
5. Sales rep performance dashboard
A sales rep performance dashboard provides detailed visibility into the activity and productivity of individual sales representatives. It tracks key metrics, including the number of calls made, emails sent, meetings booked, and deals successfully closed. By breaking down performance at the rep level, this dashboard helps managers identify top performers, spot areas where additional support is needed, and design targeted coaching strategies. Tools like Lark make it easy to share these dashboards in real time, guiding incentive programs, fostering accountability, and ultimately boosting team-wide productivity and results.
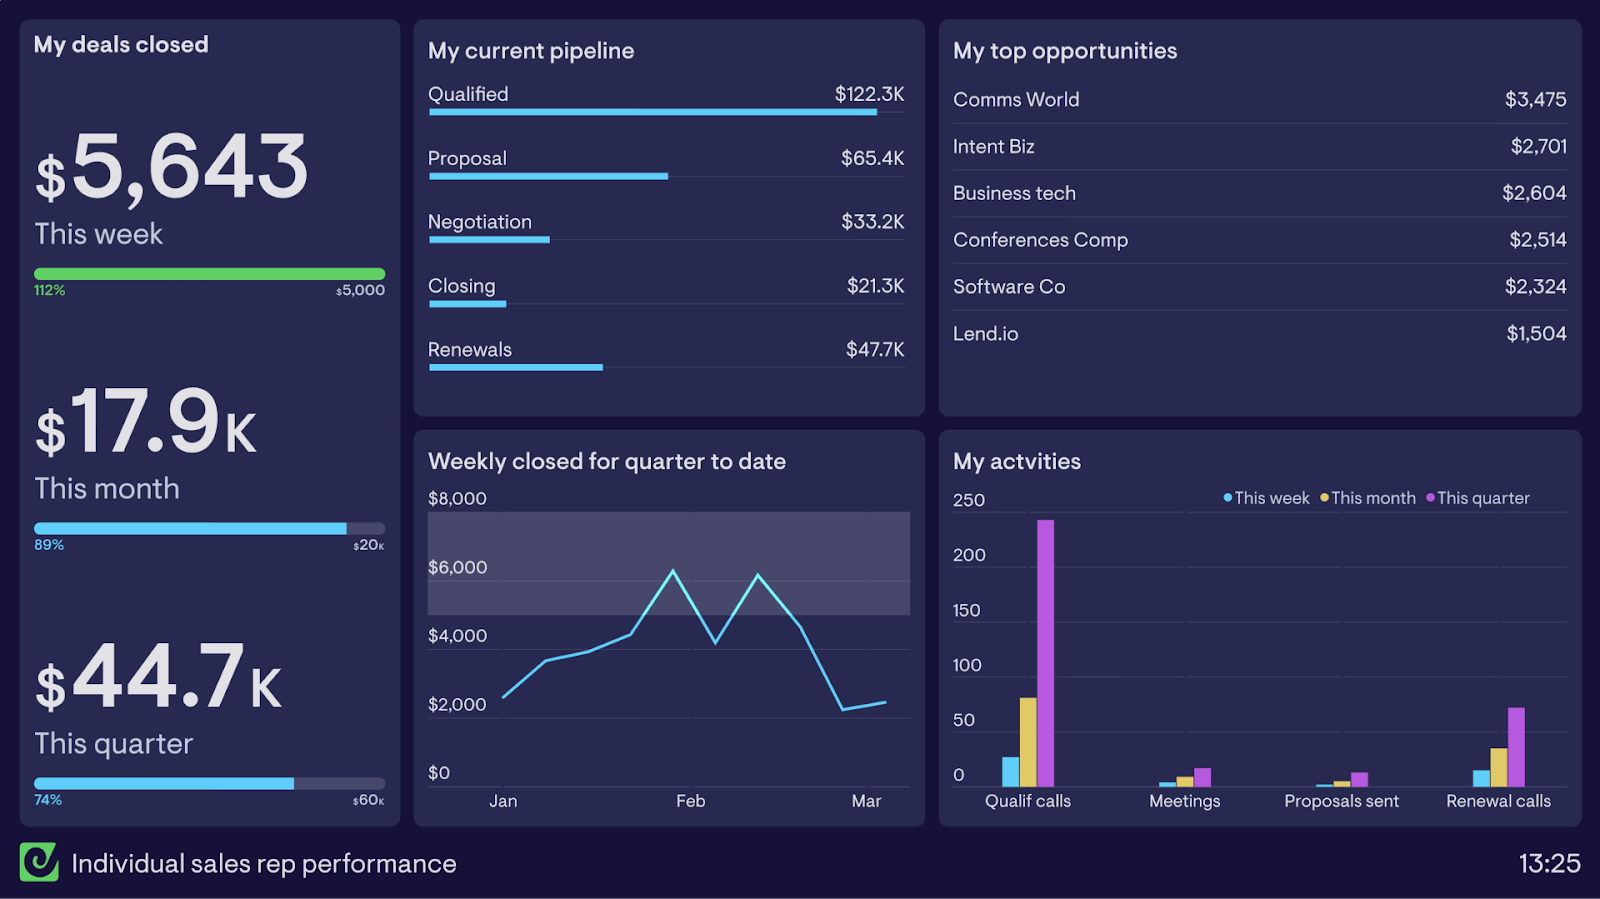
Image source: geckoboard.com
6. Revenue dashboard
A revenue dashboard delivers a high-level view of topline metrics that define overall business health. It focuses on recurring revenue streams such as annual recurring revenue (ARR) and monthly recurring revenue (MRR), while also tracking growth trends and churn rates. For SaaS and retail businesses, this dashboard is indispensable in understanding customer retention and revenue stability. By consolidating these figures into a single view, executives gain instant clarity on performance. With Lark, revenue dashboards can be shared across leadership teams in real-time, enabling faster and more precise strategic decisions.
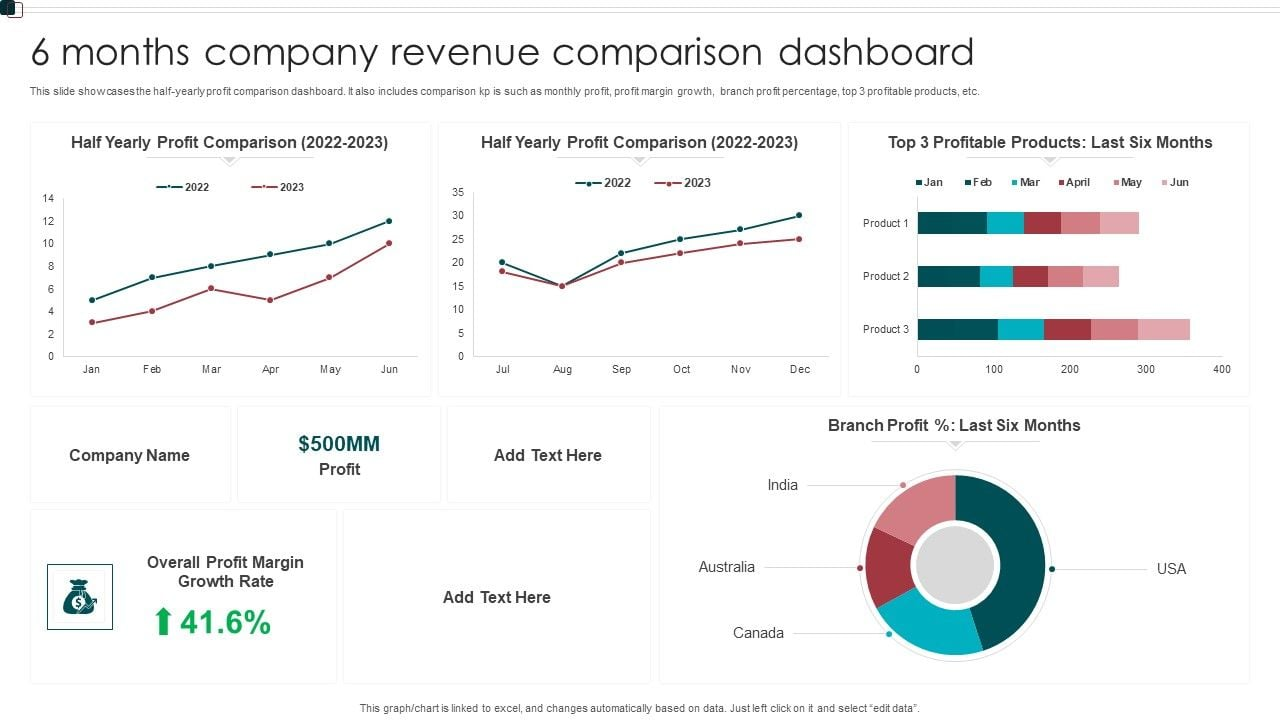
Image source: slidegeeks.com
Free sales dashboard templates to start with
Kickstart your sales tracking with ready-to-use dashboards that simplify performance monitoring, pipeline management, and revenue insights. The free templates listed below make it easy to visualize key metrics and optimize your sales processes.
1. Sales pipeline template
Lark's Sales funnel template lets you visualize every deal as it moves through defined pipeline stages—lead → qualification → negotiation → close. You can configure fields to display deal value, expected close date, and probability score, transforming it into a comprehensive sales pipeline dashboard. Prioritize deals with higher value or risk, spot bottlenecks by stage, and forecast future sales more accurately. Perfect for sales teams that want clarity on which deals require immediate attention. It also enables managers to compare multiple pipelines side by side quickly, making cross-team coordination and decision-making easier.
2. Sales performance dashboard template
Use Lark to build a dashboard that tracks each representative's performance, including deals closed, win rate, and activity metrics (calls, emails, meetings). Break down data by team or region so managers can compare productivity. By using dynamic charts and filters in Lark Sheets or Base, you can drill into underperformers and high achievers. This sales performance dashboard template free approach helps in designing incentive programs and focused coaching. Additionally, it enables real-time updates across teams, ensuring everyone stays aligned on targets without the need for manual reporting.
3. Forecasting dashboard template
A forecasting dashboard in Lark enables leadership to view revenue trends over time, compare forecasts against quotas, and assess pipeline coverage. You can combine historical data to model growth scenarios and use probability scoring to weigh open deals. With regular updates, this dashboard keeps forecasts current to support strategic planning. It also provides a clear visual comparison of projected vs actual revenue, helping executives adjust strategy promptly.
4. Marketing-to-sales funnel template
This template illustrates the progression of leads from marketing to sales, from initial contact (MQLs) to qualified leads (SQLs) to closed deals. Using Lark, you can visualize funnel drop-offs, inspect ROI per campaign, and identify stages where prospects are being lost. This helps to align marketing and sales for better lead quality and smoother handoffs. A strong sales and marketing dashboard ensures every campaign drives pipeline value. Teams can also experiment with A/B campaign data to optimize conversion rates directly within Lark.
5. Lead source analysis template
Track where leads originate, social media, paid ads, referrals, and email campaigns, and see which sources convert best over time. In Lark Base, you can tag leads by source, assign values or weights, and build dashboards to compare channel performance. This allows you to optimize spending, double down on high performers, and eliminate the ineffective ones. It also helps sales and marketing teams quickly identify emerging channels that are outperforming expectations.
6. Customer acquisition cost (CAC) dashboard
Calculate how much you spend (ad costs, marketing, onboarding) to acquire each new customer, and compare that to customer value. With Lark, build views that juxtapose total acquisition spend by period vs the number of new customers acquired. Helps measure profitability and determine whether your growth is sustainable. Often part of bigger sales analytics dashboards or revenue dashboards. You can also monitor CAC trends over time to see the impact of new campaigns or process changes.
7. Revenue by product/service template
Different products or services often contribute variably to revenue. You can build dashboards that display revenue by offering, segment by margin, region, or type (such as subscription vs. one-time). That way, you'll see which product lines are profitable, which need more marketing or resources, and which might require discontinuation. These dashboards also allow executives to forecast the impact of product changes or new launches on overall revenue.
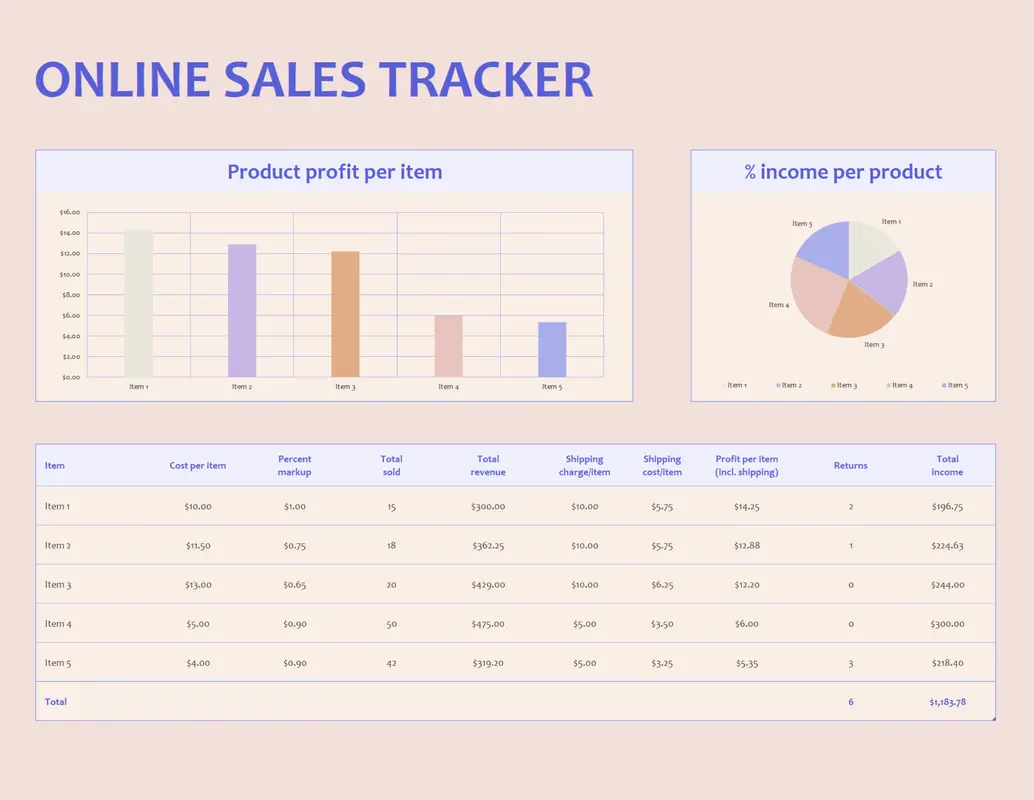
Image source: create.microsoft.com
8. Churn and retention dashboard
This dashboard tracks the number of customers who cancel (churn), the number of renewals, renewal rates, and retention rates over time. For subscription-based models (SaaS, membership, etc.), Lark dashboards can pull data from your CRM or Google Sheets to monitor monthly or annual churn, cohort retention, and related metrics, such as net revenue retention. Helps leadership understand stability and revenue risk. By visualizing churn trends, teams can proactively address customer satisfaction issues before they escalate.
9. Win-loss analysis template
Collect data on why deals are won (features, pricing, timing, relationships) and why they are lost (competition, budget, product mismatch). With this template, representatives can enter win/loss reasons, and dashboards can chart patterns over time. Understanding these causes enables you to adjust your sales playbook, product messaging, pricing, or training accordingly. Tied strongly to improving win rates and forecasting accuracy. Managers can quickly identify recurring reasons for loss and implement process changes to reduce lost opportunities.
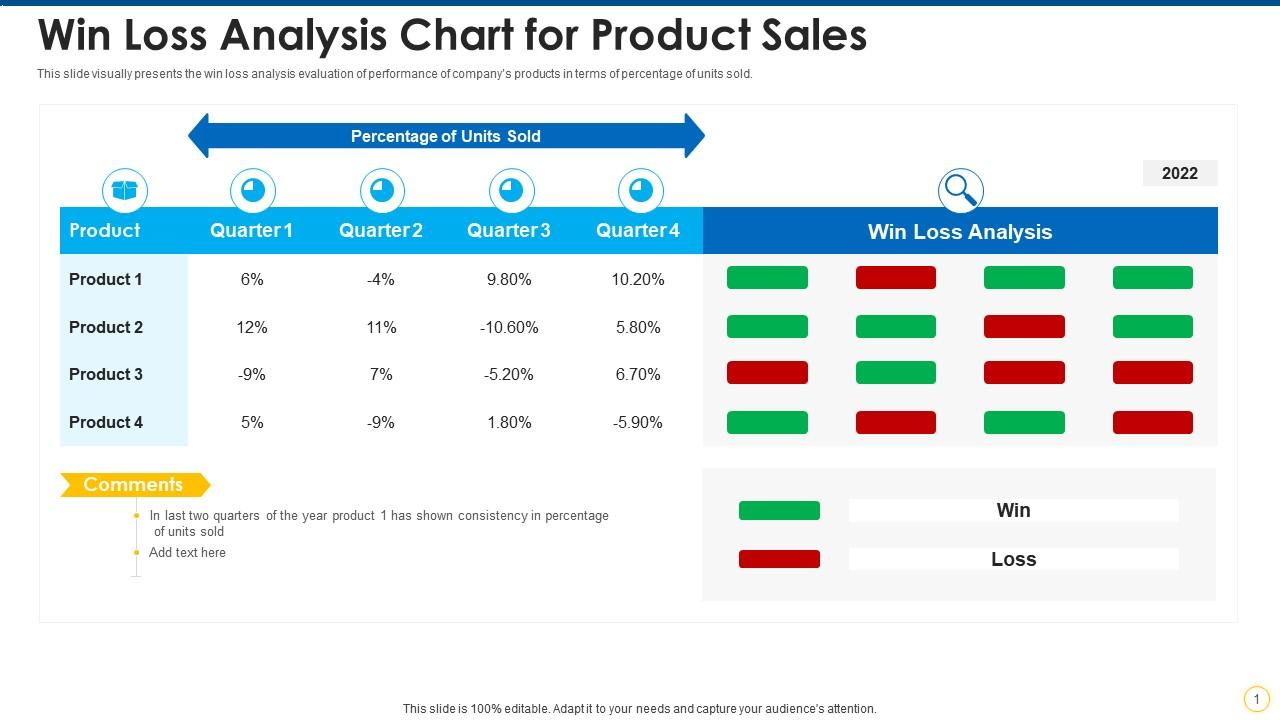
Image source: slideteam.net
10. Territory or region sales template
Compare sales results by region, country, or territory using Lark's filtering & grouping features. Track revenue, deal volume, average deal size, and growth rates per territory. This helps identify which regions are underperforming or overachieving, allowing you to allocate budget, hiring, or incentives accordingly. Useful for scaling companies with distributed sales teams. It also allows leadership to set realistic regional targets based on historical performance and market potential.
11. Quota attainment dashboard
This template displays the progress of each representative or team toward their quota, including the percentage complete, projected shortfall, or overperformance. With Lark's dashboards, set up visual indicators (e.g., progress bars, colored alerts) to quickly see who is on track. Motivates underperforming reps and rewards those excelling. Also helpful for leadership to forecast whether targets will be met at the end of the period. By tracking quota attainment in real time, managers can intervene early to adjust strategies and avoid last-minute shortfalls.
12. Customer lifetime value (CLV) dashboard
CLV dashboards estimate the total revenue a customer is expected to generate over their lifetime, factoring in purchase frequency, average order value, retention rates, upsells, and other relevant factors. Using template, you can combine data sources to model CLV, then monitor trends over time. Helps in making decisions about customer acquisition budgets, product development, and retention strategies in sales metrics dashboards. It also allows teams to segment high-value customers and tailor engagement strategies for maximum long-term profit.
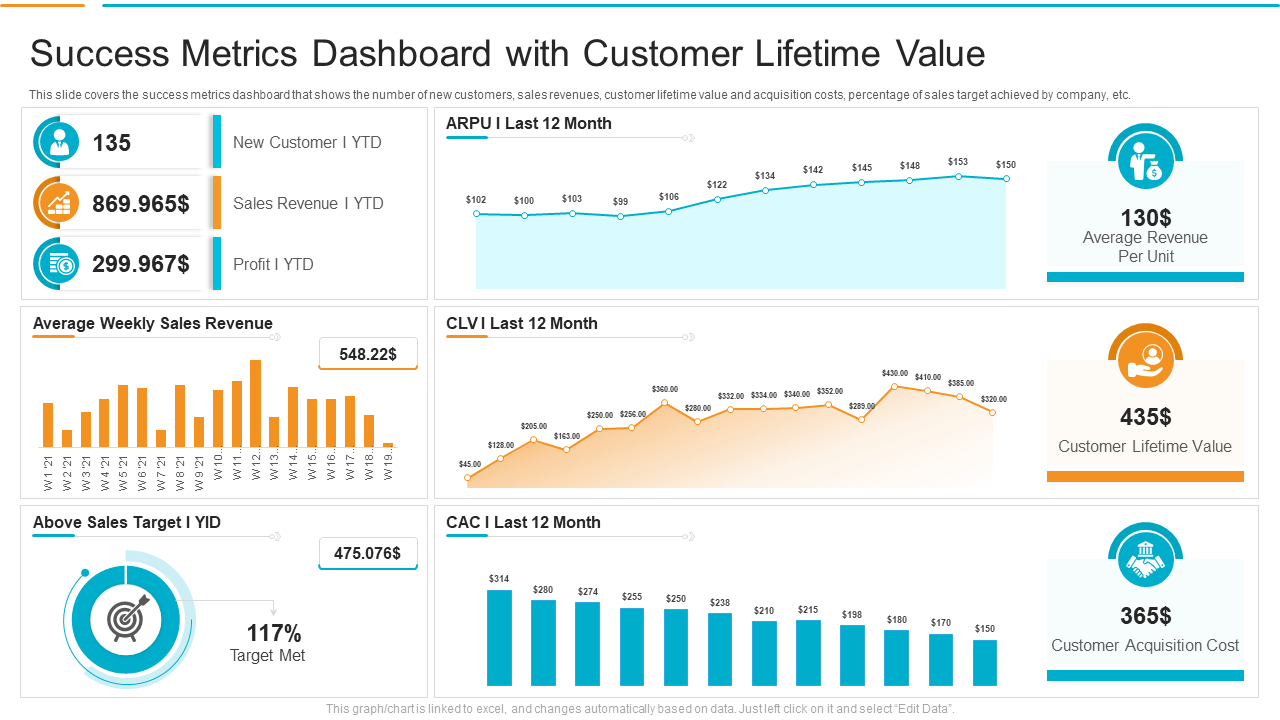
Image source: slideteam.net
How to build your own sales dashboard in Lark
- Choose KPIs that align with goals: Start by selecting the most relevant metrics that reflect your sales strategy, such as revenue growth, win rate, or conversion rates. Choosing the right KPIs ensures your sales dashboard delivers meaningful insights that guide both individual and team performance.
- Import or connect your sales data: Bring in data from CRM systems, spreadsheets, or marketing platforms to centralize all sales information in one place. With Lark, connecting data sources allows you to create a dynamic sales data dashboard that updates automatically, reducing manual work.
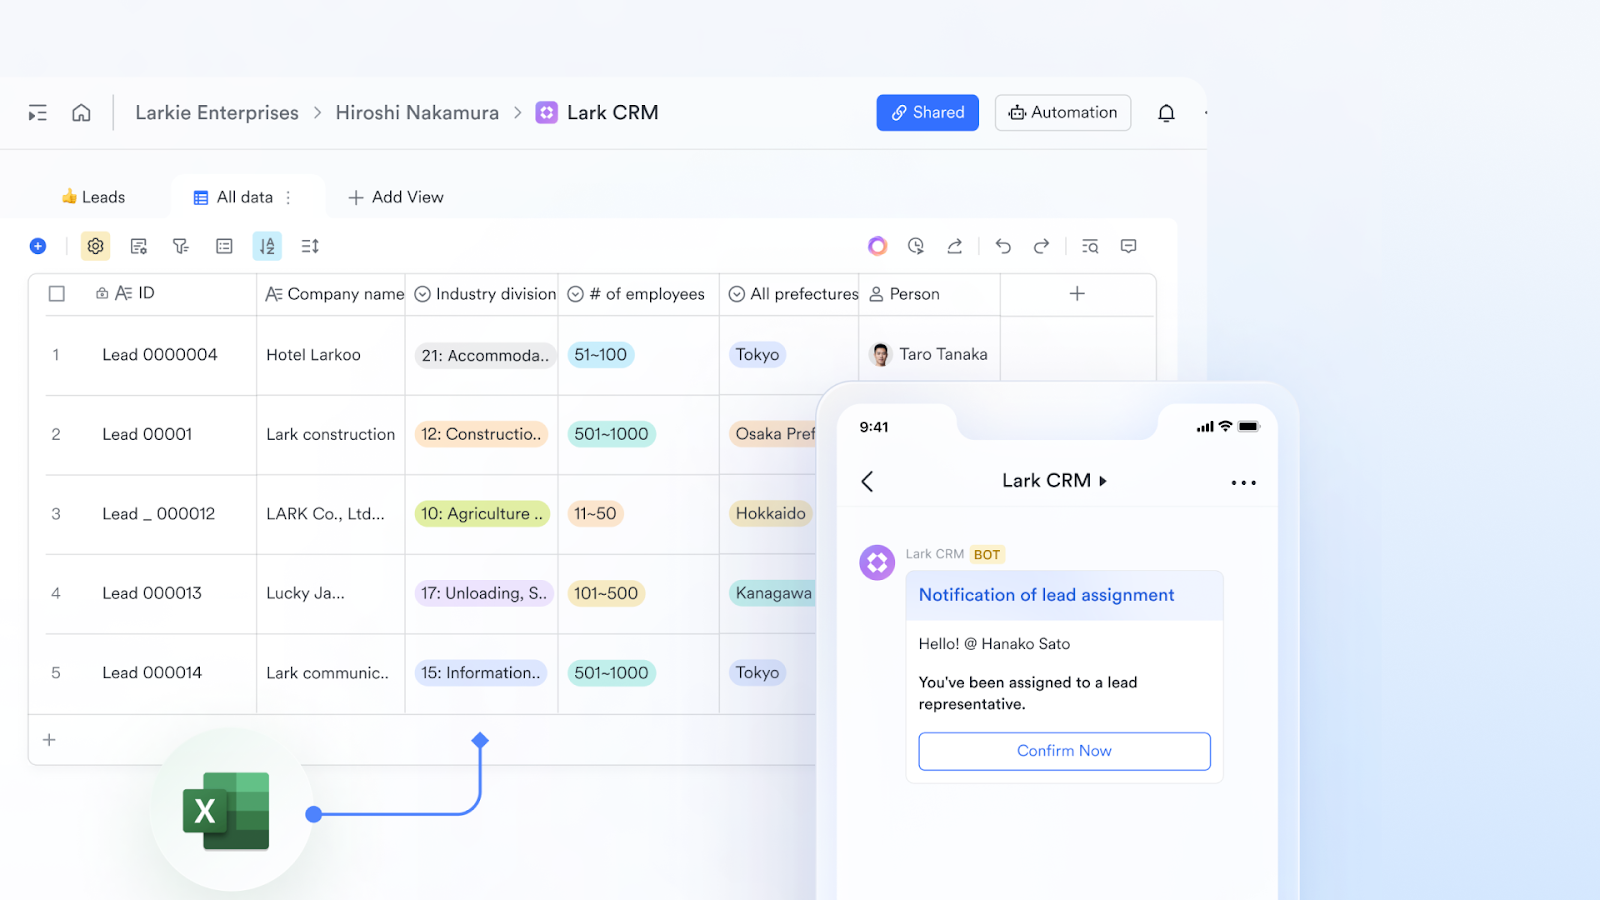
- Pick a dashboard template: Lark offers ready-to-use templates for tracking pipelines, forecasting revenue, and monitoring team KPIs. Selecting a template lets you quickly visualize metrics in a structured sales performance dashboard template, saving setup time and standardizing reporting.
- Customize charts and filters: Tailor your dashboard to show the most important insights with bar charts, line graphs, tables, and interactive filters. Customization ensures every team member sees relevant data, making your sales analytics dashboard actionable for daily decision-making.
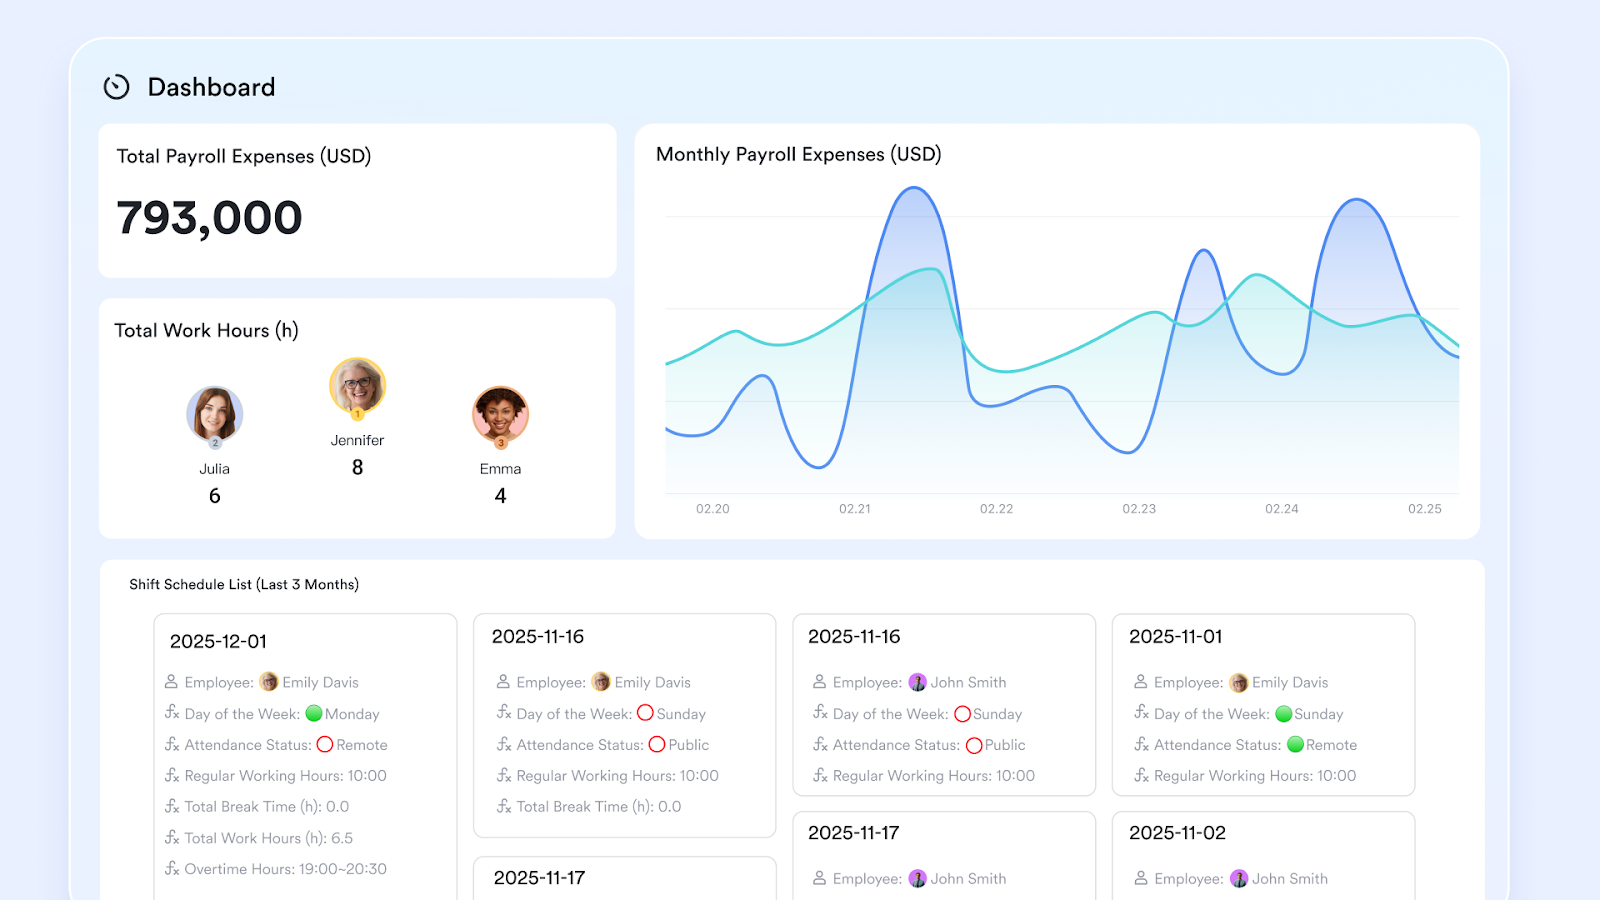
- Share dashboards in real-time: Distribute dashboards across teams instantly via Lark Base or Sheets, so reps and managers can track progress simultaneously. Real-time collaboration enhances transparency, ensuring your real-time sales dashboard drives accountability and facilitates faster decision-making.
Why Lark makes dashboards actionable
- Connect with tasks & OKRs: Lark links dashboards directly to tasks, project approvals, and OKRs, turning data into actionable insights. This integration makes sales dashboards more than reports; it drives accountability and goal alignment.
- Automate updates: Lark's workflows automatically refresh dashboards as new data becomes available, eliminating the need for manual reporting. Your sales metrics dashboard consistently reflects real-time performance, enabling accurate and timely decisions.
- Collaborate in Base & Sheets: Teams can edit, comment, and filter dashboards directly in Lark Base or Sheets, making your sales performance dashboard template free, interactive, and team-friendly.
- Share instantly: Share dashboards via Lark chat or meetings to give reps and managers real-time access. A real-time sales dashboard improves decision-making and alignment across teams.
- Starter plan: Free forever plan that includes 11 powerful tools for up to 20 users. It also comes with 100GB of storage, 1000 automation runs, AI translations, and more.
- Pro plan: $12/user/month (billed annually) for up to 500 users. It includes everything in Starter plus a group calling for up to 500 attendees, 15TB of storage, 50,000 automation runs, and more.
- Enterprise plan: Contact sales for custom pricing. Supports unlimited users and includes even more automation runs and advanced security, compliance, and management features.
Conclusion
In summary, sales dashboards transform raw data into actionable insights, helping teams track performance, monitor pipelines, forecast revenue, and align marketing and sales efforts. From sales performance dashboards to real-time sales dashboards, the right tools empower managers, reps, and executives to make faster, smarter decisions. With Lark, building, customizing, and sharing interactive dashboards is simple, whether you’re tracking KPIs, forecasting trends, or analyzing lead sources. By leveraging Lark’s templates and real-time collaboration features, your sales team can stay aligned, accountable, and focused on driving measurable growth, turning data into results.
FAQs
What’s the difference between a sales performance dashboard and a sales forecast dashboard?
A sales performance dashboard focuses on tracking current KPIs, team activity, and results against targets. In contrast, a sales forecast dashboard predicts future revenue based on pipeline and historical data. Performance dashboards measure what has happened, while forecast dashboards project what is likely to happen. Using Lark, you can create both dashboards in one platform, with real-time updates and customizable templates to monitor progress and plan.
Which metrics belong in a sales team dashboard vs. a sales rep dashboard?
A sales team dashboard highlights collective metrics such as total revenue, overall win rate, and team-wide activity trends. A sales representative's dashboard, on the other hand, focuses on individual KPIs, such as calls made, emails sent, and deals closed. Both provide insights, but at different levels of depth. With Lark, you can create separate dashboards for teams and representatives while keeping data centralized and interactive for improved visibility.
Can I connect a CRM sales dashboard to my existing tools?
Yes, modern dashboards can integrate with CRMs, spreadsheets, and other data sources to consolidate sales information. This connection ensures that metrics are up-to-date and eliminates the need for manual data entry. Lark supports seamless integration with popular CRMs and other tools, allowing your sales dashboards to automatically pull in the latest data for accurate, real-time reporting.
Can dashboards support sales forecasting automatically?
Dashboards can calculate forecasts by using pipeline data, historical trends, and probability scoring of deals. Automated forecasting helps leaders make data-driven decisions without relying solely on manual projections. In Lark, you can set up forecasting dashboards that update automatically as new deals are added, providing a reliable, dynamic view of expected revenue.
What is the best dashboard for sales performance in small businesses?
For small businesses, a dashboard that combines pipeline tracking, representative activity, and revenue metrics is ideal. It helps managers monitor growth without overwhelming them with unnecessary data. Lark offers free, easy-to-use templates and customizable sales performance dashboard templates, making it simple for small teams to track results and optimize processes efficiently.
How can a real-time sales dashboard improve decision-making?
Real-time dashboards provide immediate visibility into sales activity, enabling managers to identify bottlenecks, prioritize deals, and adjust strategies in real-time. They reduce delays in reporting and improve responsiveness. With Lark, real-time dashboards update automatically, enabling teams to collaborate, share insights instantly, and make informed decisions more quickly.
Related reading
Table of contents
Start using Lark today

Manage all your work in one place
Boost team efficiency by 10x
Save up to 70% on software costs
Table of contents
Start using Lark today
Manage all your work in one place
Boost team efficiency by 10x
Save up to 70% on software costs
Keep reading









2026 Lark Technologies Pte. Ltd.
Headquartered in Singapore with offices worldwide.






Explore: