


How to Calculate EAC: A Complete Guide for Project Managers

Cecilia Lane
Go-to-Market Associate
Aug 5, 2026
Cecilia Lane
Aug 5, 2026

20 min read


In project management, staying on top of costs can often feel like navigating shifting ground. Teams need reliable forecasts to make decisions confidently — and that's exactly where EAC (Estimate at Completion) comes in. Understanding how to calculate EAC in project management helps predict the total cost of a project based on real progress, making it one of the most practical tools in Earned Value Management (EVM).
In this guide, you'll learn not only how to calculate the EAC step by step, but also how to interpret its results and use them to adjust your project strategy. We'll also explore how modern collaborative tools, like Lark, can make tracking and updating EAC more seamless across your entire team.
What is EAC and why it matters in project management
Estimate at Completion (EAC) represents the forecasted total cost of your project once it's finished. While the Budget at Completion (BAC) gives you what the project was planned to cost, EAC shows what it will actually cost, based on current spending and performance.
In essence, EAC bridges the gap between planning and reality. It's especially useful when cost or schedule performance drifts from the original baseline, allowing you to understand whether you're trending over or under budget before reaching the finish line.
- Real-time budget visibility: It highlights deviations early so decision-makers can intervene before overspending grows.
- Performance insight: By comparing the EAC to BAC, managers can measure efficiency, often through metrics like Cost Performance Index (CPI) and Schedule Performance Index (SPI).
- Data-driven decisions: Continually updated EAC helps guide adjustments in resourcing, scheduling, or scope.
Project teams often calculate EAC in tools like Excel or project management software, but understanding the concept manually builds financial intuition. Once you grasp this foundation, you can automate EAC calculation in your reporting systems—whether using spreadsheets, financial calculators, or integrated platforms such as Lark and Basecamp.

Understanding the components of EAC calculation
To master how to calculate EAC from NPV (net present value) or CPI-based metrics, you first need to understand the components that form the formula. Each input plays a specific role in determining how reliable your forecast is.
- Budget at completion (BAC)
- The BAC represents the total planned cost of the project — essentially, what your budget should be if everything goes according to the initial plan. It's the anchor point against which all progress and expenditures are compared. When BAC is defined clearly at the start, calculating EAC later becomes more accurate because all variances relate back to this baseline.
- Earned value (EV)
- Earned Value expresses the work actually completed, translated into cost terms. For instance, if 50% of your project tasks are completed, your EV equals 50% of the BAC. This allows you to compare planned versus actual progress financially, not just in physical deliverables.
- Actual cost (AC)
- Actual Cost accounts for all expenditures so far — materials, labor, overheads, and other expenses. Inaccurate or delayed AC tracking often leads to misleading EAC figures. In practice, many teams use Excel models or accounting integrations to keep AC updated in real time.
- Performance indexes: CPI and SPI
- These two efficiency metrics are foundational to EAC formulas:
- Cost Performance Index (CPI): Measures cost efficiency; how much value you get for each dollar spent.
- Schedule Performance Index (SPI): Reflects how efficiently time is being used relative to the plan.
High CPI/SPI values indicate strong performance; low values signal cost or schedule risks. By combining them, project managers forecast new completion costs that reflect reality rather than original estimates.
Together, BAC, EV, AC, CPI, and SPI form the backbone of any EAC formula — whether you're working out how to calculate EAC on BA II Plus, in Excel, or using an enterprise system. These figures transform day-to-day spending data into a living forecast that evolves with your project.
How to calculate EAC: A step-by-step guide
Learning how to calculate EAC project management style means understanding not just mathematics but decision context. EAC isn't one fixed formula; it's adaptable based on how your project performs. Here's how to calculate it — logically and confidently.
Step 1. Understand what EAC measures
EAC forecasts the final cost of your project, assuming current spending patterns continue. It answers a single vital question: If we keep performing this way, how much will the entire project cost when done?
For instance, a project running 10% over budget today might not end 10% over if conditions improve, and EAC helps you test those scenarios.
Step 2. Gather your data
Before you begin, make sure these values are up to date:
- BAC (Budget at Completion)
- EV (Earned Value)
- AC (Actual Cost)
- CPI and SPI (Performance Indexes)
You can get these figures from your project finance or tracking reports. If you use specialized software like Microsoft Project, Primavera, or Lark, these values can populate automatically.
Step 3. Choose the right EAC formula
Different conditions require different EAC formulas. Each gives a slightly different cost forecast depending on performance assumptions. Understanding these scenarios helps you decide which to apply.
- When cost performance is steady: EAC = BAC / CPI
- Use this if you expect current cost efficiency to remain unchanged.
- When early cost issues won't continue: EAC = AC + (BAC − EV)
- Suitable when past performance is not representative of future work.
- When cost and schedule both matter: EAC = AC + (BAC − EV) / (CPI × SPI)
- The balanced approach — use when time delays and cost inefficiencies interact.
- When recalculating from scratch (bottom-up): EAC = AC + ETC
- Here, ETC (Estimate to Complete) represents a fresh forecast of remaining costs based on updated planning.
If you're using a financial calculator like BA II Plus, or calculating EAC alongside NPV, the logic is the same — you're deriving an updated total cost forecast built from cost performance data.
Step 4. Perform and validate the calculation
Once you insert your values, compute the result and verify whether the forecast aligns with observed trends. If EAC largely exceeds your BAC, you may be heading over budget. If it's lower, efficiency improvements or scope reductions may be driving savings.
Step 5. Interpret and communicate the outcome
EAC is most powerful when discussed across teams — finance, operations, and leadership. Consider integrating results into shared dashboards or reports so stakeholders can see real-time progress. Collaborative platforms like Lark or Basecamp make it easier to centralize this information and update EAC without version-control chaos.
EAC vs ETC vs BAC: Understanding their relationship
Project managers often come across several acronyms that describe budget and cost performance, and it's easy to confuse them. Understanding how EAC (Estimate at Completion) interacts with ETC (Estimate to Complete) and BAC (Budget at Completion) is key to interpreting your project's financial health accurately.
- BAC (Budget at Completion): The total planned expenditure for the project. It's what you expected to spend before work began.
- EAC (Estimate at Completion): The revised forecast showing what the project will probably cost once finished, based on current performance data.
- ETC (Estimate to Complete): The forecast cost of remaining work — basically, what it will take to reach completion from today onward.
Think of it this way: EAC = AC (Actual Cost so far) + ETC (Expected cost to finish).
When your project is running smoothly, EAC and BAC will stay close. If you see EAC significantly higher than BAC, that's a red flag indicating your final cost will exceed the original budget.
Knowing how to calculate EAC project management style and relate it to ETC helps detect and correct financial drift early. It allows project teams to act decisively—reducing waste, reallocating resources, or revising scope before financial damage occurs.
When and how often you should recalculate EAC
EAC is not a one-time calculation. Projects evolve, and so do their costs. To ensure accuracy, you should regularly update your EAC whenever new data changes the cost outlook. In practice, knowing how to calculate EAC in project management means also knowing when to refresh your numbers.
When to recalculate
Recalculation is valuable when:
- Scope changes: New features, compliance requirements, or change orders can alter total cost.
- Major schedule shifts occur: Delays influence both direct and indirect costs.
- Performance metrics fluctuate: A lower CPI or SPI signals decreasing efficiency, prompting an updated forecast.
- Resource or vendor rates change: Fluctuating labor or material costs impact future expenditures.
How often to update
The frequency depends on project complexity and budget volatility:
- For high-value or high-risk projects, calculate EAC monthly or at each major milestone.
- For smaller teams, weekly monitoring may be sufficient.
- Automated tools or dashboards can run EAC recalculations continuously as cost data streams in.
Regularly revisiting your forecast shows how to calculate the EAC not just an academic exercise, but a living routine in financial stewardship. Consistency ensures that everyone from the project manager to the finance team bases decisions on current, credible numbers.
Common mistakes to avoid when calculating EAC
Even experienced managers can miscalculate when applying EAC concepts. Understanding the pitfalls helps maintain accuracy and credibility in your project reporting.
- Using outdated data: Relying on previous cost or earned value data undermines precision. Always compute EAC using the latest EV, AC, CPI, and SPI values to reflect the project's most recent state.
- Applying the wrong formula: Each EAC formula has context. Using the simple EAC = BAC / CPI in a project with known schedule delays, for example, disregards critical schedule impacts. Select the formula that matches your performance pattern.
- Ignoring indirect or overhead costs: Costs like administrative support or shared resources may not appear in direct expenditure reports. Excluding them leads to underestimating the Estimate at Completion.
- Overcomplicating the forecast: EAC is meant to clarify, not confuse. Adding unnecessary variables or tweaking formulas too often introduces noise rather than insight.
- Failing to communicate results: An accurate calculation is meaningless if it isn't shared. Integrating forecasts into reports or tools like Lark helps ensure that all stakeholders understand budget trends and can respond promptly.
Avoiding these mistakes ensures that when you present your EAC, whether you've calculated it manually, in Excel, or on a financial calculator like the BA II Plus, your team can trust it as an actionable forecast—not just a number on a spreadsheet.
Tools and strategies for easier EAC calculation
Accurately forecasting project costs requires both sound methodology and effective tools. While the formulas remain the same, the way you manage and visualize data can dramatically improve your understanding of how to calculate EAC in project management and communicate the results across teams.
Building transparent and automated cost data systems
Lark, one of the most versatile project management tools, is an all-in-one collaboration platform designed to unify communication, project management, and data tracking in a single workspace—helping teams stay aligned and efficient even as projects grow more complex. Within this ecosystem, Lark Base acts as a customizable data management hub where teams can store, calculate, and visualize project cost information in real time.
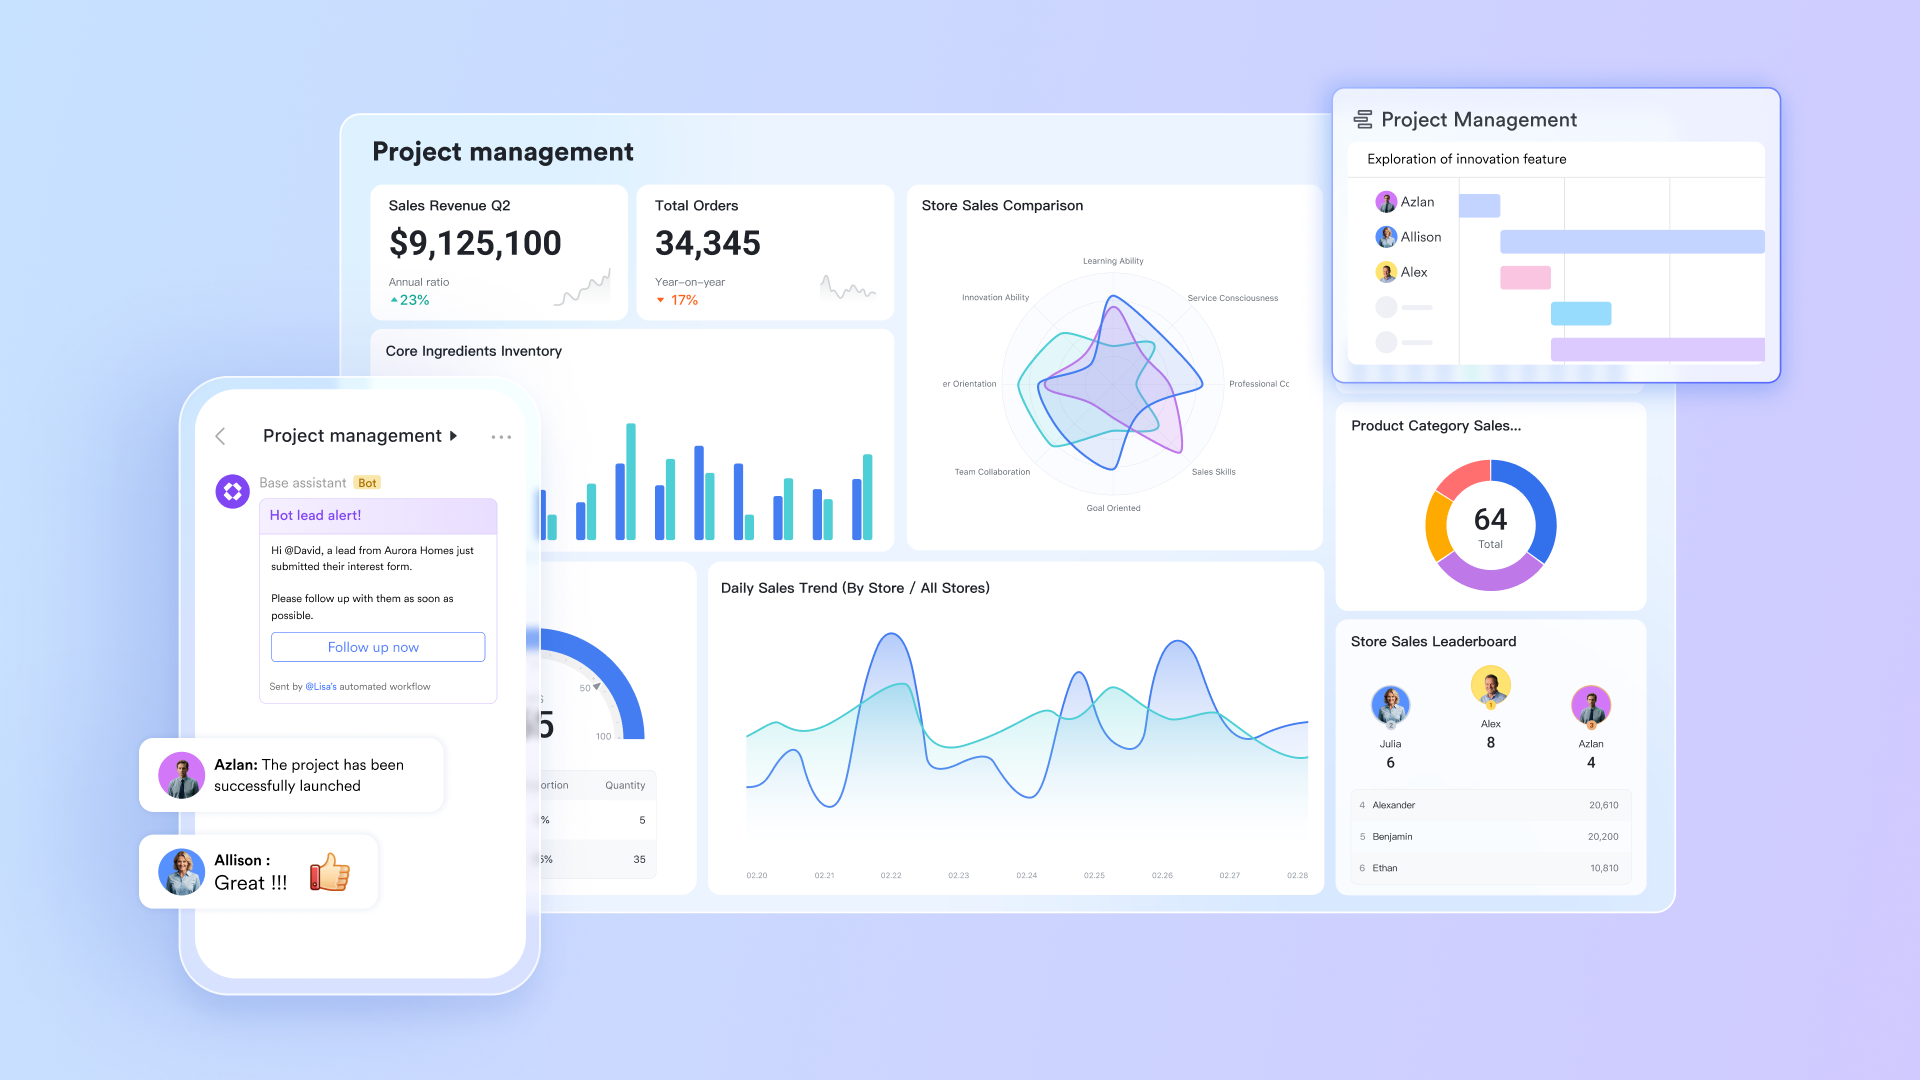
Calculating EAC with powerful dashboards in Lark Base
By using Lark Base to record BAC, EV, AC, and related metrics, project managers can automatically generate EAC (Estimate at Completion) calculations through formula fields—eliminating the need to jump between spreadsheets or static tools. Its data visualization features, such as dynamic charts and dashboards, allow teams to see cost trends clearly, identify performance deviations, and anticipate overspending early.
More importantly, Base's automation workflows ensure that every time a new cost entry or earned value update is logged, the EAC recalculates instantly and notifications can be triggered by relevant stakeholders. This creates a transparent, automated system for cost forecasting, turning EAC analysis into a continuously updated, team-wide insight rather than a one-time report.
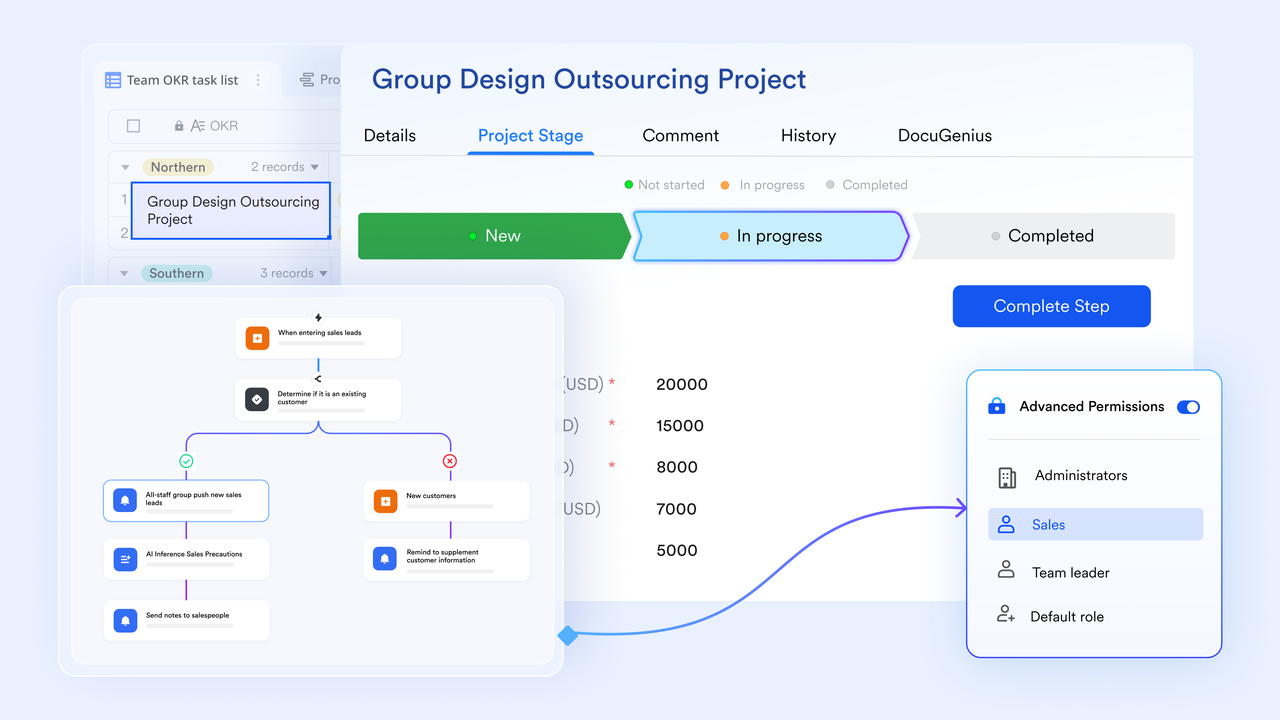
Lark Base also offers multiple views that help teams interpret project cost data from different perspectives. You can switch between table view for structured data entry, Kanban view to visualize progress stages, Gantt view for time-based tracking, and chart view to monitor cost trends and EAC variance at a glance. These flexible layouts make it easier to analyze how actual costs and earned value evolve throughout the project lifecycle.
In this way, Lark Base transforms the process of calculating EAC into a living, collaborative part of your project workflow—keeping everyone informed, consistent, and proactive about financial outcomes.

Utilizing Lark Sheets for EAC Calculation
Lark Sheets enhances the EAC calculation process by providing a powerful platform for collaborative, real-time data management. With its intuitive interface, users can create customized spreadsheets that automatically update as new data is entered, ensuring that EAC figures are always current. The ability to integrate formulas and run calculations directly in Lark Sheets allows teams to test various EAC scenarios instantly, making it easier to strategize around budget adjustments and performance metrics.
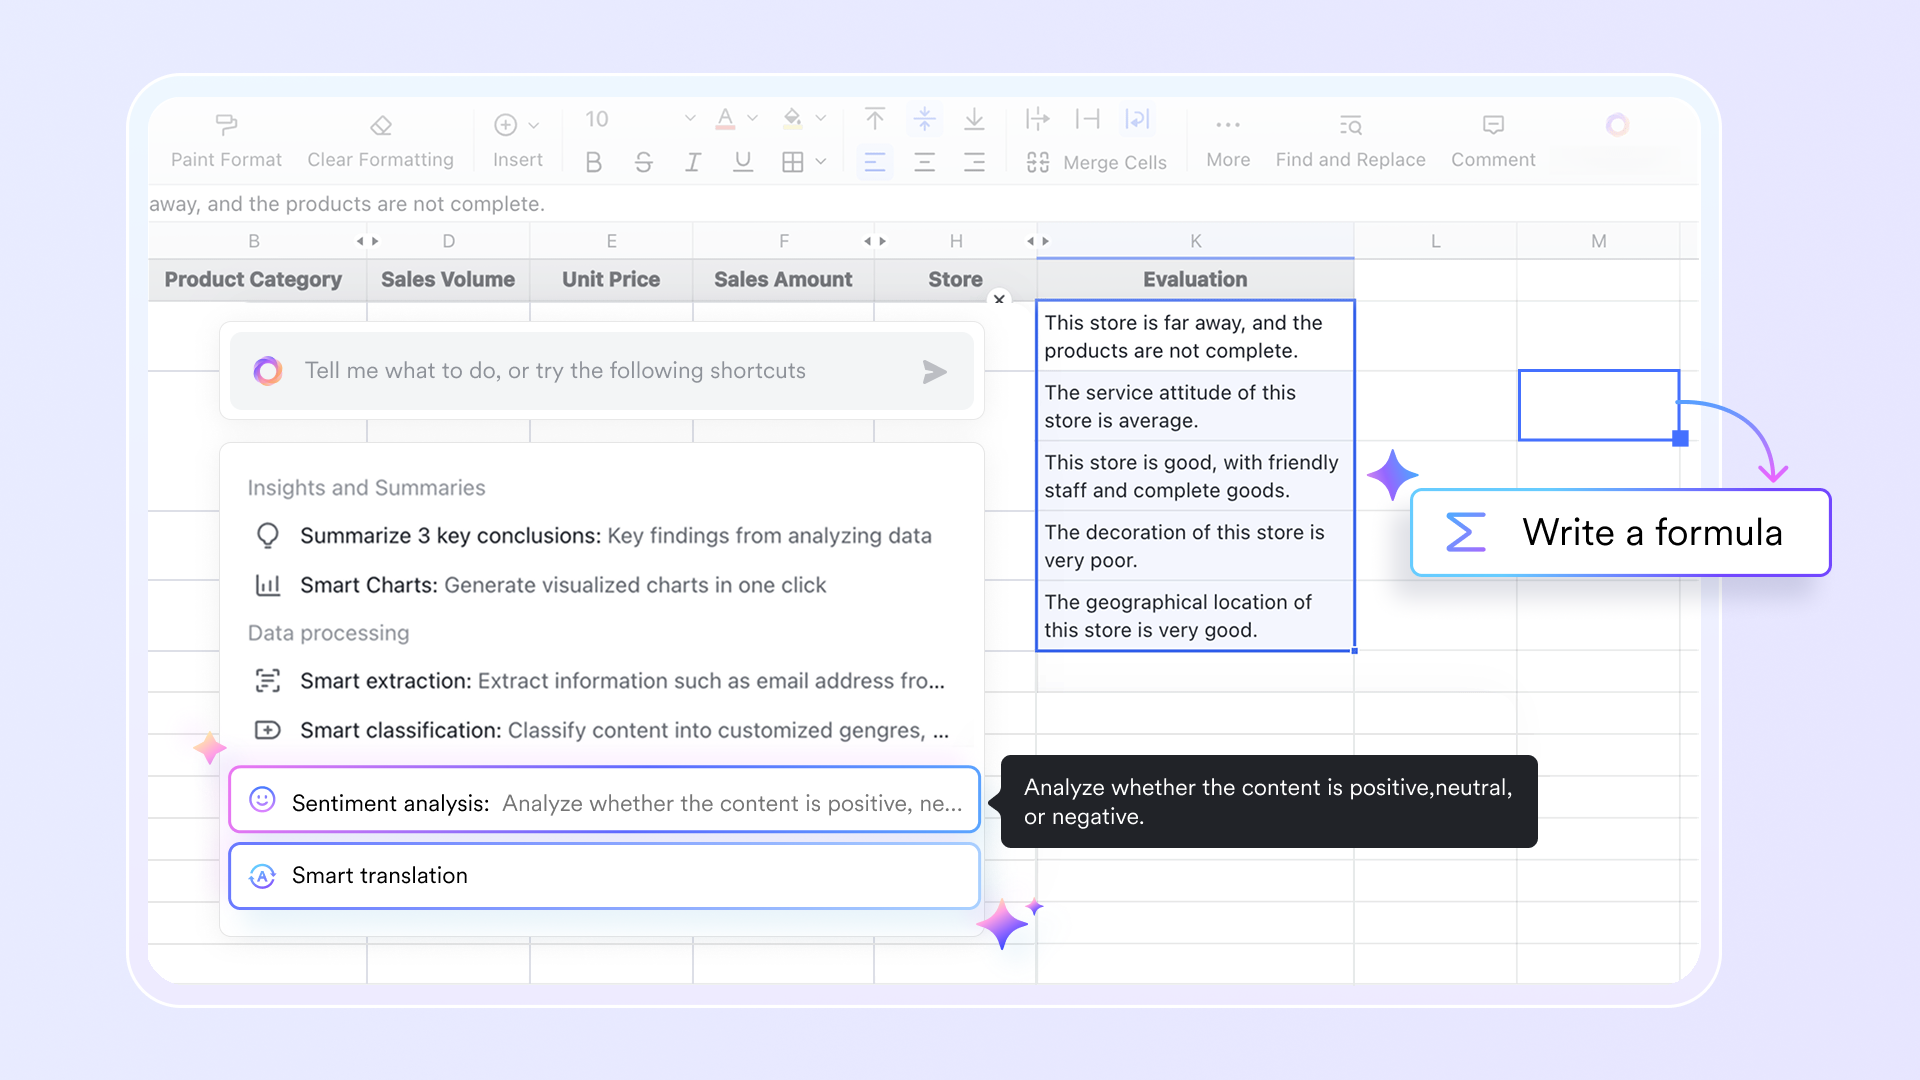
Moreover, Lark Sheets supports features like conditional formatting and data visualization, which help project managers quickly identify variances and trends in budget performance. For example, as project costs change, stakeholders can use visual dashboards to track how these changes impact EAC calculations throughout the project lifecycle. This dynamic functionality not only simplifies the EAC computation process but also fosters collaboration among team members, ensuring that everyone has access to the latest financial insights and can align on decision-making rapidly. Lark Sheets' pivot table also helps teams to visualize cost allocation.
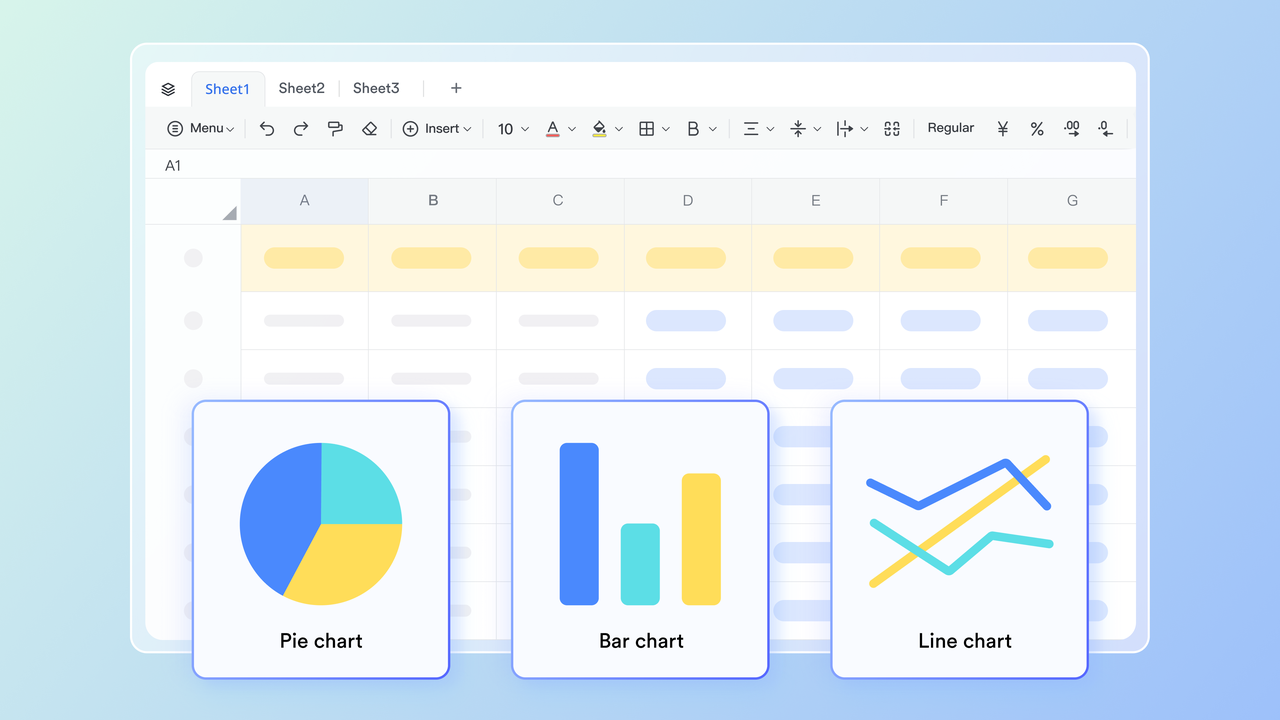
By leveraging Lark Sheets and Lark Base, teams can transform their approach to calculating EAC from a manual, error-prone task into a streamlined element of their ongoing project management workflow.
- Starter plan: Free forever plan that includes 11 powerful tools for up to 20 users. It also comes with 100GB of storage, 1000 automation runs, AI translations, and more.
- Basic plan: $6/user/month (billed annually) for up to 500 users, including everything in Starter plus 1-on-1 video meetings, 5TB of storage, 1,000 automation runs, and more. To know more about Basic plan, contact sales.
- Pro plan: $12/user/month (billed annually) for up to 500 users. It includes everything in Basic plus a group calling for up to 500 attendees, 15TB of storage, 50,000 automation runs, and more.
- Enterprise plan: Contact sales for custom pricing. Supports unlimited users and includes even more automation runs and advanced security, compliance, and management features.
Try Lark's savings calculator: Switching to Lark's Pro plan can lead to significant cost savings— for example, a 100-employee company using Slack, Google Workspace, and Airtable could save approximately $25,200 annually by consolidating their tools with Lark.
Using spreadsheets for quick analysis in Excel or Google Sheets
Many project managers start by learning how to calculate EAC in Excel, as it provides a transparent, flexible environment to experiment with formulas and scenarios. You can create custom columns for BAC, EV, AC, CPI, and SPI, and then apply different EAC calculation formulas to see how each scenario impacts your total cost projection.
Excel: Precision and advanced control
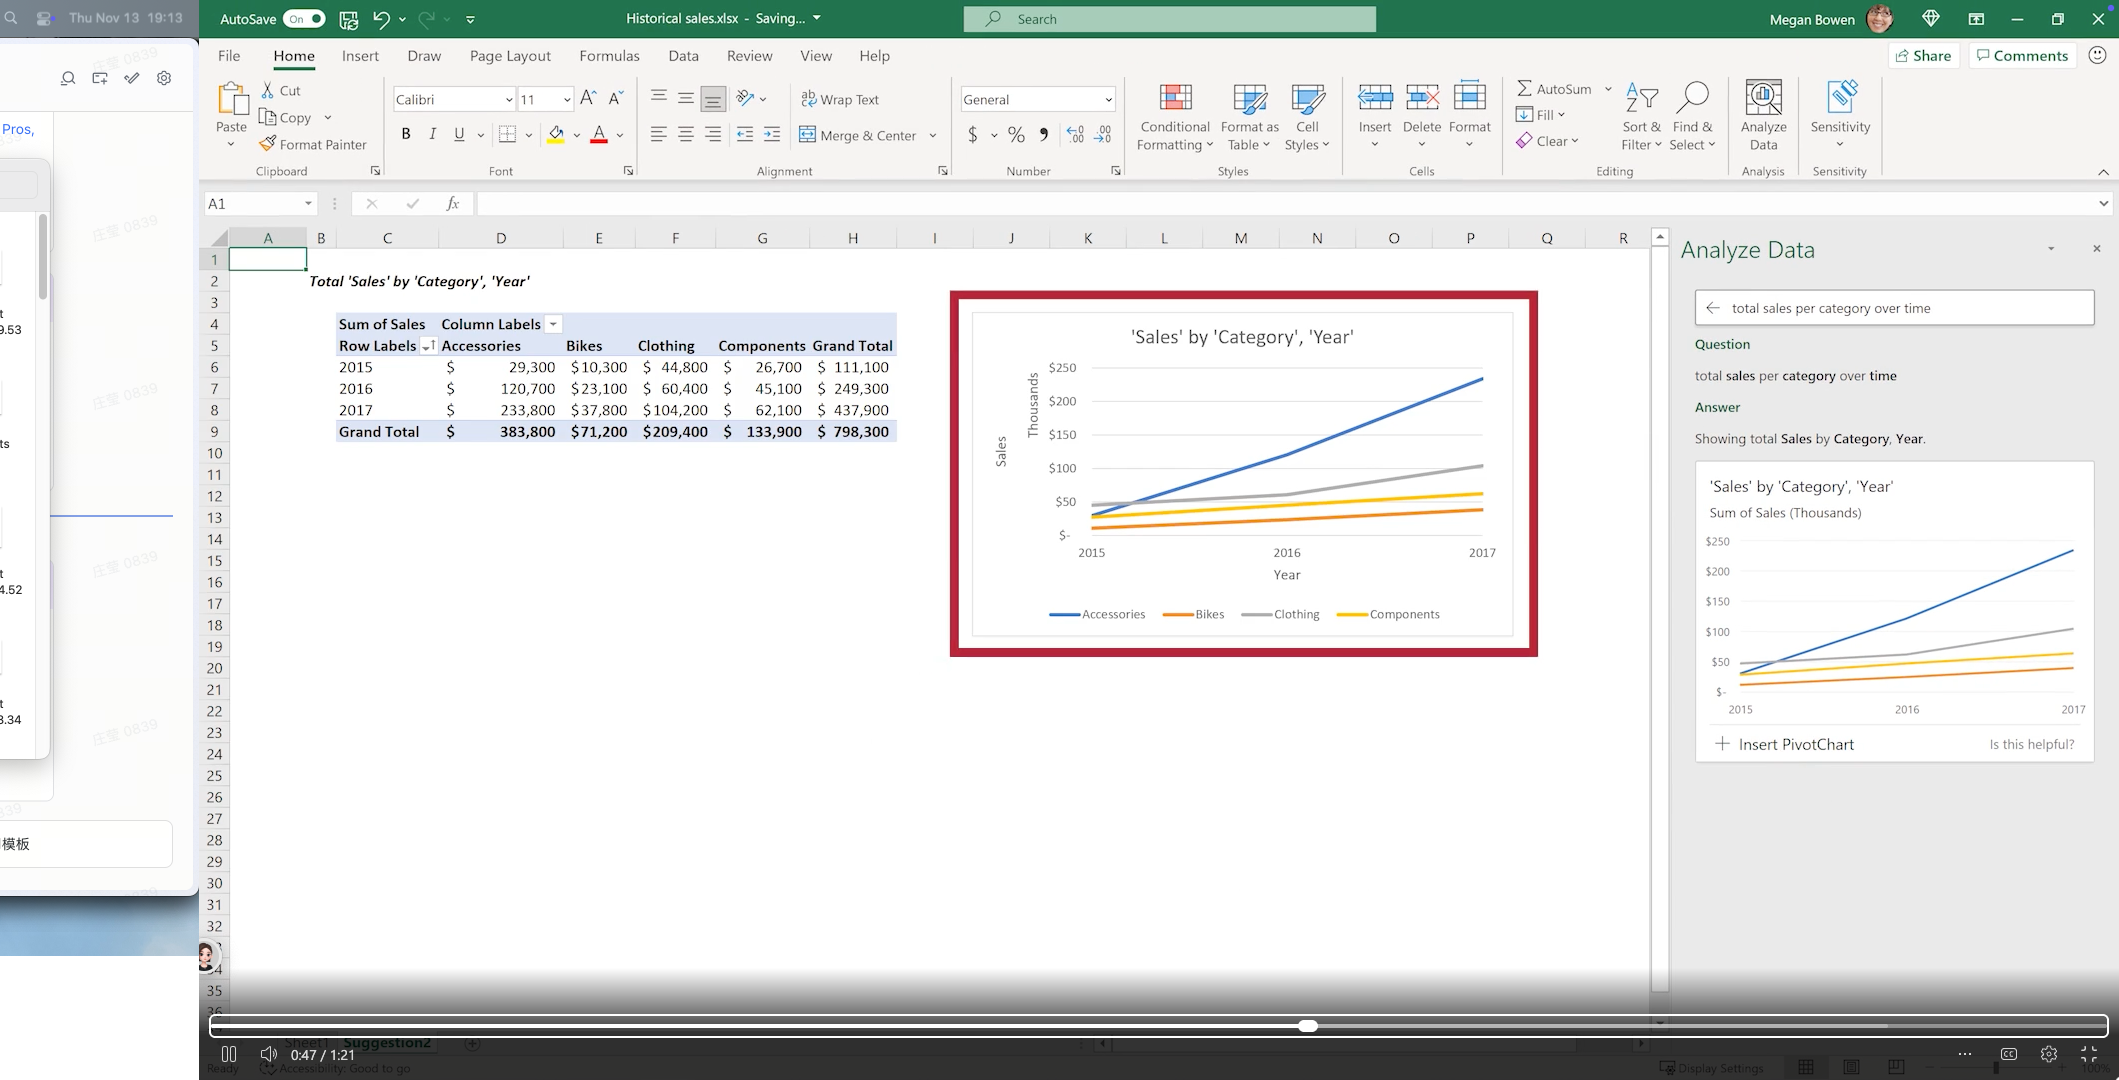
Image source: microsoft.com
Excel remains the go-to choice for teams that want complete formula control and offline reliability. You can create dedicated columns for BAC, EV, AC, CPI, and SPI, and apply various EAC formulas (such as =BAC/CPI or =AC+(BAC–EV)) to test different cost performance scenarios. Features like PivotTables, goal seek, and conditional formatting help identify variances and forecast deviations visually. However, managing multiple data versions manually requires careful attention, particularly when collaborating across departments.
Google Sheets: Real-time collaboration and accessibility
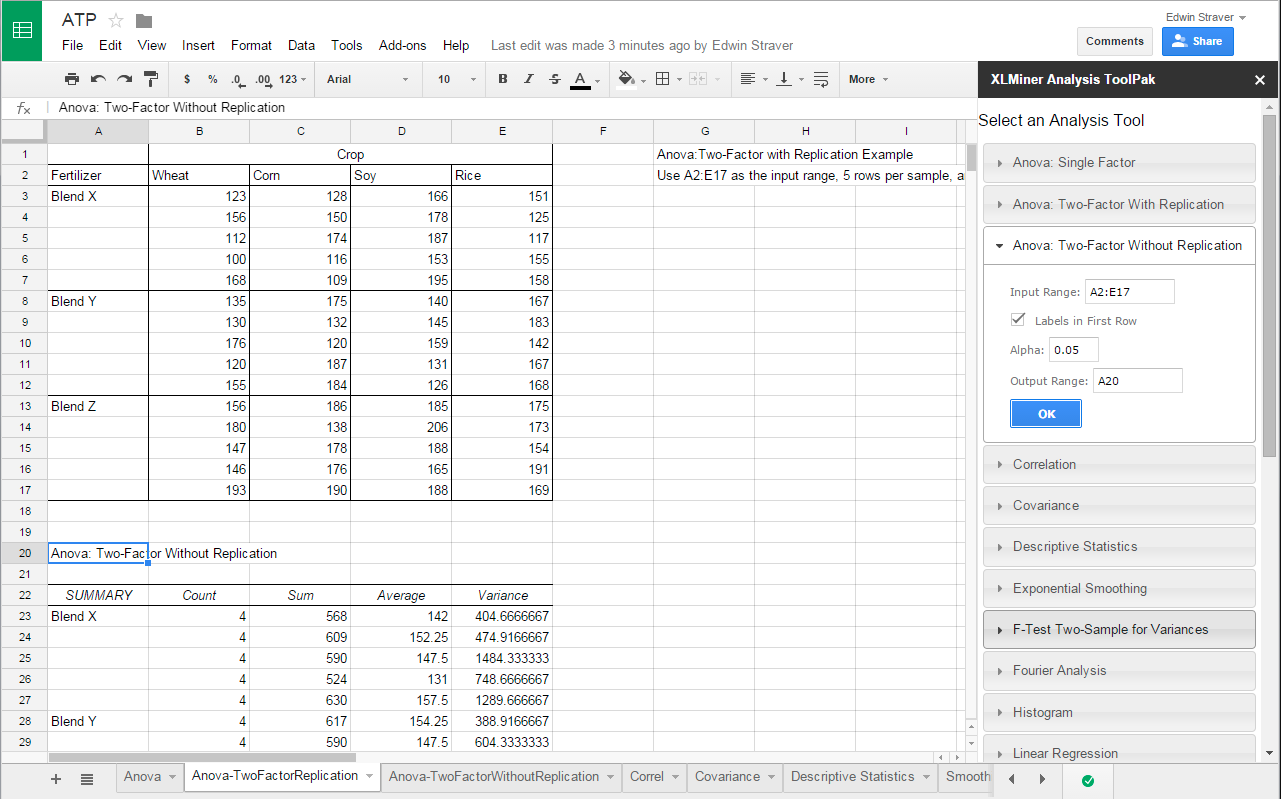
Image source: google.com
For distributed teams, Google Sheets provides the advantage of cloud-based collaboration. Team members can update actual cost or earned value data simultaneously, and EAC figures recalculate instantly for everyone viewing the sheet. Built-in charts and filter views make it simple to track cost trends, compare performance over time, and share visual dashboards directly with stakeholders. The trade-off is that complex projects may need more structured controls to maintain version accuracy and formula consistency.
However, manual models require vigilance to prevent errors from outdated inputs or inconsistent data versions.
Using project management or finance software like Microsoft Project, Primavera
When handling large or multi-phase projects, project management and finance platforms offer the automation and integration needed to calculate EAC (Estimate at Completion) accurately and consistently. These tools synchronize earned value data with scheduling and accounting systems, ensuring that cost forecasts remain aligned across departments.
Microsoft Project: Integrated scheduling and cost forecasting
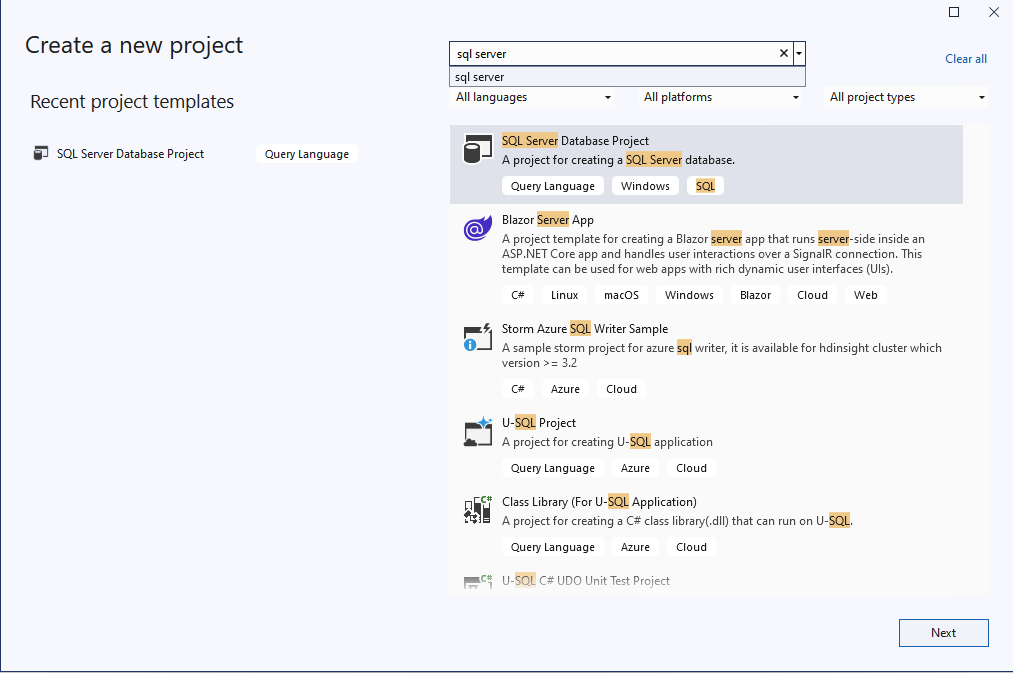
Image source: microsoft.com
Microsoft Project seamlessly connects task scheduling with financial tracking, allowing project managers to input BAC, EV, and AC directly within their project plans. The software automatically calculates EAC using earned value formulas and can display performance metrics like CPI and SPI in built-in reports. Its timeline and report views make it easy to compare EAC vs BAC, identify cost trends, and highlight potential budget overruns before they become critical.
Oracle Primavera: Enterprise-level performance and control
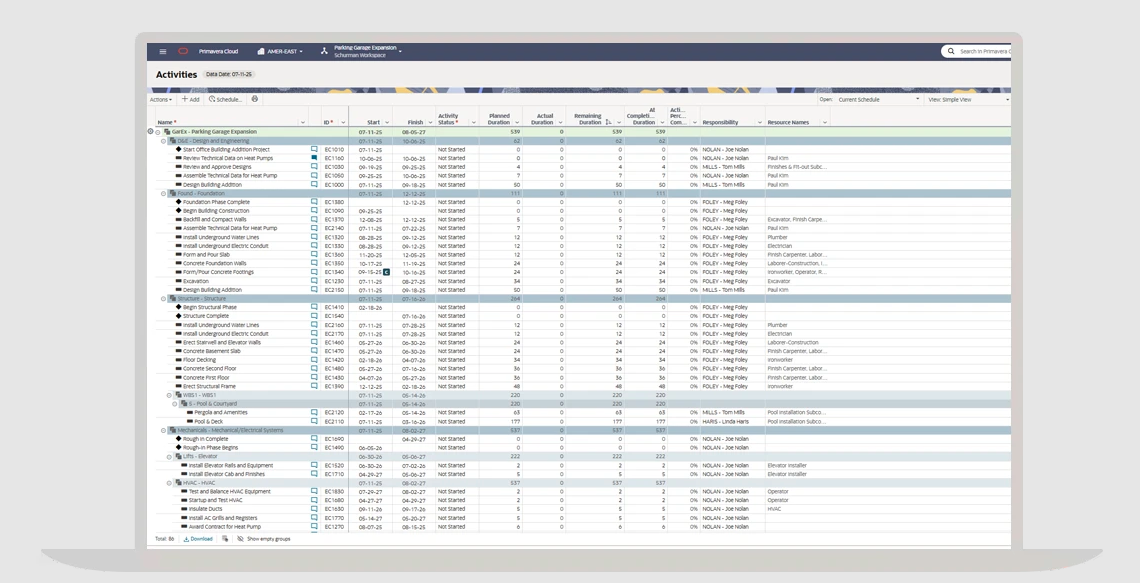
Image source: oracle.com
Oracle Primavera is designed for large-scale, resource-intensive projects where precision and control are essential. It consolidates schedule, resource, and cost data, enabling real-time calculation of EAC and ETC (Estimate to Complete) at both task and program levels. Primavera's advanced analytics and customizable dashboards allow financial and project teams to monitor performance deviations, generate forecast reports, and perform scenario analysis with high accuracy.
Making EAC a part of your ongoing project workflow
Knowing how to calculate EAC is only part of the story; what transforms your process is integrating that knowledge into day-to-day project management. Modern teams are looking for ways to share financial visibility and keep cost forecasts consistently up to date. This is where digital collaboration platforms can make a meaningful difference.
Building transparent cost data systems
Teams can create a shared workspace to log budget metrics—BAC, EV, and AC—and automatically calculate EAC as these inputs evolve. Instead of sending spreadsheets back and forth, everyone can access the same live data and dashboards. Tools with flexible data tables or databases allow formula integration, so EAC updates whenever new costs are recorded.
Turning EAC into a collaborative learning and planning tool
Embedding EAC discussions inside documentation or meeting notes transforms it from a static report into an interactive planning resource. For example, teams can write internal guides explaining EAC formulas, embed sample calculations, and simulate future cost projections together. This shared knowledge builds confidence and financial proficiency over time.
Automating project alerts and progress communication
Automation keeps EAC relevant. Notifications can trigger when cost performance indicators drop below your threshold, prompting early intervention. Chat integrations allow project updates, including EAC changes, to surface during real conversations rather than isolated reports.
Through these habits, how to calculate EAC project management becomes less about arithmetic and more about teamwork—creating a living system for cost awareness, accountability, and collaboration. Platforms like Lark exemplify this approach by combining documentation, data, and communication in one environment.
Conclusion
Learning how to calculate the EAC gives project managers a clearer view of where budgets truly stand and how to anticipate future challenges. Accurate EAC calculations reduce guesswork, turning financial forecasting into a daily habit rather than a quarterly panic. When done well, EAC becomes your early-warning system for cost overruns and a source of confidence in decision-making.
The more regularly you calculate, compare, and communicate with EAC, the stronger your team's strategic control becomes. And by integrating collaborative tools that connect data updates, documentation, and communication—like Lark—you can ensure that those insights flow naturally across teams and industries, keeping every stakeholder informed and aligned from start to finish.
FAQs
How to calculate EAC in Excel?
To calculate EAC in Excel, input your BAC, EV, AC, CPI, and SPI values into separate cells. Then apply the appropriate formula (for example, =BAC/CPI when performance is steady). Excel instantly recalculates EAC when you update values, allowing ongoing cost tracking and performance comparisons.
How to calculate EAC in finance?
In finance, EAC can signify the long-term cost of ownership or project completion. The principle is the same: it's a forward-looking figure that projects the total expected cost by combining what has already been spent (AC) with what remains (ETC). Financial analysts use it to measure investment efficiency and evaluate forecast credibility.
What is the formula for EAC and VAC?
The EAC formula varies depending on assumptions, but the most common are:
- EAC = BAC / CPI (if performance continues as before)
- EAC = AC + (BAC - EV) (if conditions change)
The related VAC (Variance at Completion) measures deviation from the budget: VAC = BAC - EAC.
A positive VAC signals a project under budget; a negative one indicates overrun.
What is the EAC in estimating?
In estimating, EAC is the forecast of total project cost using current progress and performance data. It supports realistic planning by accounting for both observed cost efficiency and future expectations. EAC connects past performance to future spending, providing a grounded prediction of final expenditure.
How to calculate EAC on financial calculator?
On a financial calculator like the BA II Plus, you can apply EAC-related formulas manually by inputting current cost and performance values. While these calculators are more commonly used for discounted cash flows or NPV, the same logic applies — you input current cost (AC), projected cost to complete (ETC), or use CPI-based formulas for total forecast calculations.
How to calculate EAC from NPV?
When considering how to calculate EAC from NPV, the focus shifts to cost equivalence over time. You align the total project cost forecast (EAC) with the project's net present value to gauge long-term investment efficiency. This approach adjusts for inflation and cash-flow timing, offering insight into project profitability as well as total cost.
Related reading
Table of contents
Start using Lark today

Manage all your work in one place
Boost team efficiency by 10x
Save up to 70% on software costs
Table of contents
Start using Lark today
Manage all your work in one place
Boost team efficiency by 10x
Save up to 70% on software costs



2026 Lark Technologies Pte. Ltd.
Headquartered in Singapore with offices worldwide.






Explore: