














How to Make a Fishbone Diagram: Step-by-Step Guide

Ryan Tanner
Product Marketing Specialist
Sep 18, 2026
Ryan Tanner
Sep 18, 2026

24 min read


Understanding how to make a fishbone diagram is an essential skill for teams that want to investigate problems in a structured and visual way. A fishbone diagram helps break down a single issue into multiple possible causes, so teams can analyze, compare, and prioritize what needs to be solved first. Instead of jumping to conclusions, it encourages a system-wide view of problems that might involve people, processes, tools, or external factors.
Many teams still create fishbone diagrams manually, but modern workspaces now allow collaborative building, editing, and action tracking in one place. Lark supports this approach by giving teams a shared document, database, and task flow that keeps everyone aligned while working through root cause analysis.

What is a fishbone diagram?
A fishbone diagram, also known as an Ishikawa diagram or cause and effect diagram, is a visual tool used to explore the different factors that contribute to a single problem. It is shaped like the skeleton of a fish, with the problem statement on the head and possibly causes branching outward like bones. This format makes it easier to categorize factors and uncover relationships that are not immediately obvious. The main goal is to move beyond symptoms and identify the root causes that truly need attention.
This method is widely used in quality control, engineering, healthcare, service teams, and project management because it helps people slow down and analyze rather than guess. Before learning how to make a fishbone diagram with specific project management tools, it is important to understand how it supports structured thinking, clearer decision-making, and cross-team participation.
How to make a fishbone diagram in popular tools
Before learning how to make a fishbone diagram in different software tools, it is useful to understand that most platforms follow the same basic setup. You begin by writing the main problem at the head of the diagram, then draw a horizontal line, add category branches, and finally list causes under each branch. The only difference between tools is how easy it is to format shapes, text, and spacing. Some tools require manual drawing, while others offer templates or drag-and-drop diagram controls. The four most commonly used options are Microsoft Word, PowerPoint, Excel, and Google Docs, especially for teams that still work with familiar office apps before moving into collaborative workflows.
How to make a fishbone diagram in Word
Creating a fishbone diagram in Word is useful for teams who want a simple format without switching to design software. The built-in-shaped menu allows you to draw the fishbone manually, and you can duplicate lines to create branches faster. This method works best for brainstorming sessions where formatting does not need to be highly polished.
- Open a blank Word document and insert a horizontal arrow shape to represent the spine of the fish.
- Add a text box at the right end of the arrow and type the main problem statement, keeping it short and specific.
- Use angled lines under "Insert > Shapes" to create the main cause branches, spacing them evenly on both sides of the spine.
- Label each branch with typical categories like People, Process, Materials, Machine, Environment, or Measurement.
- Add sub branch lines under each category and type the potential causes as your team brainstorms.
- Review the diagram, adjust spacing, and save it as a template for reuse when running future root cause analysis sessions.
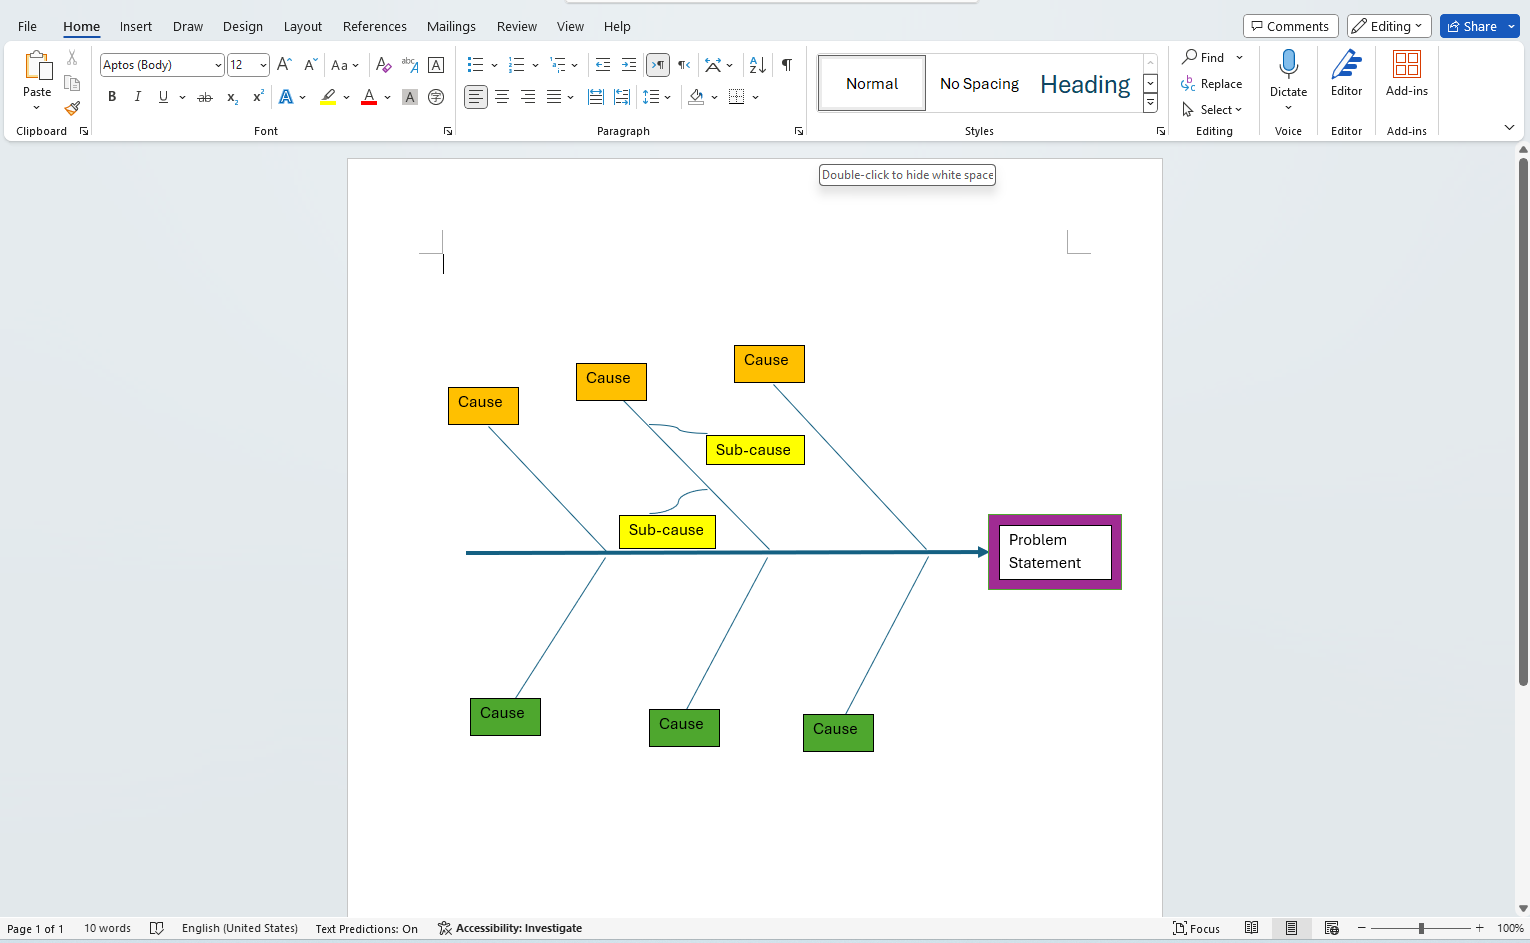
Image source: venngage.com
How to make a fishbone diagram in PowerPoint
PowerPoint is one of the most common tools for presenting fishbone diagrams because its slide layout makes it easy to edit, resize, and share visuals during meetings. Teams often use a premade fishbone template, then customize text and colors before presenting findings to managers or clients.
- Open a new slide and insert a horizontal arrow shape to build the central spine of the diagram.
- Add a text box at the end of the arrow and type the problem statement you want to analyze.
- Use diagonal connector lines to create branches and align them using PowerPoint's grid and snap tools for a cleaner look.
- Label each branch with category names and use text boxes for sub causes, so they stay editable when rearranging content.
- Format colors, line thickness, and font size, so the diagram is readable when projected or shared in a screen recording.
- Export the slide as an image or PDF if you want to embed it into reports, handouts, or shared documents.
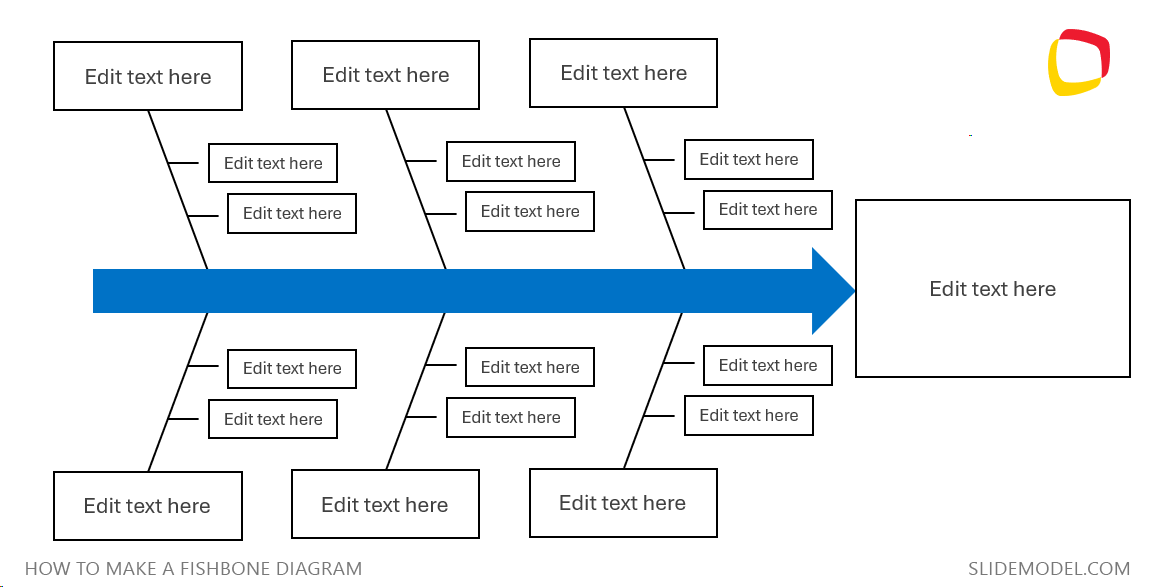
Image source: slidemodel.com
How to make a fishbone diagram in Excel
Excel is surprisingly useful for fishbone diagrams because its grid layout helps align branches and maintain spacing, especially when converting brainstormed causes into numeric data later. Many teams start with a diagram and then extend the same sheet with ratings, ownership fields, or probability scores.
- Create a blank sheet and adjust column width to give yourself space for the fishbone layout.
- Insert arrow and connector shapes from the "Illustrations" menu to build the main spine and branch lines.
- Add labeled text boxes for each cause category, keeping one category per branch for clarity.
- Enter causes below each branch in text boxes or cells, depending on whether you want to analyze data later.
- Use Excel's cell borders or background colors to separate sections and make the fishbone easier to view at a glance.
- Save the layout as a reusable worksheet template if your team runs multiple RCA sessions over time.
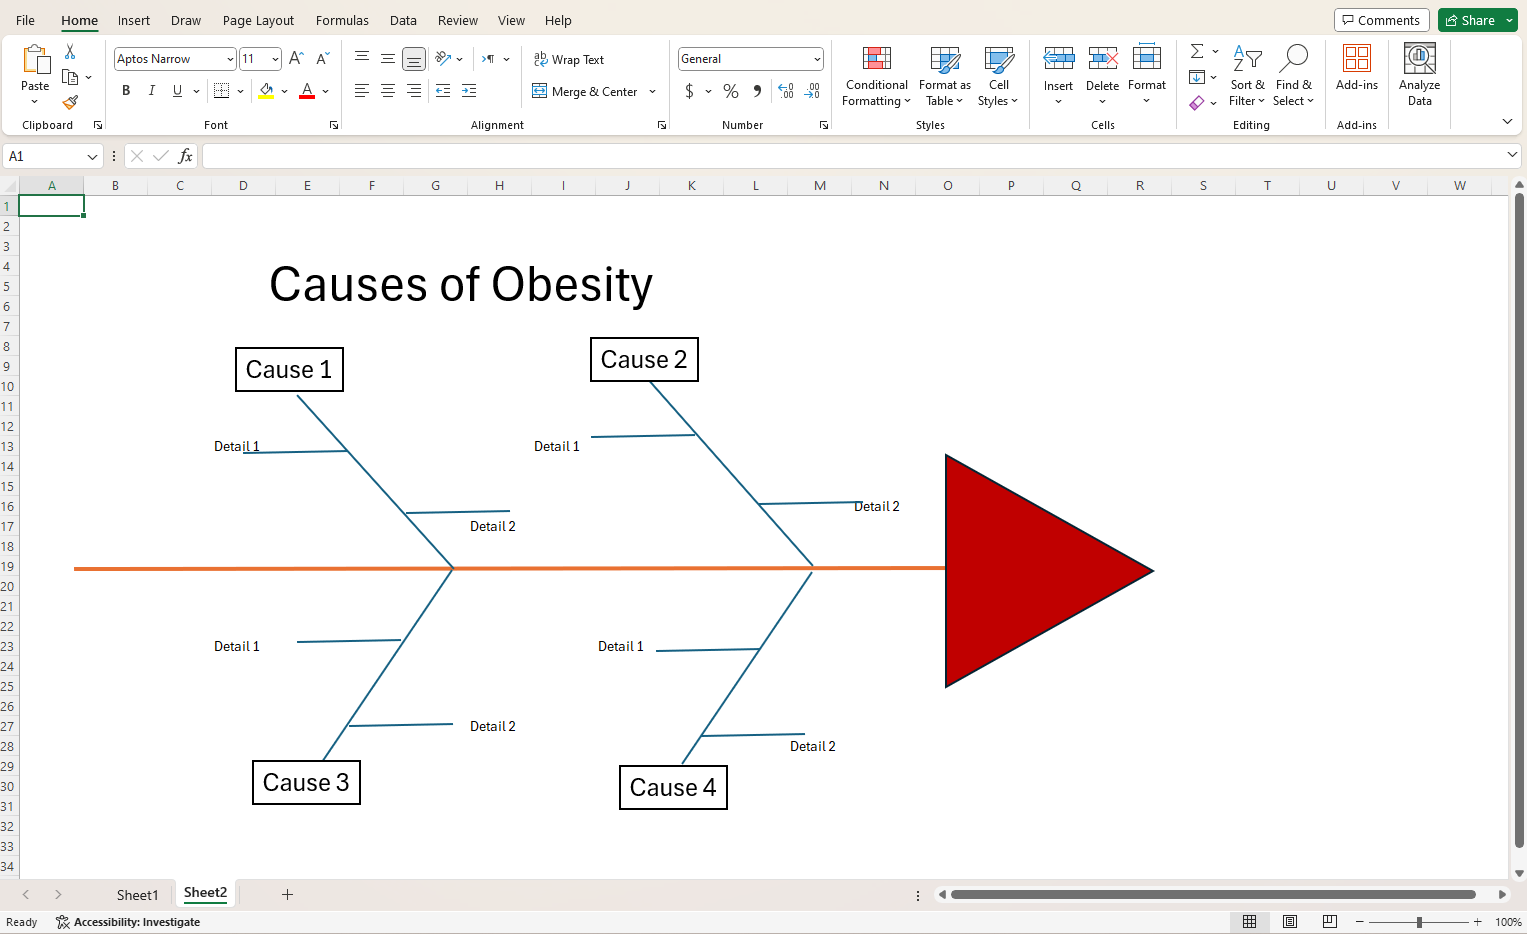
Image source: venngage.com
How to make a fishbone diagram in Lark
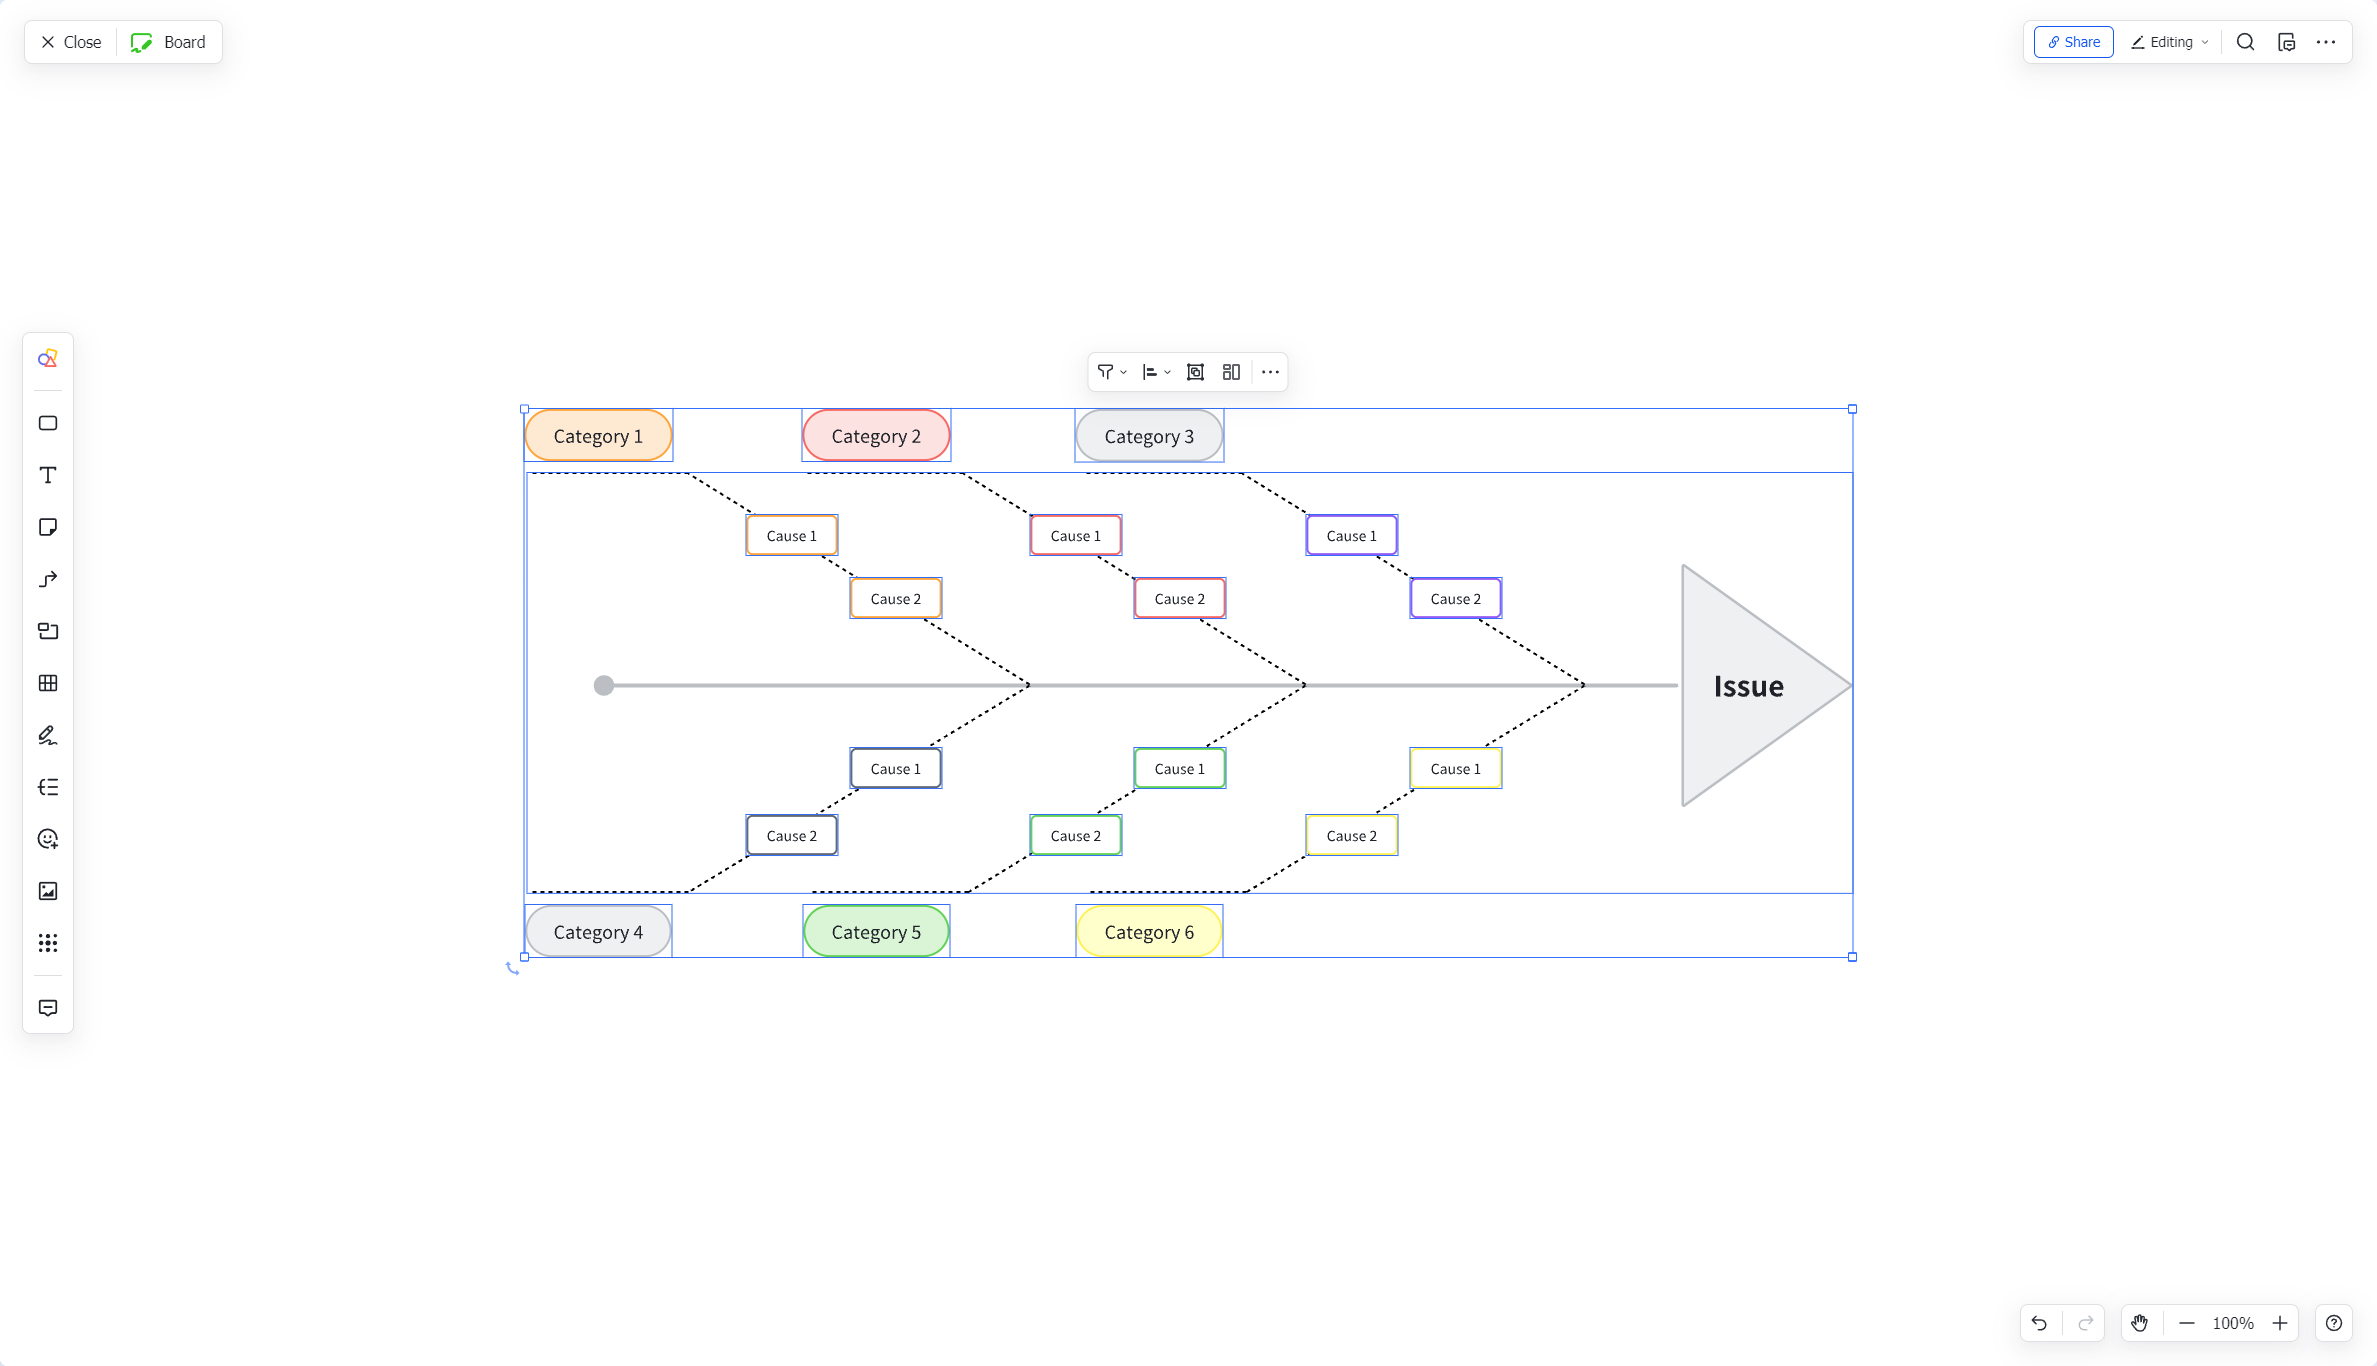
Lark is highly effective for creating fishbone diagrams because its templates and collaborative board make it easy to visualize causes, align branches, and organize ideas in real time. Teams can brainstorm directly in Lark Docs and structure factors clearly.
- Open Lark, and in Lark Docs, insert a Board
- Click "Templates", search for fishbone to use it
- Insert text boxes at each branch to label categories (e.g., People, Process, Tools, Environment).
- Add smaller lines or sticky notes under each branch for specific causes, letting team members collaborate in real time.
- Use colors, shapes, or frames to group related factors and make the diagram easier to read.
How Lark helps teams create and collaborate on fishbone diagrams
Creating a fishbone diagram is only the first step. Most teams struggle not with drawing the diagram, but with turning brainstorming into organized data, assigning ownership, tracking fixes, and keeping everyone aligned as actions move forward. Lark transforms this entire workflow into a connected process, rather than a scattered set of documents, spreadsheets, chats, and emails. Each feature supports a different phase of root cause analysis, so the diagram becomes more than a visual; it becomes a living problem-solving system.
Board in Lark Docs: turning collaborative ideas into visual fishbone diagrams
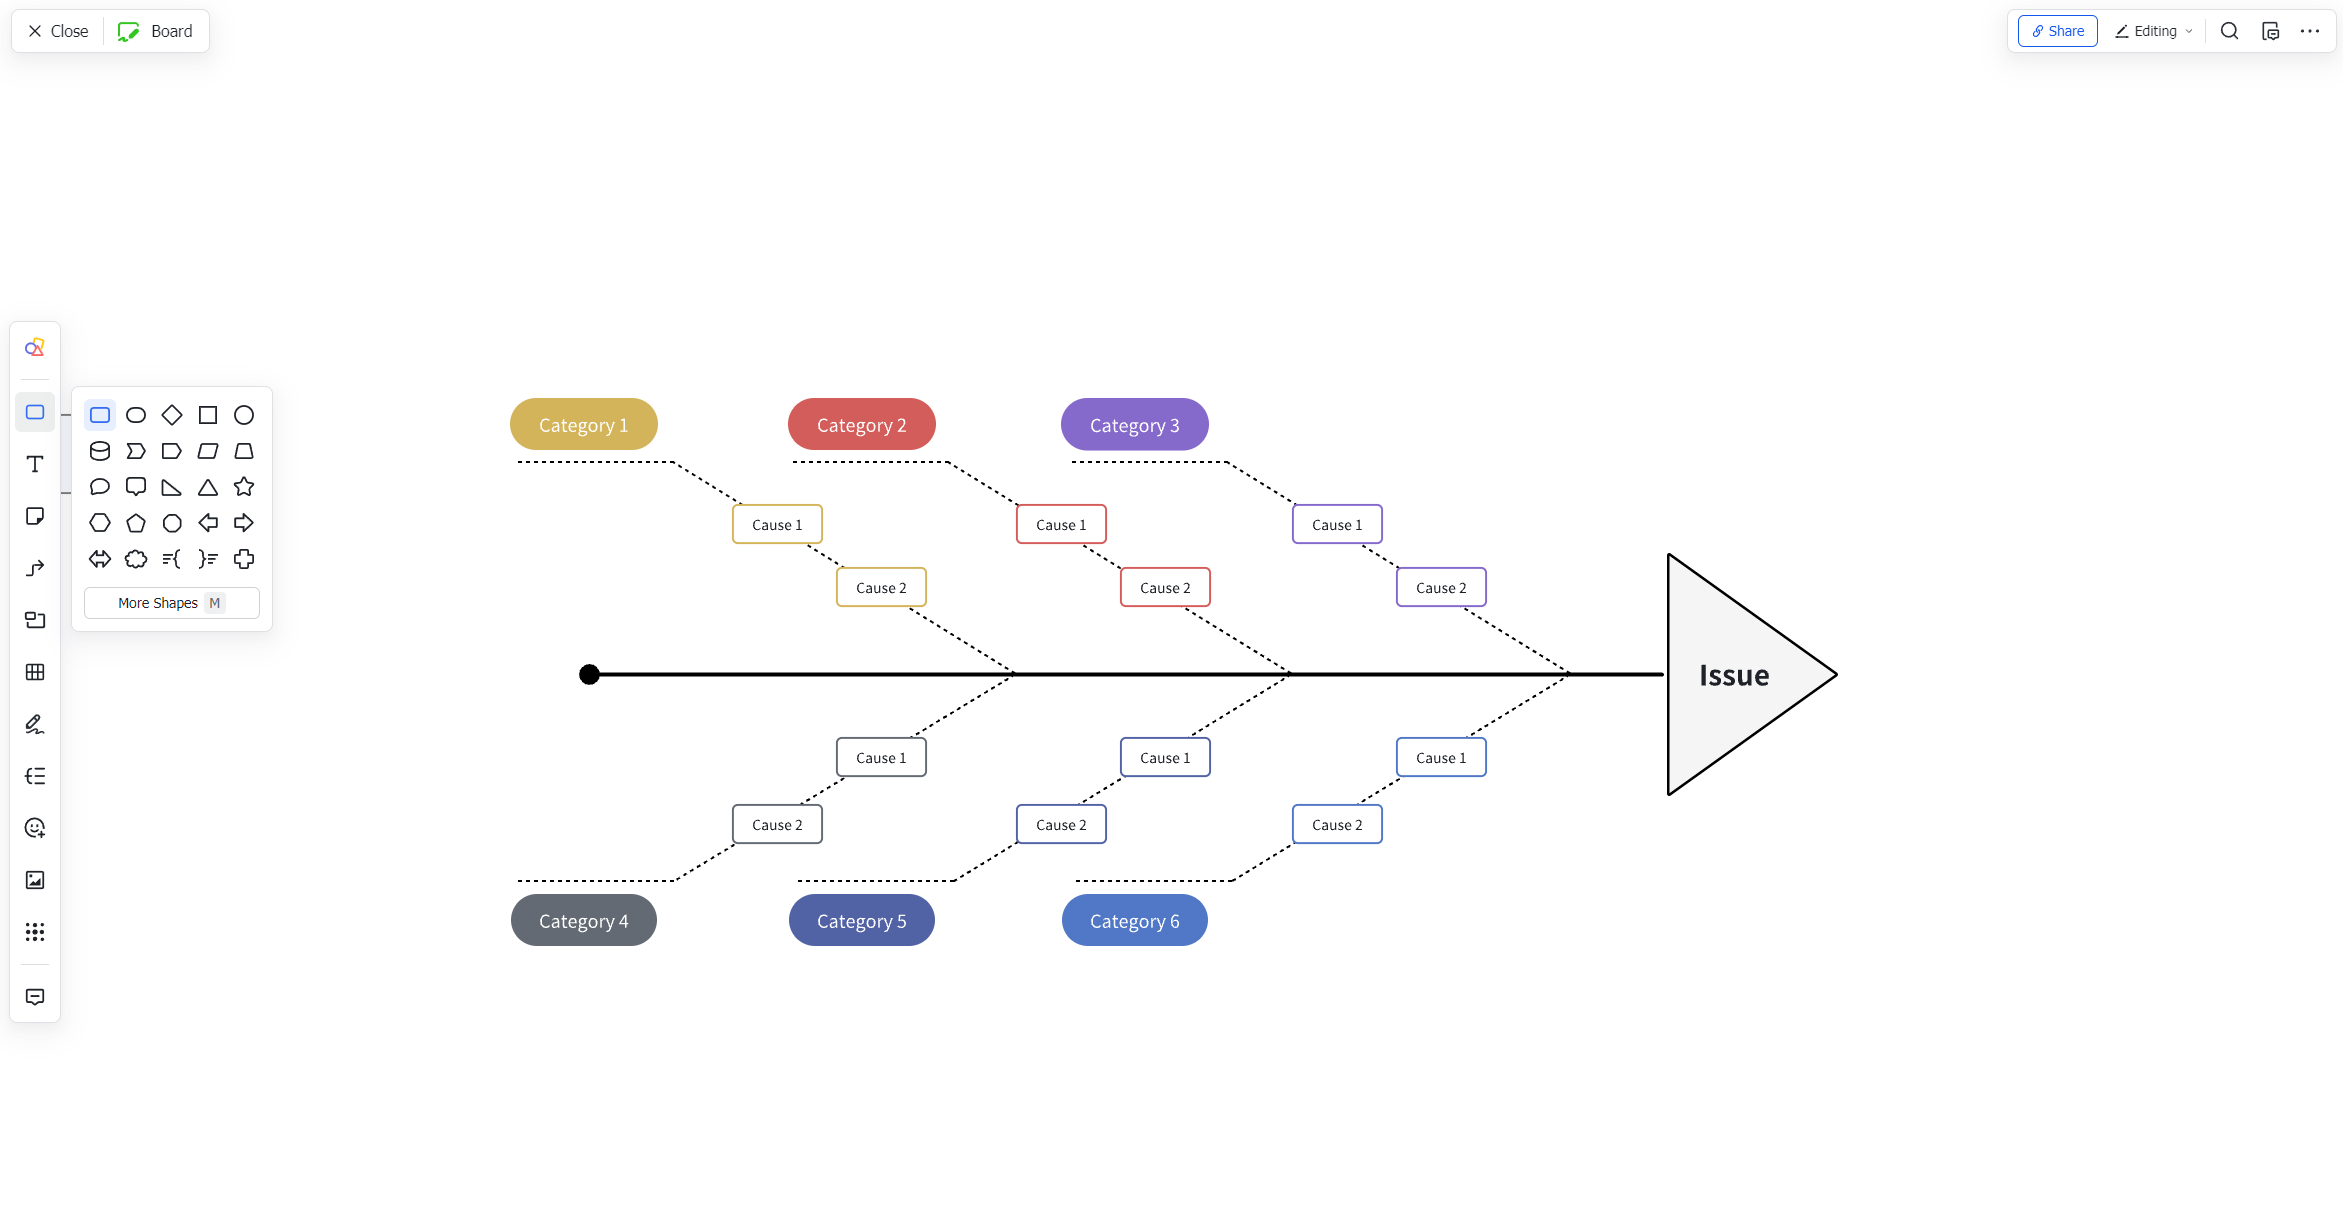
Board in Lark Docs takes structured brainstorming from Lark Docs and converts it into a visual fishbone diagram that teams can build and refine together in real-time. Its drag-and-drop canvas, shape tools, and swimlane features make it easy to map causes clearly and collaboratively.
- Teams can draw the main "spine" of the fishbone using lines or arrows, then add branches for key categories such as People, Process, Materials, Machine, Environment, and Measurement.
- Using the Shapes menu, teams can insert rectangles, circles, or sticky notes to represent specific causes under each branch, adjusting colors or line styles for clarity.
- With Swimlane diagrams, teams can further organize causes by responsibility or department (e.g., separating supplier, logistics, and production factors), making ownership and dependencies visible at a glance.
- Everyone can co-edit in real time, adding ideas, connecting relationships, and commenting directly on shapes or sections without disrupting others’ work.
- Boards can be linked back to the original Lark Doc, ensuring that the visual diagram reflects all previously gathered insights and discussions.
- Once completed, the Board can be shared, embedded, or reused as a template, allowing future teams to conduct root-cause analyses consistently across projects.
Example: After the QA team lists possible causes of "Late shipments" in Lark Docs, they open a Board, draw the main fishbone, and assign each category to a swimlane—Logistics, Packaging, Supplier, and Operations. Each group adds their detailed causes as sticky notes along their lane.
Result: Lark Board transforms text-based brainstorming into a clear, visual analysis that reveals cause relationships, ownership, and priorities—all within one collaborative workspace.
Lark Docs: Brainstorm and structure causes together
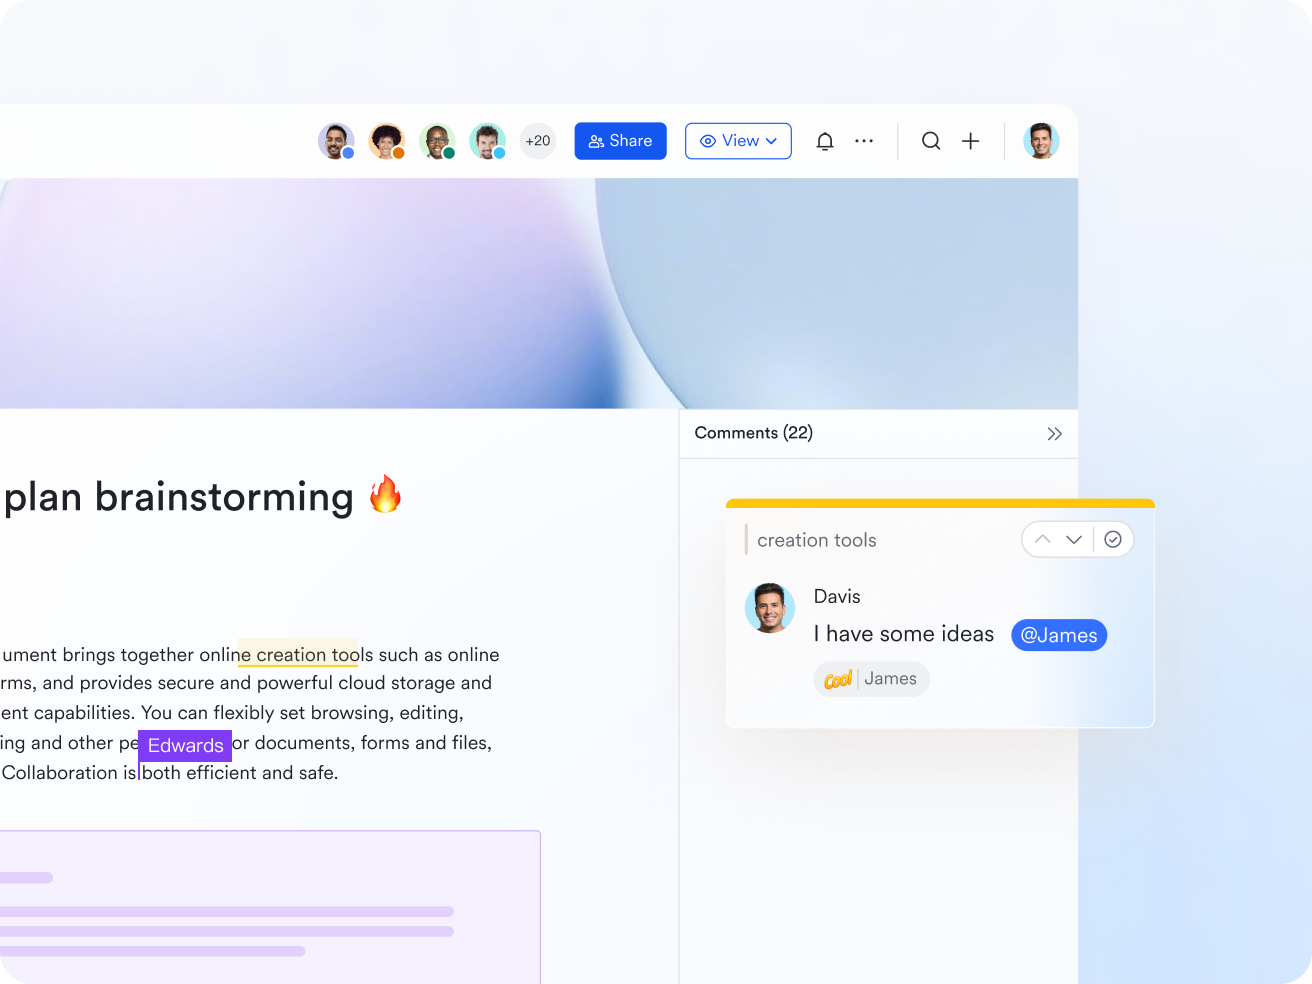
Lark Docs provides teams with a single shared document to define the problem, categorize potential causes, and capture inputs from every stakeholder, eliminating version confusion. Multiple people can type, comment, reply, and highlight simultaneously, keeping the full context visible during the early discovery stage.
- Teams can outline the main problem and add category headings like People, Process, Materials, Machine, Environment, and Measurement.
- Everyone involved can brainstorm directly inside the document instead of sending separate files or chat messages.
- Comments and suggestions stay attached to the exact line or idea, so nothing is lost during review.
- The document updates in real time, removing the need to merge edits or track file names like "final v3".
- Teams can convert the document into a meeting agenda, export it for reports, or link it to the next stage of analysis without recreating content.
- Lark Docs becomes the shared reference point before the visual diagram is built, ensuring that every idea has been captured and categorized.
Example: The quality assurance team identifies "Late shipments" as the main problem. In Lark Docs, they create sections for each cause category and invite the logistics, packaging, and supplier teams to list possible reasons such as "insufficient supplier lead time," "manual quality checks," or "limited transport capacity." All feedback is collected in one live document, instantly visible to everyone involved.
Result: Lark Docs replaces scattered brainstorming sessions with a single, organized workspace for collaborative problem discovery.
Lark Base: Categorize and visualize data
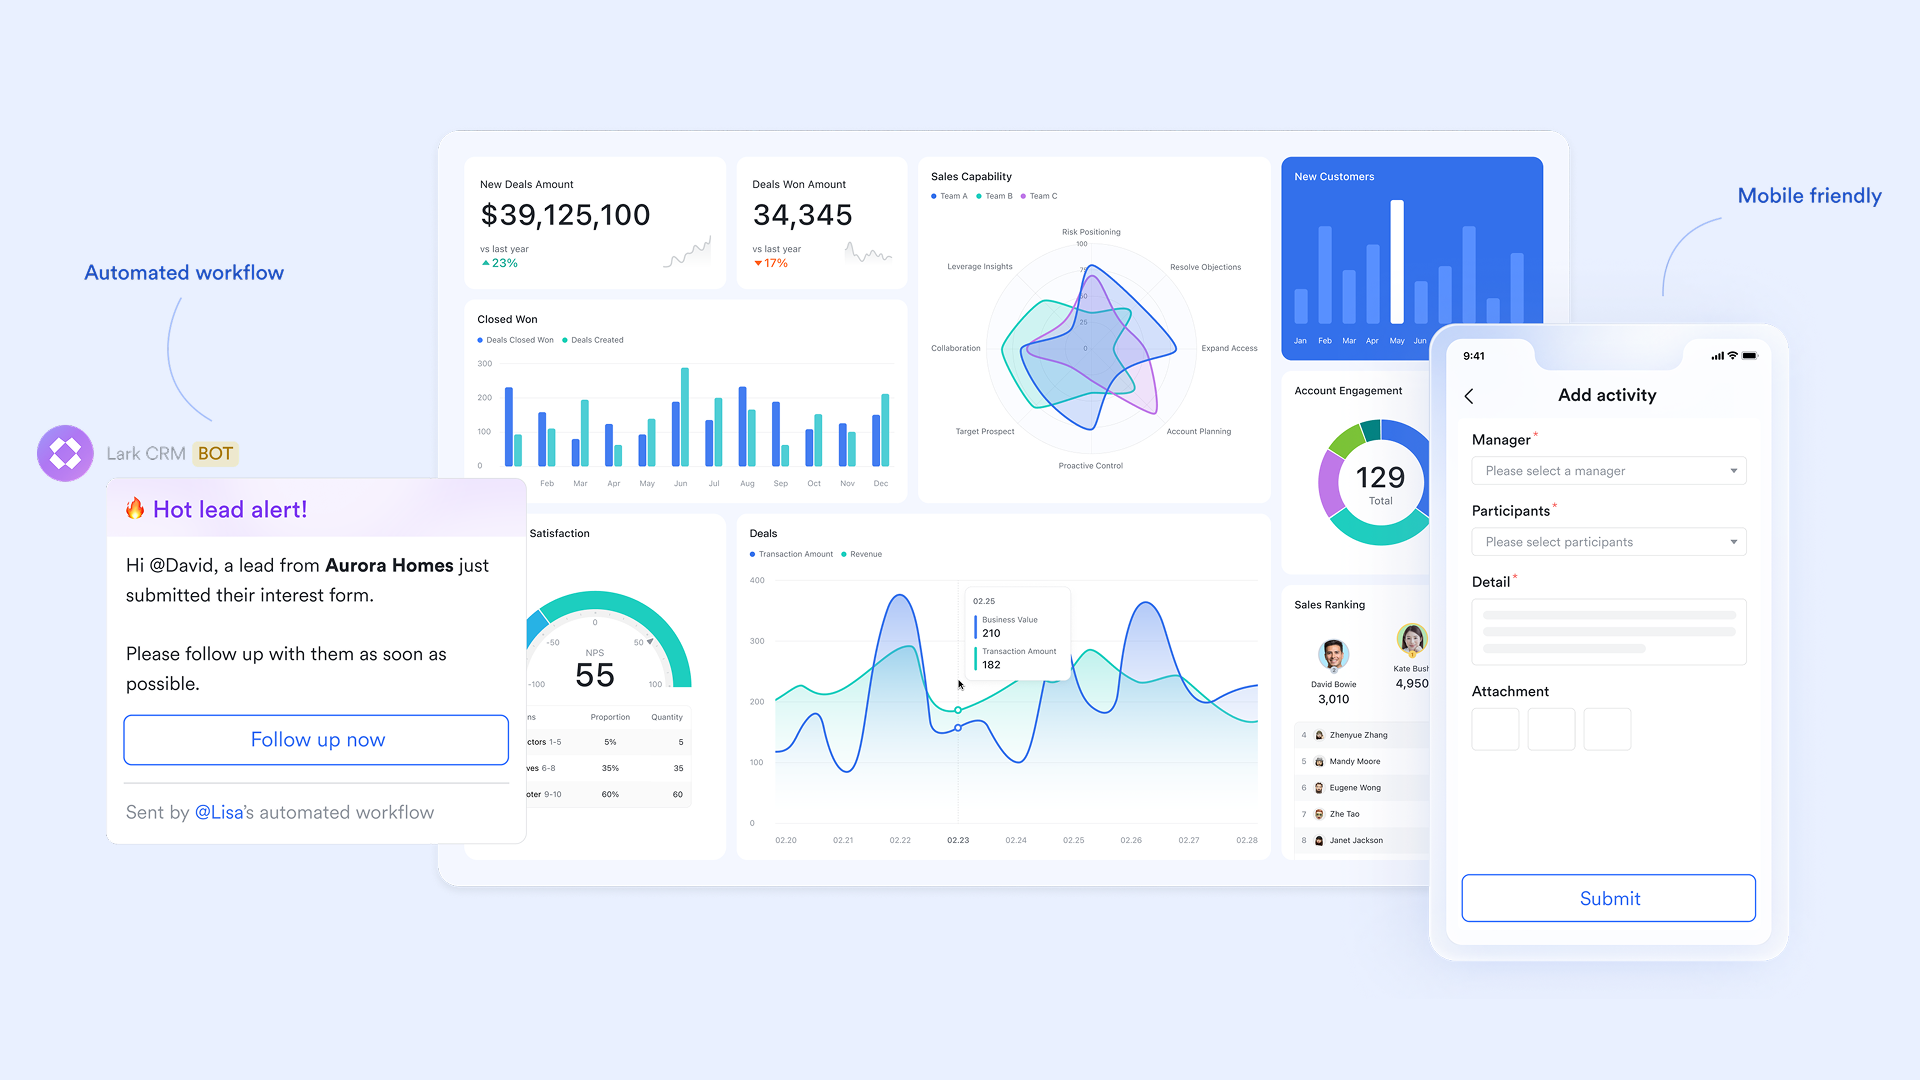
Once the brainstorming stage is complete, causes can be transferred into Lark Base, where teams convert raw input into a structured database. This step makes root cause analysis measurable and sortable instead of being locked inside a static whiteboard or screenshot.
- Each row in Base can represent a specific cause, with fields for category, description, severity level, and ownership.
- Teams can filter causes by priority, department, or risk level, making it easier to see patterns.
- Base allows grouping and linked views, so the same cause data can be shown as a table, board, gallery, or chart.
- Assigned owners can update status and add findings directly in the same record, eliminating manual follow up emails.
- The database can link to Docs, Tasks, or Sheets, creating a complete chain of context from idea to action.
- Base turns the fishbone diagram into operational data instead of an isolated picture.
Example: The project manager imports causes from Lark Docs into Base and adds impact scores. By applying filters, they can identify all "high-priority" causes related to suppliers and immediately assign ownership to the procurement lead.
Result: Lark Base turns brainstormed causes into structured, actionable data that supports analysis and prioritization.
Lark Sheets: Analyze trends and visualize results
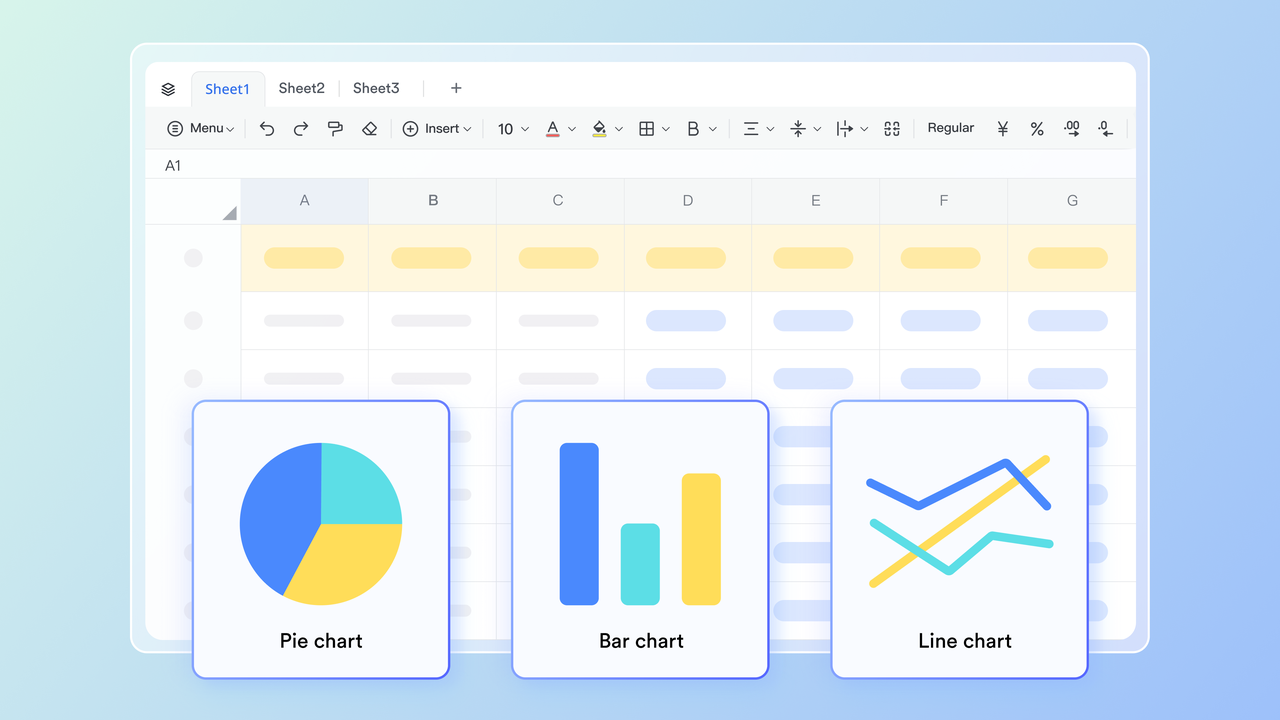
Lark Sheets lets teams turn causes, scores, and follow up results into interactive charts. This is useful for proving which causes matter most and presenting insights into leadership.
- Teams can calculate frequency counts, cost impact, or recurring patterns based on the database values.
- Sheets support charts like column graphs, stacked bars, pivot tables, and timeline analysis.
- Visual spreadsheet can be shared in chat or meetings without exporting to another analytics tool.
- Data updates automatically when base records change, so reports stay current.
- Teams can track the before and after effects of corrective actions, making improvements measurable.
- Sheets become the evidence layer that turns root cause findings into data backed decisions.
Example: The operations team uses sheets to monitor recurring issues in the "Process" category and discovers that manual quality checks delay production by 12%. They visualize this pattern and use it as evidence to justify process automation.
Result: Lark Sheets helps teams make data-driven decisions from fishbone analysis insights, ensuring that problem-solving is backed by measurable evidence.
Lark Tasks: Assign and track corrective actions
After identifying root causes, Lark Tasks helps teams turn conclusions into action items with clear accountability. This prevents fishbone diagrams from becoming "nice visuals" that never lead to change.
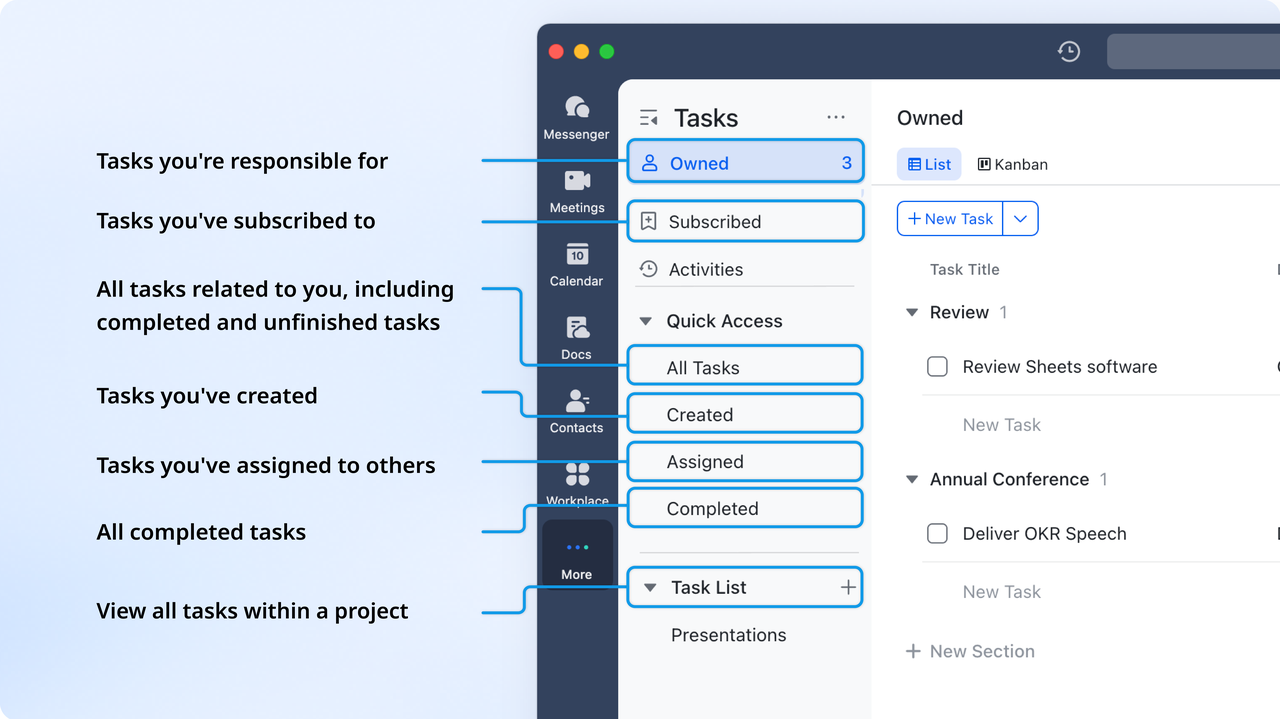
- Tasks can be created directly from Messenger or Docs entries.
- Each task can include deadlines, sub-steps, priority level, and task owners.
- Automated reminders prevent delays and reduce the need for managers to follow up.
- Teams can monitor the full progress of RCA actions in a check-box-style UI and filter tasks by status or owner.
- Completed tasks stay linked to the original cause record, preserving the problem solving history.
- Lark Tasks connects the diagram to real execution instead of leaving it as theory.
Example: Once the team identifies "supplier communication delays" as a key cause, they create a Lark Task to "Implement supplier performance dashboard." The task is assigned to the procurement manager with a one-week deadline. As progress updates roll in, stakeholders can view the real-time status and receive automatic reminders if deadlines approach.
Result: Lark Tasks closes the loop between analysis and action ensuring that identified causes lead to measurable improvements.
Lark Messenger: Discuss updates instantly
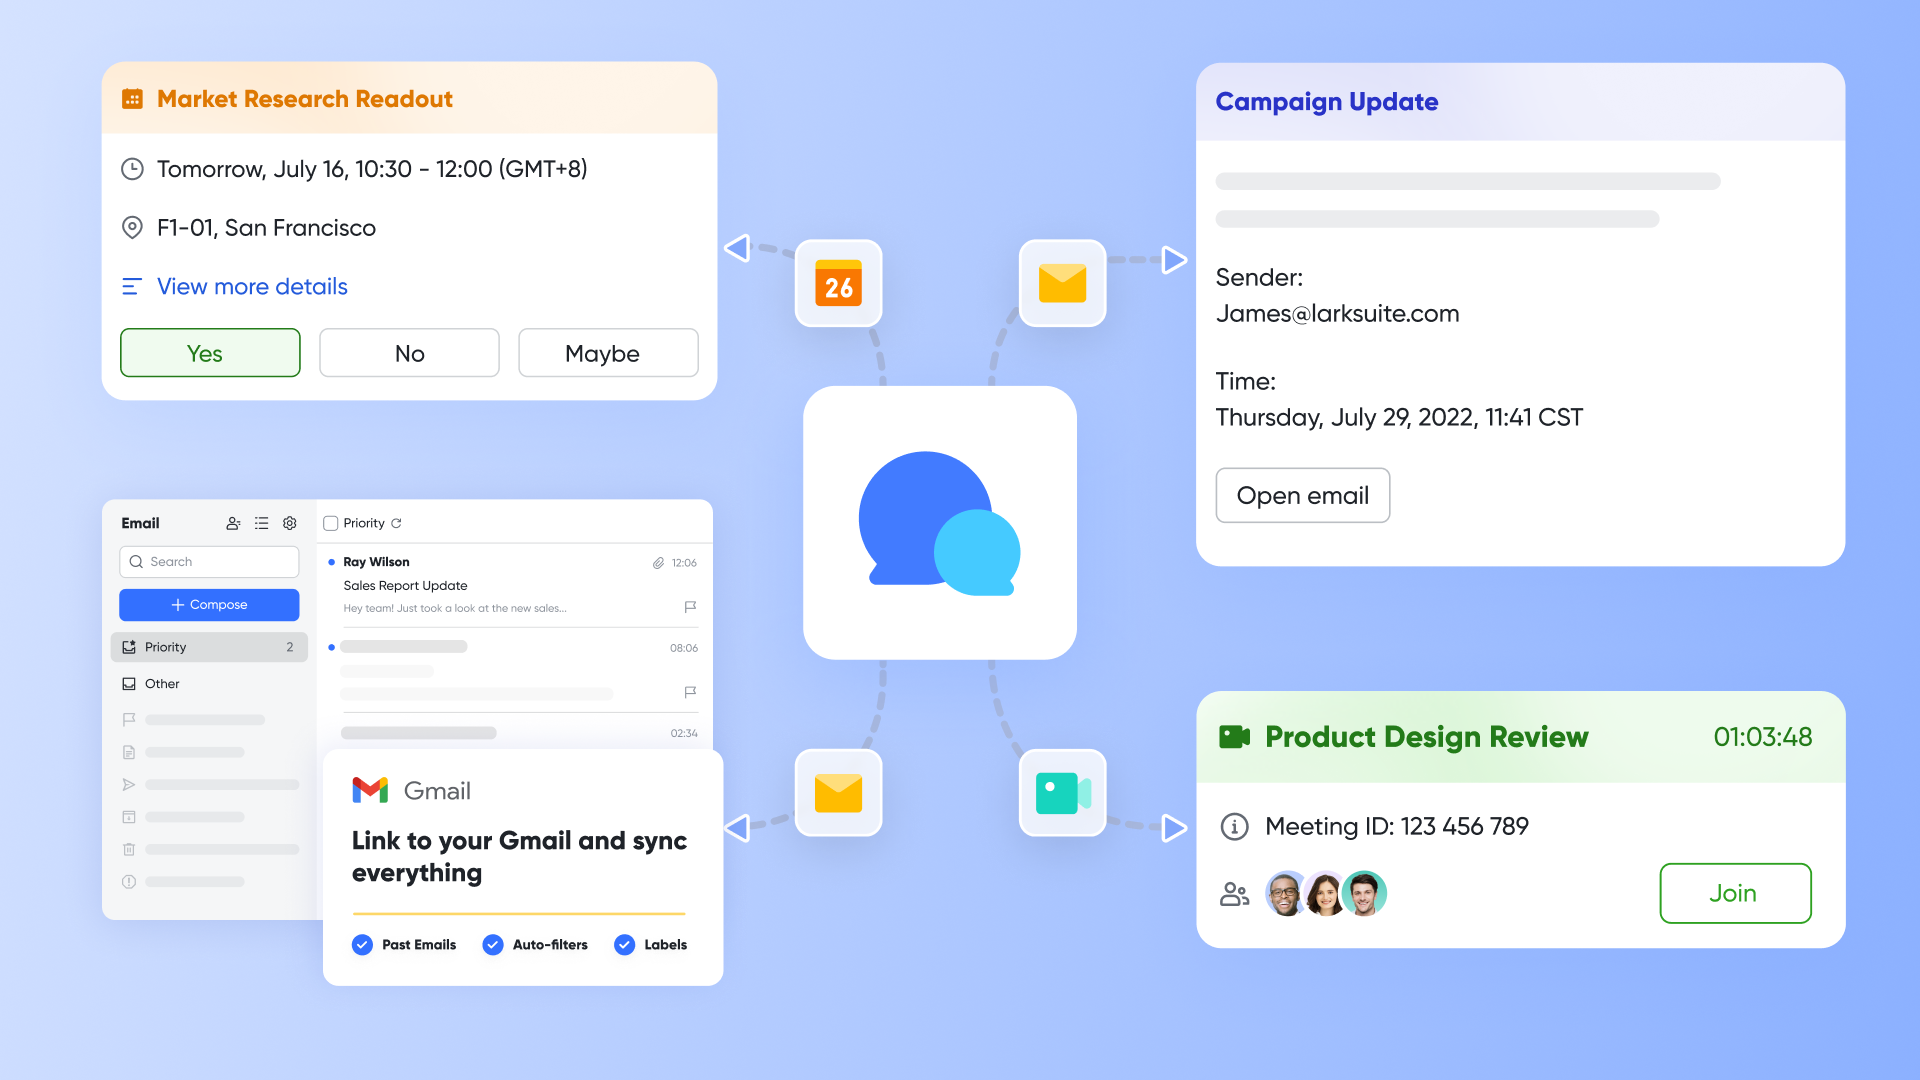
Lark Messenger keeps communication tied to the exact files, sheets, or records being discussed, so there are no lost threads or context gaps between departments.
- Teams can share Docs, Base views, or Sheets charts directly inside chat channels or replies.
- Every shared file displays live previews, so people do not need to switch tabs to understand the update.
- Message threads stay searchable, making it easy to revisit past decisions or progress notes.
- Group chats organize communication by project, RCA case, or department.
- Notifications appear automatically when tasks are updated or databases change.
- Messenger aligns everyone in real time, reducing meeting time and email chains.
Example: When the logistics team resolves a recurring delay cause, they share the updated Base entry in the "Operations Improvements" Messenger channel. The update triggers an automatic message to the quality team, notifying them that the issue has been resolved.
You can also use Messenger's pinned messages and group discussions for real-time updates during problem-solving meetings, eliminating the need for external chat tools or email follow-ups.
Result: Lark Messenger ensures that every department stays aligned and informed no waiting for reports, no duplicate messages, and no information gaps between service, production, and management teams.
- Starter plan: Free forever plan that includes 11 powerful tools for up to 20 users. It also comes with 100GB of storage, 1000 automation runs, AI translations, and more.
- Pro plan: $12/user/month (billed annually) for up to 500 users. It includes everything in Starter plus group calling for up to 500 attendees, 15TB of storage, 50,000 automation runs, and more.
- Enterprise plan: Contact sales for custom pricing. Supports unlimited users and includes even more automation runs and advanced security, compliance, and management features.
Bonus: Lark templates for Fishbone diagram and root cause analysis
These ready made templates remove the need for manual formatting and let teams begin analysis immediately without building diagrams from scratch. Each template opens inside a shared Lark workspace, so teams can edit together, comment in real time, and attach follow up tasks or data without downloading separate files. This reduces the number of tools involved and keeps every step of analysis in one connected place. The templates can be reused across multiple projects, which is useful for teams that run regular RCA sessions or quality audits.
Fishbone diagram template
This template gives teams a ready built fishbone layout with editable branches for common categories like People, Process, Materials, Machine, Environment, and Measurement. It helps teams focus on brainstorming instead of designing shapes and spacing. The structure can be expanded or reduced depending on the problem depth. Since it opens inside Lark, multiple people can type ideas at the same time and update the diagram live.
Root cause analysis template
This template includes the fishbone diagram along with a validation table, corrective action planner, and results tracking sheet in one file. It is useful for teams that want a full RCA workflow instead of just a visual chart. Each section links to the next step, so analysis, decisions, and action follow ups stay connected. It saves time for teams who repeat RCA across different issues or departments.
5 whys root cause analysis template
This guided template helps teams drill down into each listed cause by asking "why" multiple times until the true root cause is confirmed. It works well as a follow up to a fishbone diagram because it validates whether a listed cause is only a symptom or the real source. The template keeps all "why" chains visible so patterns are easy to compare and share with decision makers.
Corrective action plan template
This template gives teams a structured way to document each corrective action, its owner, target deadline, and verification steps after RCA. It helps prevent identified causes from being forgotten once the fishbone session ends. Since the file lives in Lark, owners can update status and attach proof without sending separate reports. It is useful for auditors, project managers, and quality leads who need traceable action logs.
Decision tree template
This template helps teams evaluate multiple possible solutions once causes have been identified and verified. Users can map out different choices, consequences, probabilities, or cost levels before selecting the best action path. It is especially useful in cases where one root cause can lead to several possible responses. Sharing the decision tree inside Lark makes it easier to get team or stakeholder alignment before implementation.
Common use cases of fishbone diagrams
Fishbone diagrams are used when teams need to dig deeper into a recurring issue and identify what is really happening beneath the surface.
- Manufacturing and quality control: Many factories use fishbone diagrams to trace defects, delays, or equipment failures back to causes related to materials, machines, methods, or manpower. This helps quality teams reduce repeat errors instead of only reacting to the outcomes. The diagram becomes a shared record between production managers, engineers, and operators, so everyone understands why defects occur and what needs to change.
- Process improvement: Teams often use fishbone diagrams during lean or kaizen initiatives to uncover inefficiencies across departments. Instead of blaming single steps in a workflow, the diagram reveals how communication gaps, outdated policies, or technology limits contribute to delays. It also allows stakeholders to prioritize which root causes are worth solving first.
- Root cause analysis (RCA): When a recurring problem affects performance, service levels, safety, or customer experience, the fishbone format gives analysts a structured approach to investigation. The visual layout prevents scattered conversations and ensures every possible cause is considered before corrective actions are chosen. RCA teams often pair fishbone diagrams with 5 whys for deeper validation.
- Customer service and project management: Service teams and project leaders use fishbone diagrams to diagnose why tickets pile up, requests take too long, or deadlines are missed. By mapping causes tied to tools, staffing, workflows, and leadership decisions, teams can turn subjective complaints into objective insights that guide improvements. It also helps align different departments around one shared view of the issue.
Benefits of using a fishbone diagram
Fishbone diagrams offer several advantages when teams need clarity and alignment while solving problems.
- Encourages teamwork and structured brainstorming: Instead of one person writing ideas on a whiteboard, a fishbone diagram invites contributions from every role involved in the issue. This prevents blind spots and brings context from operations, management, suppliers, or customers into one shared view. The structure also keeps the session focused rather than turning into an unorganized idea dump.
- Helps identify hidden causes behind recurring problems: Many issues repeat because teams only treat symptoms instead of causes. By forcing teams to categorize ideas, the fishbone model reveals deeper patterns and connections that are often missed. This shift from assumption to analysis reduces the risk of spending time and budget on the wrong fixes.
- Improves clarity in decision-making: A completed fishbone diagram gives decision-makers a full picture of what might be driving the problem. Instead of debating opinions, teams can point to documented causes and supporting evidence. This shortens approval cycles and removes disagreements based on unclear or incomplete information.
- Visualizes complex relationships between contributing factors: When a problem spans multiple teams or processes, communicating it through text or spreadsheets can feel overwhelming. The fishbone layout makes it easier to see how different categories interact, which helps stakeholders understand the issue in seconds rather than paragraphs.
- Lays the foundation for preventive action: Once causes are classified and prioritized, teams can assign responsibility and begin correction plans. Because the diagram documents exactly how an issue forms, it becomes a reference for future training, audits, and quality checks. This makes prevention easier than reacting to problems again later.
Common mistakes to avoid when designing a fishbone diagram
Even though the fishbone format is simple, many teams reduce its effectiveness by treating it as a drawing instead of a thinking process.
- Listing only obvious causes without cross team input: A fishbone diagram loses its value when only one department contributes ideas. The goal is to uncover hidden factors that appear when operations, management, support, and technical teams think together. Limiting the diagram to one perspective usually leads to treating the wrong causes.
- Failing to validate causes with data: Brainstorming alone does not confirm root causes. Teams should add supporting facts, frequency counts, or real examples before marking a cause as high priority. Otherwise, follow-up actions might solve a low-impact issue while the real source continues.
- Overcomplicating the diagram with too many categories: Adding too many branches turns the diagram into clutter instead of clarity. Most fishbones only need 5 to 7 categories. If the structure becomes unmanageable, it is a sign that the problem needs segmentation, not more labels.
- Stopping at analysis without tracking corrective actions: A fishbone diagram is not a final result. If tasks are not assigned and progress is not tracked, the problem will return. Turning causes into owned actions is what creates improvement.
- Storing findings in disconnected tools instead of one shared system: screenshots, slides, and siloed documents make it difficult to update, share, or turn insights into execution. A connected workflow keeps problems, causes, actions, data, and communication on one platform.
Conclusion
Fishbone diagrams are one of the most effective ways to understand why problems occur, but their real power comes from using them as part of a complete problem solving system. When teams move beyond drawing the diagram and start tracking data, verifying causes, assigning actions, and reviewing outcomes, the process turns from analysis into improvement.
Traditional office tools can help with the visual layout, but they often break the workflow across multiple apps, making it hard to maintain alignment. Lark brings these steps into one shared workspace, so brainstorming, databases, charts, tasks, and communication stay connected from the moment the problem is defined until the solution is complete.
FAQs
What's the difference between a fishbone diagram and root cause analysis?
A fishbone diagram is mainly used to visually map out all the possible causes behind a problem so teams can see patterns and categories clearly. Root cause analysis is the wider process that happens after this mapping step, where causes are validated, tested, and narrowed down to the real source. The fishbone helps organize thinking, while RCA turns that thinking into verified conclusions. Many teams start with the fishbone, then move into data review, ownership, and corrective actions. A shared workspace makes it easier to move from the diagram to the full RCA workflow without losing context.
Can I use Lark to draw a visual fishbone diagram?
Teams can create a fishbone layout inside a Lark Doc, add branches and causes together, and keep it editable instead of exporting screenshots. The diagram can also stay linked to comments, files, and task assignments so it does not become static or outdated. Since everything updates live, teams can refine causes with new information instead of rebuilding the layout each time. This makes the diagram part of an ongoing problem solving flow rather than a one-time visual. Lark keeps the diagram connected to the next steps instead of existing as a separate file.
What teams benefit most from using fishbone diagrams?
Teams that deal with recurring issues, quality checks, or delays benefit the most from fishbone diagrams because they need structured thinking before fixing problems. Common users include manufacturers, engineering teams, customer support, logistics, and operations groups that want clarity before choosing solutions. Project managers and service teams also use it to reduce repeated complaints or missed deadlines. The diagram helps different departments see the same problem from one shared view. When combined with a workspace, it becomes easier to turn ideas into data and follow up actions.
How can Lark automate follow-up actions from analysis findings?
After causes are identified, teams can turn them into trackable tasks directly inside the same workspace without copying anything manually. Each action can have an owner, deadline, priority, and status update that others can monitor live. Automatic reminders prevent delays, and progress stays visible to every stakeholder without extra meetings. Since tasks stay linked to the original cause record, no one loses the reason behind the action. This helps teams complete the full RCA cycle instead of stopping at the diagram stage.
Are Lark fishbone templates free to use?
Yes, the fishbone and RCA templates can be opened, duplicated, and edited in any free Lark workspace with no extra installation or premium add on. Teams can use them to start brainstorming instantly instead of building diagrams from scratch. The templates are also designed to connect with Lark Docs, Base, Tasks, and Sheets, so the workflow does not break between steps. Users can customize labels, branches, and layouts without altering the original version. This makes it easy to reuse templates across multiple problem solving sessions or departments.
Related reading
Table of contents
Start using Lark today

Manage all your work in one place
Boost team efficiency by 10x
Save up to 70% on software costs
Table of contents
Start using Lark today
Manage all your work in one place
Boost team efficiency by 10x
Save up to 70% on software costs
Keep reading







2026 Lark Technologies Pte. Ltd.
Headquartered in Singapore with offices worldwide.






Explore: