














Kanban Chart: Definition, Templates, and Gantt Comparison

Ryan Tanner
Product Marketing Specialist
Sep 18, 2026
Ryan Tanner
Sep 18, 2026

15 min read


The ability to clearly see and manage work is foundational to successful teamwork. This is precisely why visualizing work progress is essential for teams, as it promotes transparency, identifies roadblocks, and helps maintain a steady flow of delivery. A Kanban chart is a visual tool that tracks tasks across workflow stages, often combined with flow charts or metrics to monitor flow and performance.
While teams often debate the optimal approach between Kanban vs. Gantt charts, collaborative platforms like Lark Base and Sheets are resolving this by bringing both visualization methods into one unified, collaborative space.

What is a Kanban chart?
A Kanban chart is a highly visual project management tool designed to track, manage, and optimize the flow of tasks through a defined workflow. It originated from the lean manufacturing principles of the Toyota Production System and is now a core component of Agile and DevOps methodologies. The primary goal is to provide transparency, limit work-in-progress (WIP), and maximize efficiency (or flow).
Common forms of Kanban charts
The term "Kanban chart" generally refers to two distinct visual formats used for managing work and analyzing performance:
In collaborative tools, these forms are often interconnected. In a system like Lark Base, a Kanban board appears as a drag-and-drop board view for easy task management and real-time progress tracking. Concurrently, Lark Sheets can be used to capture the raw data from the board and visualize the workflow metrics (cycle time, throughput, etc.) in a dynamic Kanban flow chart for deep performance analysis.
Kanban chart templates
The power of the Kanban chart automatic lies in its adaptability. While the basic structure remains constant, columns representing stages and cards representing tasks, the names of these columns can be customized to model virtually any repeatable process across an organization. This flexibility makes Kanban an indispensable tool for teams far beyond software development. Here are five common and highly effective Kanban chart templates that visualize different business workflows:
The Lark advantage
Modern platforms, like Lark Base, move beyond static boards by offering these templates as a starting point. Teams can use pre-built Lark Base templates for Kanban charts that are fully customizable—allowing users to add unique columns, fields, and views.
Crucially, these Kanban boards are connected to the platform's ecosystem, integrating with Tasks, Calendar, and an automated workflow engine for features like setting reminders, triggering approval flows, or automatically updating a stakeholder via messaging when a card moves to the "Done" column. This transforms the visualization tool into a proactive, collaborative workspace.
Gantt chart vs Kanban chart
Gantt charts and Kanban boards are two of the most popular and powerful project management tools in modern project management, but they serve fundamentally different purposes based on their structure. Understanding these differences is key to choosing the right tool for a given project or workflow.
Core differences in focus and structure
The primary distinction lies in how they visualize work: Gantt charts are timeline-based, and Kanban boards are flow-based.
When to use each tool
The nature of the project, specifically, the need for fixed deadlines versus the need for rapid adaptation, determines the best fit.
Gantt Charts: the project roadmap
Gantt charts excel at planning and providing a big-picture overview of an entire project lifecycle.
- Best for: Structured, deadline-driven projects with clear start and end dates (e.g., construction, product launches with fixed release dates, major IT deployments, financial reporting deadlines).
- Why: They are essential when tasks have dependencies (Task B cannot start until Task A is complete). The chart maps these relationships visually, identifies the critical path (the sequence of tasks that determines the shortest possible project duration), and allows for detailed resource allocation over time. They are the ideal tool for communicating high-level schedules to executives and stakeholders.
Kanban Charts: the daily workflow tracker
Kanban boards excel at execution and managing the day-to-day flow of tasks.
- Best for: Ongoing, adaptive workflows or processes where the priority is throughput and continuous delivery (e.g., IT support and maintenance, creative content production, agile software development sprints, sales pipelines).
- Why: The flow-based structure highlights task progress and bottlenecks in real-time. By enforcing Work-in-Progress (WIP) limits (restricting the number of tasks in the "In Progress" column), teams are encouraged to focus on finishing work before starting new work, which is the core principle of optimizing efficiency and continuous flow.
Lark: the best of both worlds
In modern, integrated platforms, the choice doesn't have to be either/or. Lark Base provides a solution by unifying these visualization tools. Teams can define their project data once and then dynamically switch between Kanban boards and Timeline views (Gantt-like charts).
This integration ensures that the detailed scheduling, dependencies, and deadlines tracked on the timeline are always in sync with the real-time execution and flow management visible on the Kanban board. This gives teams a powerful, holistic approach to project management: big-picture planning paired with adaptive daily execution.
Benefits of using Kanban charts
The Kanban chart's visual simplicity and focus on continuous flow deliver several core benefits that significantly enhance team performance and project predictability.
1. Clear visibility of work in progress (WIP)
The visual nature of the Kanban board, with tasks moving across columns, provides instant transparency into the current status of all work. At a glance, everyone on the team and all stakeholders can see:
- What tasks are prioritized and ready to start.
- Which tasks are currently being worked on.
- Where tasks are stalled or blocked.
This real-time clarity ensures all team members are on the same page and focused on the highest-priority items.
2. Flexibility to adapt workflows
Kanban is an adaptive system. Unlike the rigid, fixed timelines of a Gantt chart, a Kanban chart allows for changes in priority and scope at any time. New tasks can be added to the backlog, and the order of cards in the "To Do" column can be instantly adjusted based on shifting customer needs or organizational demands. This inherent flexibility makes it ideal for environments where priorities change frequently.
3. Easy identification of bottlenecks
One of the most powerful benefits is the ability to spot bottlenecks immediately. A bottleneck is represented by a column where task cards pile up faster than the team can pull them into the next stage. By using WIP limits (the maximum number of tasks allowed in a column), the chart forces the team to address the constraint, unblocking the stalled work or collaborating to finish tasks in the bottlenecked stage, before starting new work. This focus minimizes waste and maximizes throughput.
4. Encourages collaboration and focus
Because the flow of work is the team's shared focus, Kanban naturally encourages collaboration. When a column hits its WIP limit, team members who have finished their current tasks are incentivized to help colleagues resolve the blockage, rather than starting a new, low-priority task. This "swarming" behavior strengthens teamwork and ensures the continuous delivery of value.
The Lark integration: real-time teamwork
In collaborative platforms like Lark, Kanban charts move beyond mere visualization. Unlike basic standalone tools, Lark Kanban charts are synced with Messenger and Calendar for real-time collaboration. Teams can receive automated instant notifications in a chat group when a card is moved to a new stage or a task due date is approaching. They can also initiate direct conversations or schedule a quick meeting directly from the task card, ensuring that all discussions, context, and decisions remain permanently linked to the relevant work item.
Challenges of Kanban charts
While Kanban charts offer flexibility and excellent visibility, they are not without potential drawbacks. These challenges primarily arise when teams fail to fully adhere to the core principles of the Kanban methodology or when they try to apply the tool to an unsuitable type of project.
Overcoming challenges with automated workflows
Many of the challenges associated with Kanban stem from the need for constant vigilance and manual enforcement of rules (like keeping WIP limits). Modern integrated tools mitigate these issues through automation.
With a platform like Lark, the Kanban chart is powered by an automated workflow engine that can:
1. Enforce rules and prevent overload: Automatically prevent new tasks from being pulled into a column if the pre-defined WIP limit is reached, effectively stopping mismanagement before it occurs.
2. Send task reminders: Trigger automatic reminders to assigned team members if a task has remained in a single column for too long (indicating a stall or bottleneck) or if a deadline is approaching.
3. Prevent bottlenecks automatically: Set up rules to notify a manager or a specific cross-functional team if a bottleneck column is nearing its limit, prompting immediate collaboration to clear the blockage.
This integration transforms the Kanban chart from a passive visualization tool into a proactive, self-managing workflow system.
How to create a Kanban chart in Lark
The Lark platform, through its database feature (Lark Base), allows you to quickly set up a dynamic Kanban chart that automatically connects your work with calendars, tasks, and team messaging. This chart serves as both a visual workflow tool and a data source for tracking performance metrics.
Step 1: Open Lark Base and choose a Kanban template
To begin, navigate to Lark Base and create a new table to house all your project data. Select a pre-existing Kanban template (such as Project Management or HR Recruitment) that best aligns with your team's process. Choosing a template immediately visualizes your table data as a flow-based board, complete with initial columns, saving you time during the initial setup.
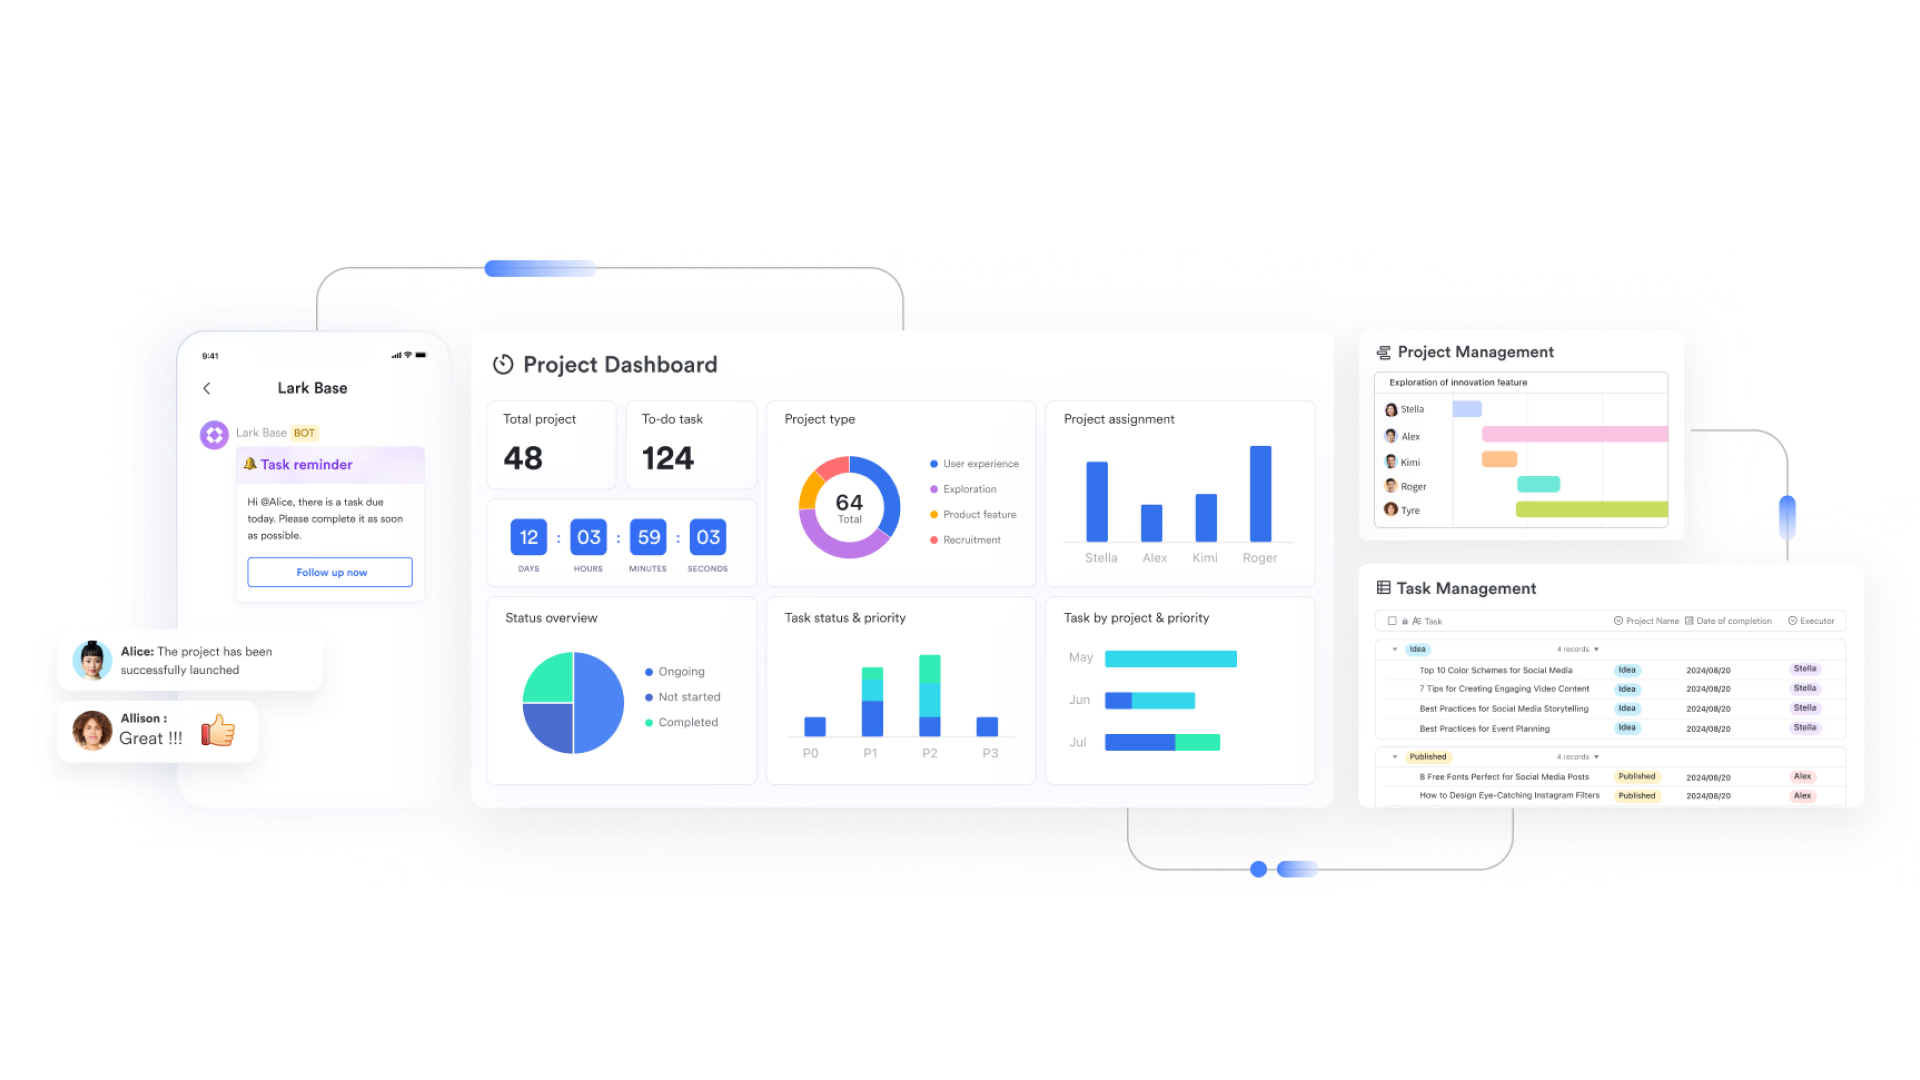
Step 2: Define workflow stages as columns
Next, customize the columns to precisely reflect every critical stage of your team's process (e.g., "Awaiting Approval," "Development," or "Client Review"). You can easily add, rename, or delete these columns to accurately map your unique workflow from start to finish, as these columns establish the essential framework that guides tasks to completion.
Step 3: Add tasks/cards and assign owners
Now it's time to populate the board: each task becomes a card containing all necessary details like description, attachments, and due dates. Ensure you assign a clear owner to each card, so accountability is always visible and defined. Finally, move these newly created cards into the initial "To Do" or "Backlog" column to establish the waiting work queue.
Step 4: Set WIP limits and automate updates
To enforce the core Kanban principle of focused work, set Work-in-Progress (WIP) limits on high-traffic columns to prevent team overload. You can then use Lark's automated workflow feature to define powerful rules, such as sending an automatic reminder if a card is stalled for more than 3 days, or triggering a notification in a Lark Messenger group whenever a card is moved to the "Done" column.
Step 5: Use sheet waterfall charts to track metrics
Since your Kanban data is housed in Lark Base, you can easily generate connected Sheets views and reports. Use the charting capabilities in sheets (such as a waterfall or simple bar chart) to track essential flow metrics. Monitor key performance indicators like Cycle Time (the duration from a task's start to its finish) or Throughput (the number of tasks completed per week) to ensure continuous process improvement.
Once your Kanban chart is up and running, your team can manage projects with complete visibility—from tracking daily progress to analyzing performance trends. Because all of this happens within one connected workspace, there's no need to juggle multiple tools or data sources.
For teams ready to scale their workflow management, Lark offers flexible plans designed to fit businesses of every size.
- Starter plan: Free forever plan that includes 11 powerful tools for up to 20 users. It also comes with 100GB of storage, 1000 automation runs, AI translations, and more.
- Pro plan: $12/user/month (billed annually) for up to 500 users. It includes everything in Starter plus group calling for up to 500 attendees, 15TB of storage, 50,000 automation runs, and more.
- Enterprise plan: Contact sales for custom pricing. Supports unlimited users and includes even more automation runs and advanced security, compliance, and management features.
Conclusion
Kanban charts are fundamentally visual workflow tools, ideal for adaptive teams who prioritize continuous flow, flexibility, and limiting work-in-progress (WIP). They are superior for managing operational processes, maintenance, and iterative development where the focus is on speed and status.
By leveraging Lark Base and its integrated Sheets and Calendar functions, teams no longer have to choose between visualization tools. They gain the adaptive strength of Kanban boards for execution, the timeline rigor of Gantt-like charts for long-term planning, and advanced flow charts for performance tracking, all synchronized within a single, collaborative platform.
FAQs
What industries use Kanban charts the most?
Kanban charts originated in manufacturing (Toyota) but are now predominantly used in software development and IT. They are also widely adopted by marketing, HR, and customer support teams for process management. Because Lark integrates Kanban with messaging and core business data, it's effectively used by teams across all departments, from finance to operations, for transparency and flow.
Can Kanban charts be used for personal productivity?
Yes, many individuals use a simple Kanban board (like To Do, Doing, Done) to visualize personal tasks, goals, or workflows. This visual clarity helps maintain focus and prevent context-switching overload. Users can create a private Kanban board in Lark Base, linking personal tasks to their Lark Calendar and receiving direct, automated reminders.
How do Kanban charts help with remote team management?
Kanban provides a single source of truth for the work pipeline, making progress instantly visible across different time zones. It minimizes the need for status meetings by keeping everyone updated in real-time. Lark's real-time messaging integration ensures that remote team members are instantly notified of status changes, fostering asynchronous collaboration and reducing communication delays.
What metrics should I track with a Kanban chart?
The primary metrics are Cycle Time (how long work takes from start to finish) and Throughput (how many items are completed over a period). These measure process speed and predictability. Lark Base and Sheets automatically capture this flow data, allowing users to generate charts to calculate and track Cycle Time without manual logging.
How do Kanban charts support Lean and Agile principles?
They support Lean by limiting Work in Progress (WIP) to reduce waste and accelerate flow, and they support Agile by providing transparency and favoring flexible responses to change. Lark's automated WIP limits and rules help teams enforce these principles systematically, turning visual guidance into built-in process constraints.
Can Kanban charts replace project timelines entirely?
No, Kanban charts are flow-based and do not inherently track task dependencies or fixed deadlines required for complex, structured projects. They focus on status rather than schedule. This limitation is solved in Lark, where the same project data can be toggled to a Timeline (Gantt-like) view for scheduling and dependency mapping.
Are Kanban charts suitable for long-term projects?
They are excellent for the execution phase of long-term projects, managing continuous, iterative development and maintenance tasks. However, they are less suited for the initial, high-level planning phase. By using Lark Base, a long-term project can utilize a Gantt chart for the high-level roadmap and a synchronized Kanban board for daily work execution.
Related reading
Table of contents
Start using Lark today

Manage all your work in one place
Boost team efficiency by 10x
Save up to 70% on software costs
Table of contents
Start using Lark today
Manage all your work in one place
Boost team efficiency by 10x
Save up to 70% on software costs
Keep reading







2026 Lark Technologies Pte. Ltd.
Headquartered in Singapore with offices worldwide.






Explore: