














How to Create a Dashboard in Jira: Step-by-Step Guide

Ryan Tanner
Product Marketing Specialist
Sep 18, 2026
Ryan Tanner
Sep 18, 2026

17 min read


A Jira dashboard gives every project team a single, visual snapshot of progress, bottlenecks, and performance trends. Whether you manage sprints, bug fixes, or releases, dashboards turn issue lists into clear visual stories that help teams stay aligned. But creating a useful dashboard can take more than adding gadgets. It's about connecting data, context, and communication.
This guide shows you exactly how to create a dashboard in Jira with filters, widgets, and project data. It also explores how Lark makes dashboards collaborative, transforming metrics into shared insights and action plans that move projects forward faster.

What is a Jira dashboard?
A Jira dashboard is a customizable workspace that gives teams a visual overview of project activity, progress, and workload status in real time. Instead of manually checking multiple issue screens or reports, users can display key metrics in one place using gadgets such as pie charts, sprint burndown charts, velocity reports, issue statistics, and activity streams. Dashboards help teams monitor priorities, spot bottlenecks, and track performance against deadlines, making them especially valuable for Agile teams, QA groups, engineering squads, and project managers who need instant clarity during fast-moving sprints.
A well-designed dashboard turns raw Jira ticket data into clear insights that support better decisions during standups, retrospectives, and stakeholder reviews. Learning how to create a dashboard in Jira enables you to personalize filters, select the appropriate visual components, and share dashboards with teammates or leadership, ensuring everyone views the same source of truth. This keeps the workflow transparent and reduces time spent jumping between reports.
Common dashboard types
Different projects require different dashboards. Jira offers flexible formats that can be tailored to each goal. Understanding the common types helps you decide which one suits your team's workflow best.
- Agile sprint dashboards: Agile sprint dashboards visualize sprint health and team velocity. They typically include charts such as burndown, cumulative flow, and story progress by assignee. These dashboards help Scrum Masters spot whether teams are on track and how much work remains before sprint closure. By tracking velocity trends and issue statuses, you can make daily stand-ups more focused and data-driven.
- Project management dashboards: Project management dashboards display overall task distribution, timelines, and milestone progress. They combine metrics like issue aging, due dates, and workload balance. For large projects, such dashboards make it easier to monitor cross-team dependencies and deadlines. Learning how to create a dashboard in Jira for a project ensures you always have visibility into deliverables and risks.
- QA and test dashboards: QA teams use dashboards to track defect discovery, severity, and test execution rates. They often include metrics like open bugs, resolution time, and test coverage per release. Knowing how to create test execution dashboards in Jira helps QA maintain quality and identify recurring issues faster.
- Team performance dashboards: These dashboards focus on productivity and workload distribution. They display metrics such as assigned tickets per member, completed vs pending issues, and average cycle time. Managers can quickly assess who's overloaded, where bottlenecks occur, and how overall throughput changes over time.
How to create a dashboard in Jira
Creating a dashboard in Jira involves a few practical steps. Once you know the sequence, it's easy to repeat for multiple projects or teams. This section explains how to create a dashboard in Jira with filters and gadgets for specific insights.
Step 1: Access dashboards in Jira
From the top navigation bar, go to Dashboards → Create New Dashboard. Enter a name, a short description, and choose visibility settings: private, shared, or global. Selecting visibility carefully ensures the right audience can access it. Shared dashboards work best for team projects, while private ones are ideal for experimentation or personal tracking.
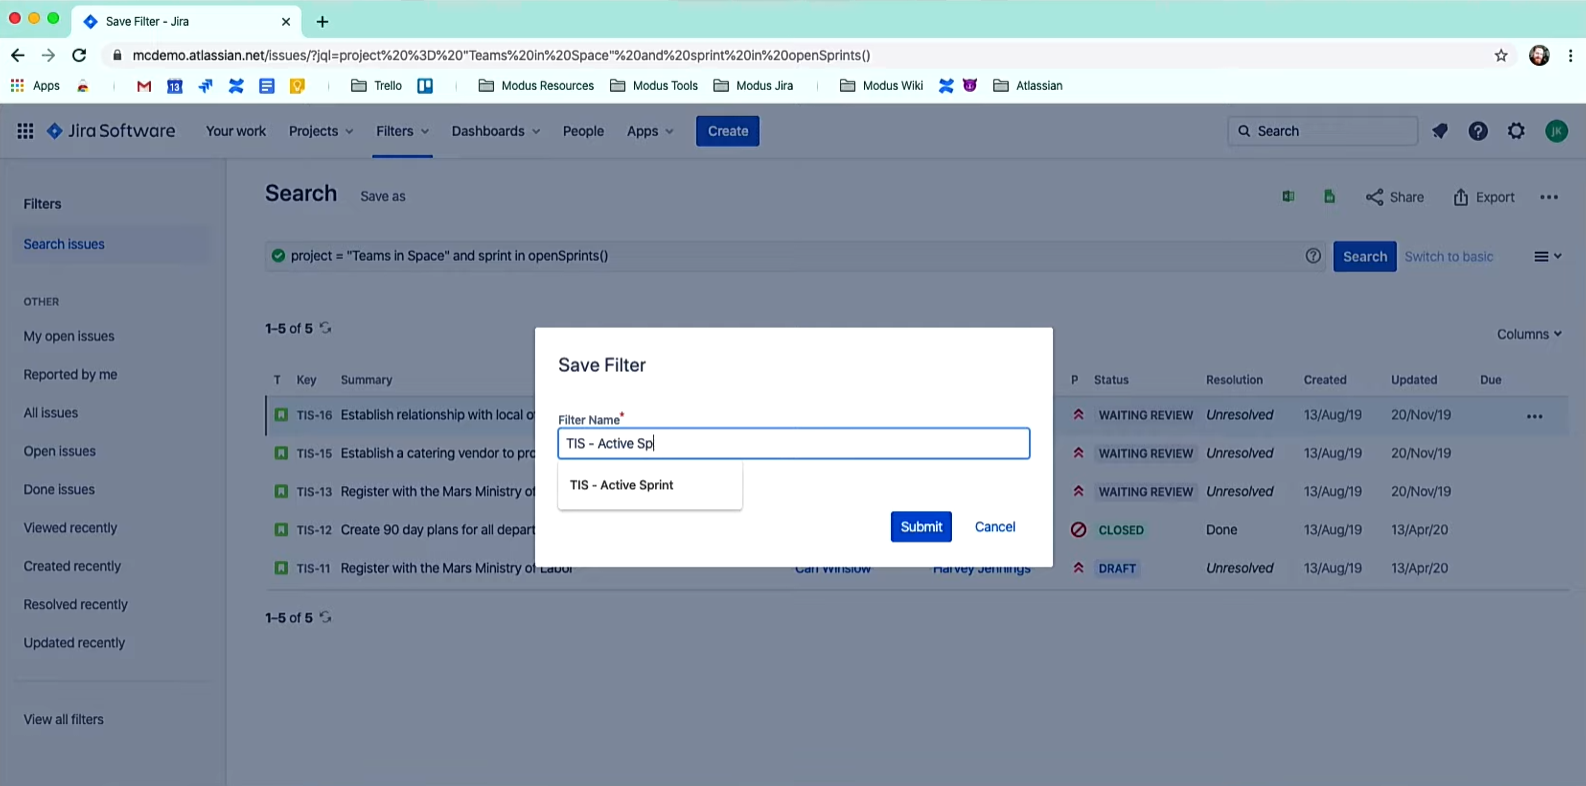
Image source: youtube.com
Step 2: Add gadgets (widgets)
After creating your dashboard, click Add Gadget. Choose from Jira's built-in options like:
- Assigned to Me
- Created vs Resolved Issues
- Sprint Burndown Chart
- Two-Dimensional Filter Statistics
- Pie Chart or Heatmap
Each gadget provides a different perspective. For example, "Created vs Resolved Issues" helps track workflow balance, while "Pie Chart" visualizes issue types. Adjust refresh intervals to keep data live.
Step 3: Create filters for dashboard data
To control what data appears, go to Filters → Create Filter. Use JQL (Jira Query Language) to define criteria such as project, sprint, issue type, or assignee. Save the filter and share it if others reuse it. Knowing how to create a filter in the Jira dashboard ensures data consistency across multiple dashboards.
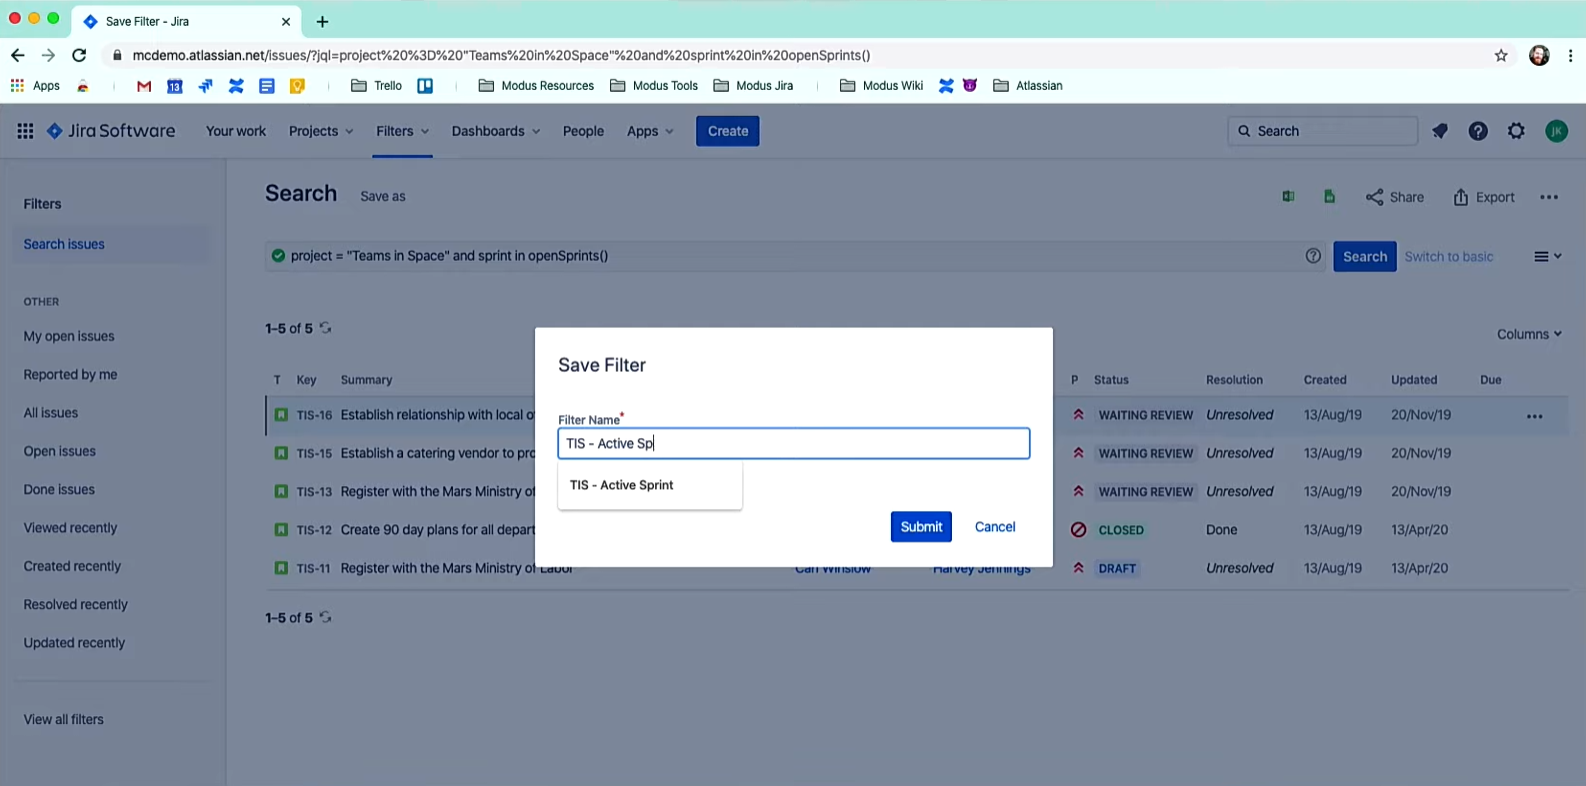
Image source: youtube.com
Step 4: Configure layout and data sources
Jira lets you organize gadgets in one, two, or three-column layouts. Place high-priority metrics at the top. Adjust gadget settings for data refresh rate and sharing options. If you're learning how to create dashboard in Jira for a project, keep stakeholder metrics separate from internal tracking widgets for clarity.
Step 5: Share your dashboard
Once configured, share your dashboard by selecting specific users, groups, or making it public inside your Jira instance. Shared dashboards support alignment across teams, enabling everyone to see the same project truth.
Why dashboards alone aren't enough
While Jira dashboards are powerful for tracking issues and sprint data, they can feel fragmented when teams need to collaborate, share context, or connect insights across departments. Creating filters, configuring gadgets, and sharing dashboards often requires multiple steps and follow-up discussions still happen elsewhere, in chat or email.
With Lark, the process becomes far smoother. Instead of jumping between tools, teams can build dashboards, analyze metrics, and communicate directly within one workspace. Lark brings together data visualization (via Sheets and Base), documentation (Docs), task management (Tasks), and real-time discussion (Messenger) creating a connected loop from insight to action.
Smart solution: Use Lark to generate a dashboard and manage a project
Jira dashboards help teams monitor progress, but they often stop at visualization. Once insights are spotted, teams still need a place to discuss them, assign owners, and follow up on actions. That usually means exporting charts into chat, slides, or emails, which breaks the workflow. Lark removes that gap by bringing dashboards, analysis, communication, and task execution into one connected workspace. Instead of switching tools, teams move from data to decision to action without losing context.
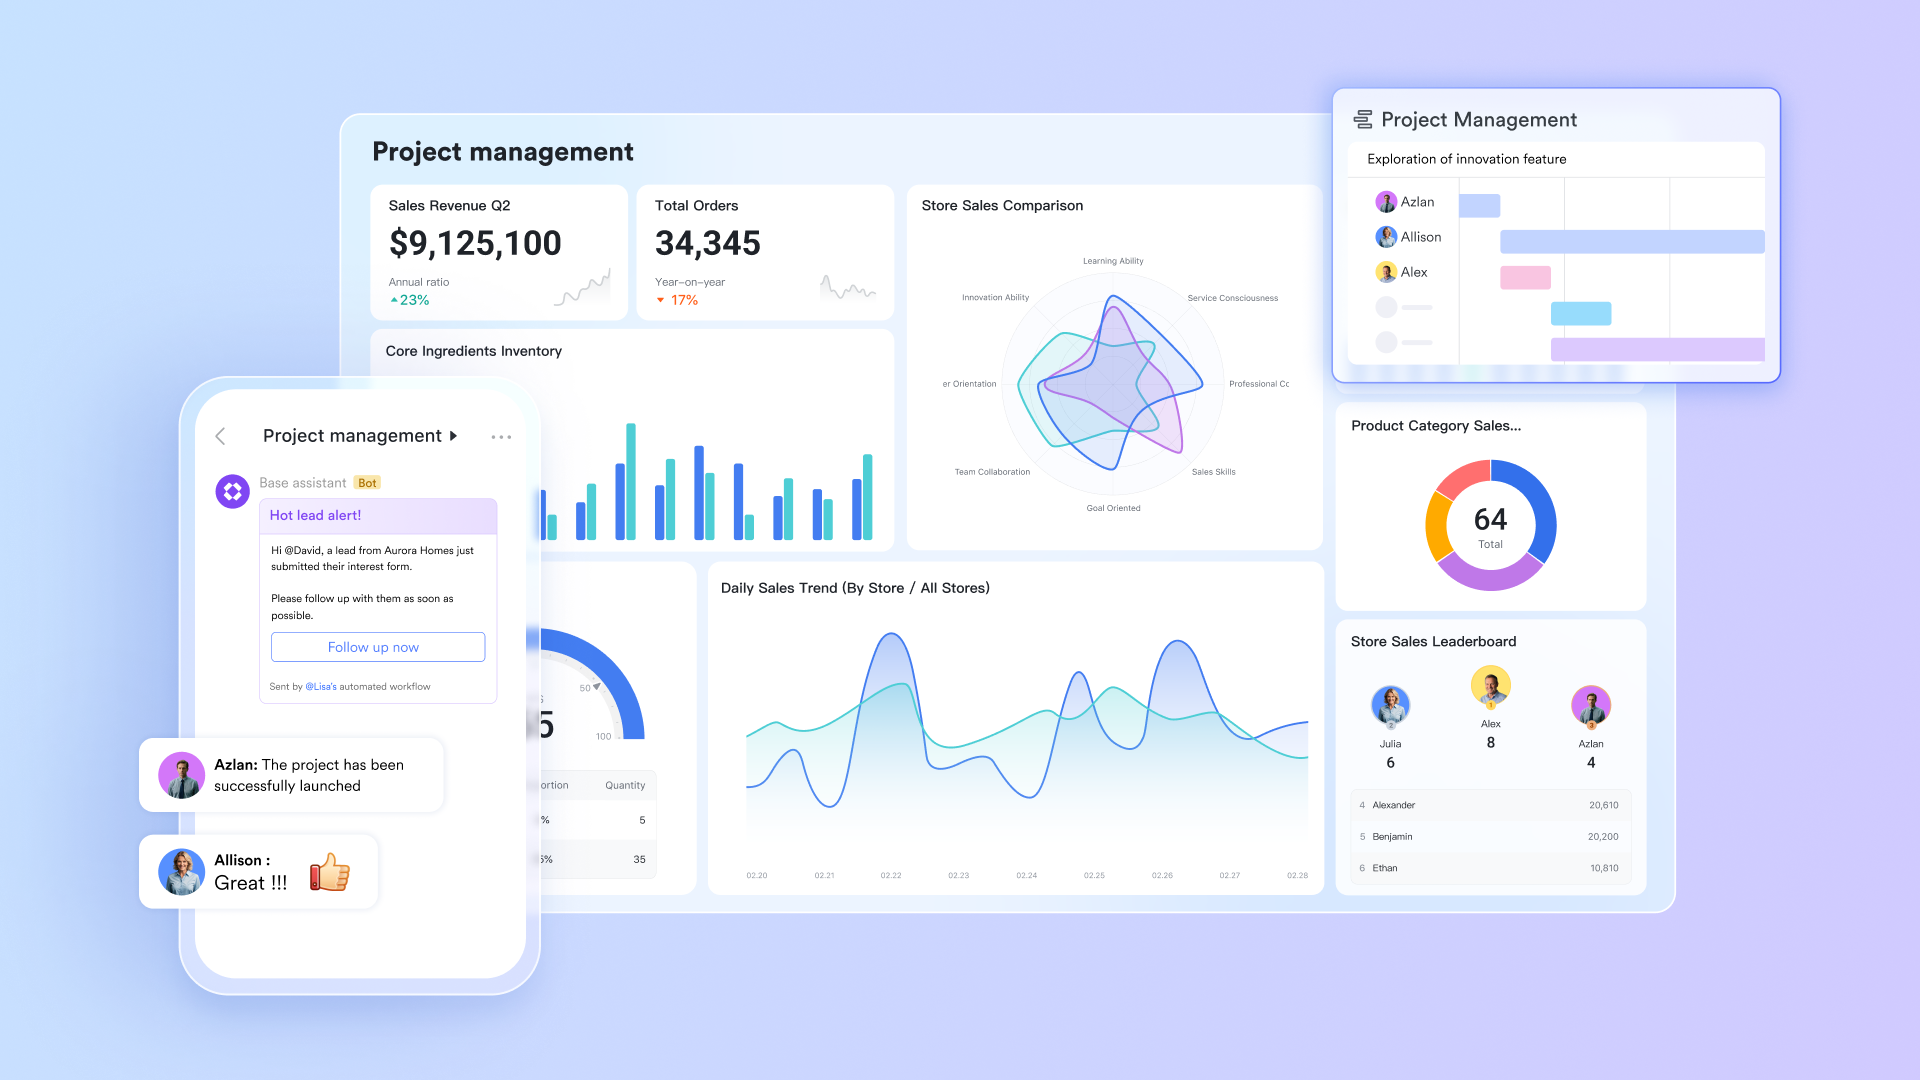
Lark Base: Build interactive dashboards beyond Jira
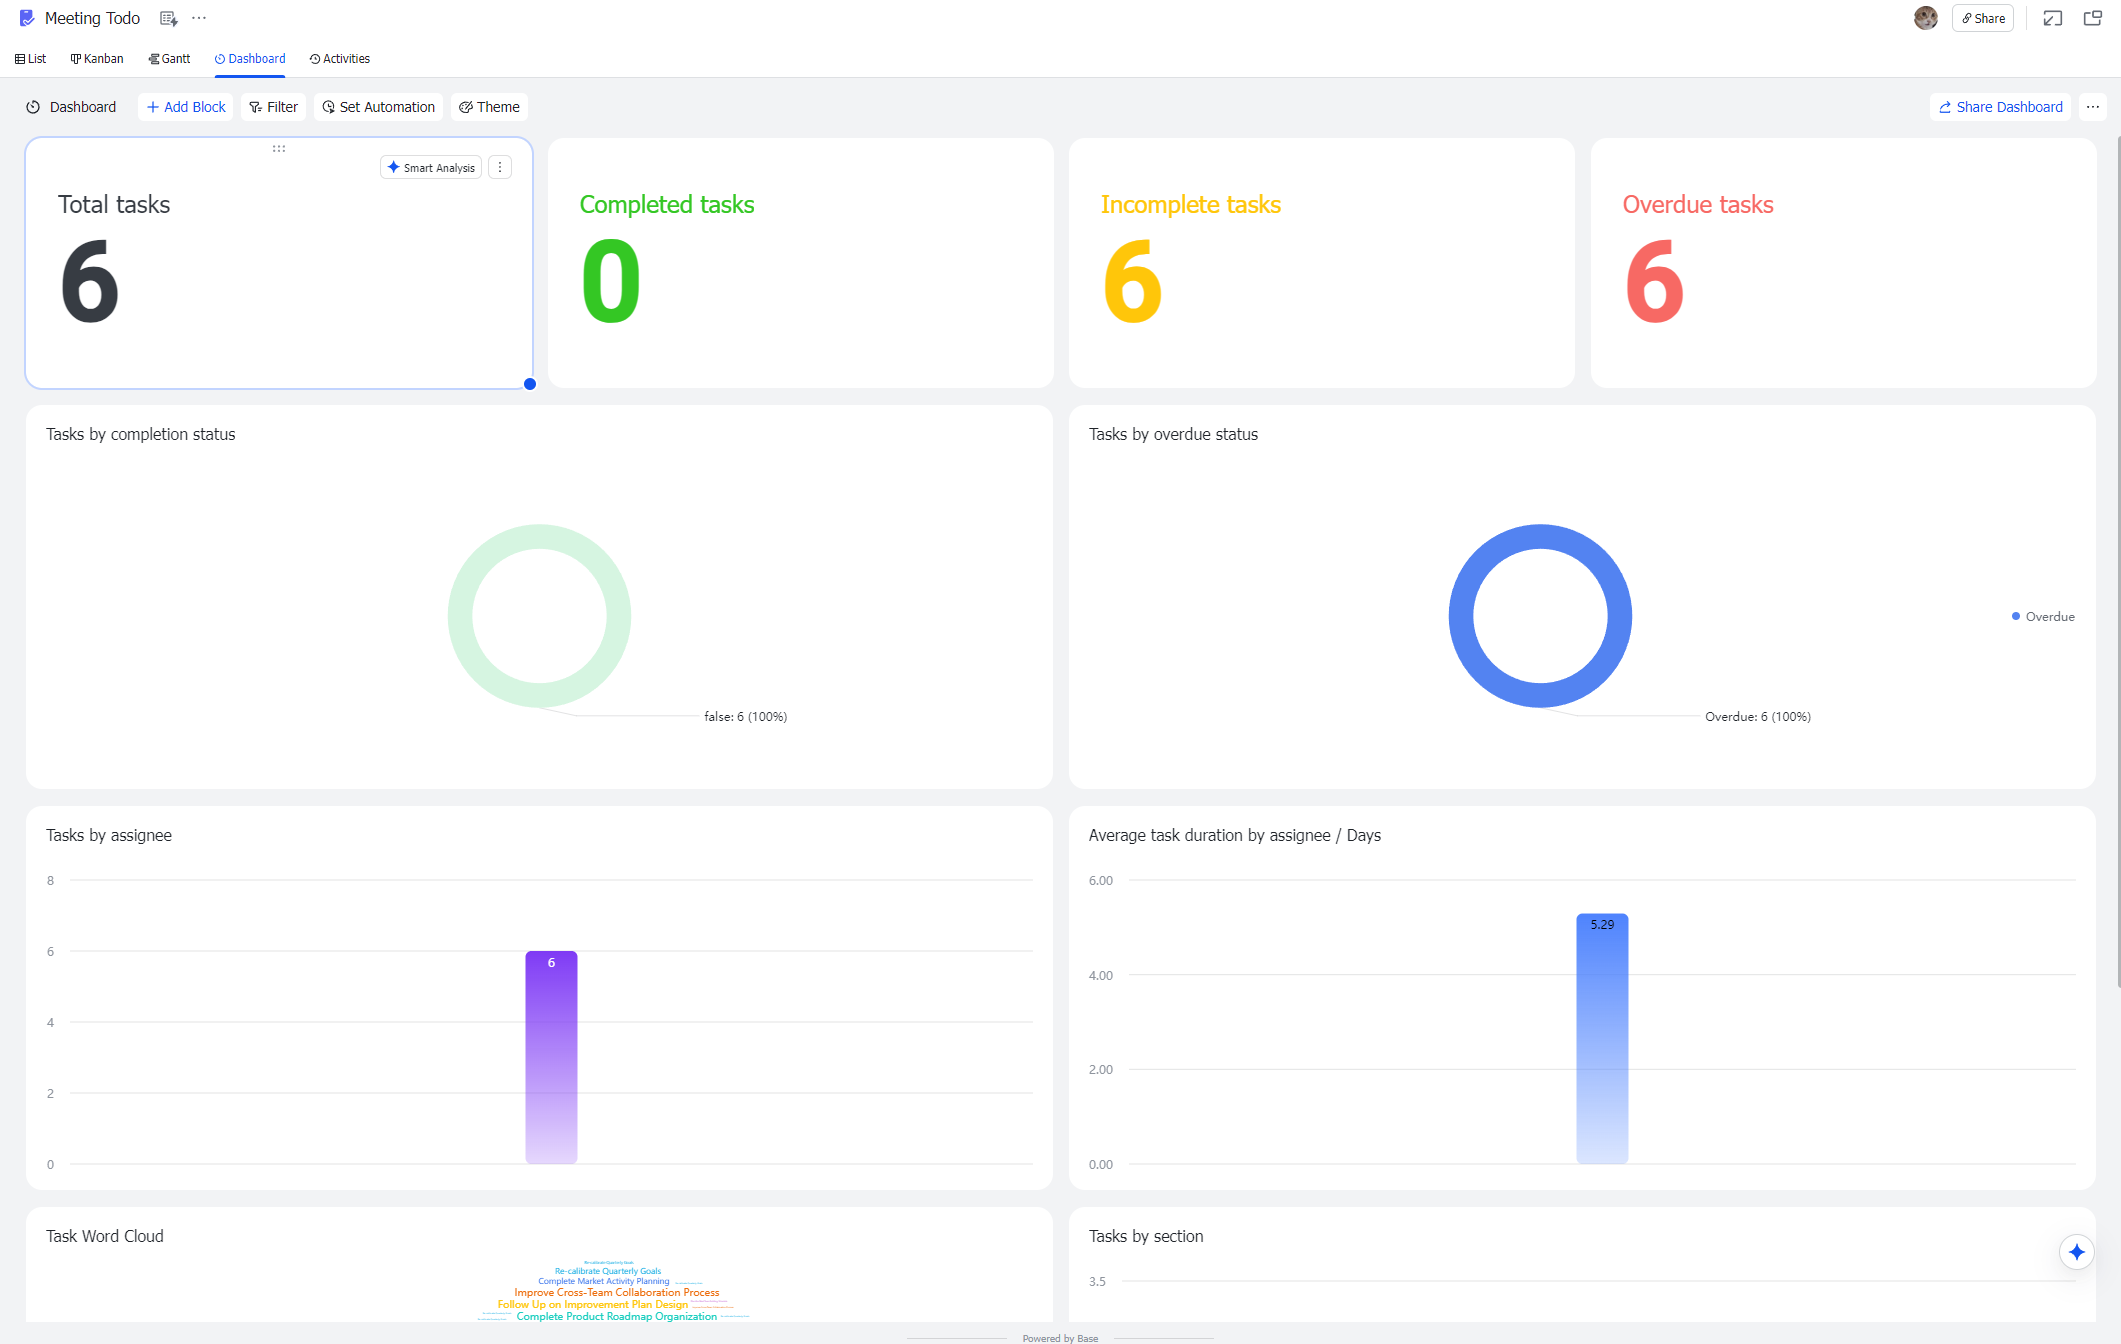
Lark Base acts as a living data layer for metrics you track in Jira. Based on your data in Base, you can instantly generate a dashboard with one click. It also provides interactive features, such as clicking on metrics or rankings to view details. You can create custom tables for sprints, issues, and risk items, add fields such as severity, owner, stage, and ETA, and switch between Kanban, timeline, or chart views. You can configure dashboard permissions independently from table permissions, enabling granular control over who can view or edit dashboards.
When you know how to create a dashboard in Jira with filters, Base becomes the next step, turning those filtered insights into structured, trackable plans that assign ownership and drive action.
Lark Tasks: Convert insights into follow-ups
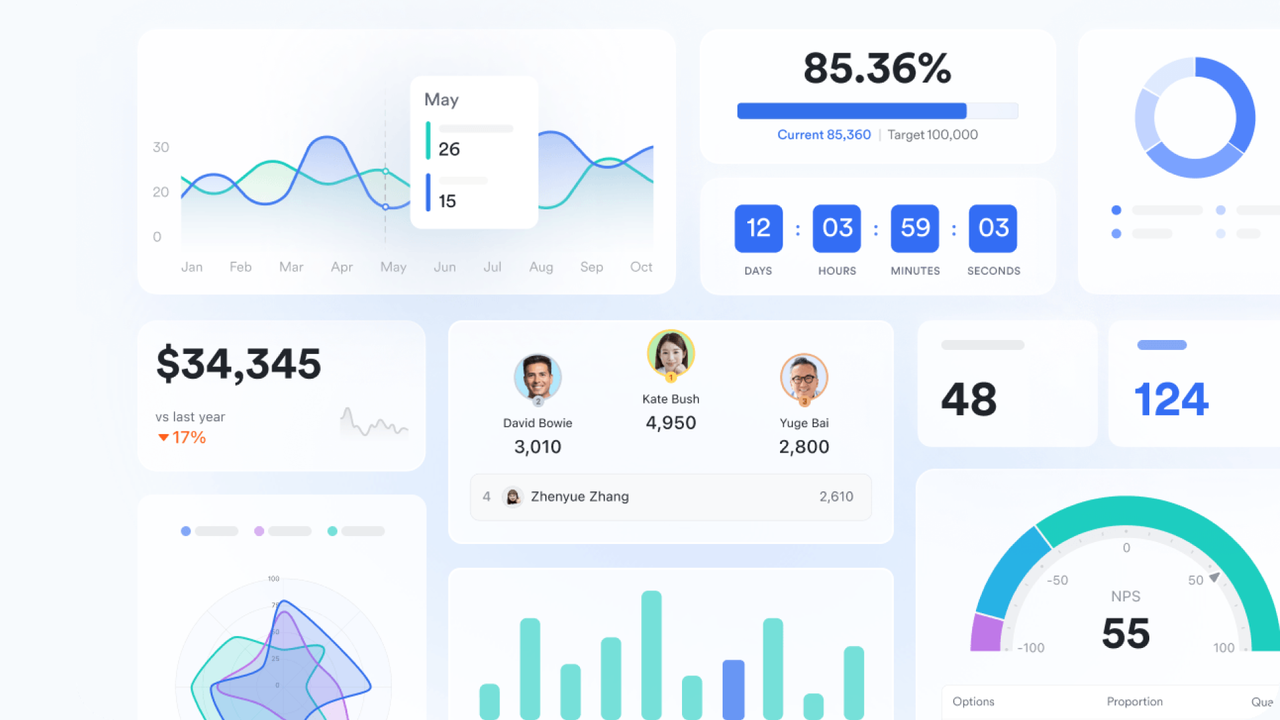
In Lark Tasks, you can create tasks, assign owners—including internal and external contacts—and set due dates. Each task list can generate a dashboard that links to a Base, though only one dashboard per list is supported. Dashboards can be viewed and edited directly within the task list or the linked Base, providing easy access to track team objectives and monitor task progress for full visibility.
For example, if your dashboard shows a recurring blocker, Lark tasks help assign remediation steps. Combined with Base and Sheets, it gives leaders full visibility into progress from insight to resolution.
Lark Sheets: Organize and calculate Jira metrics efficiently
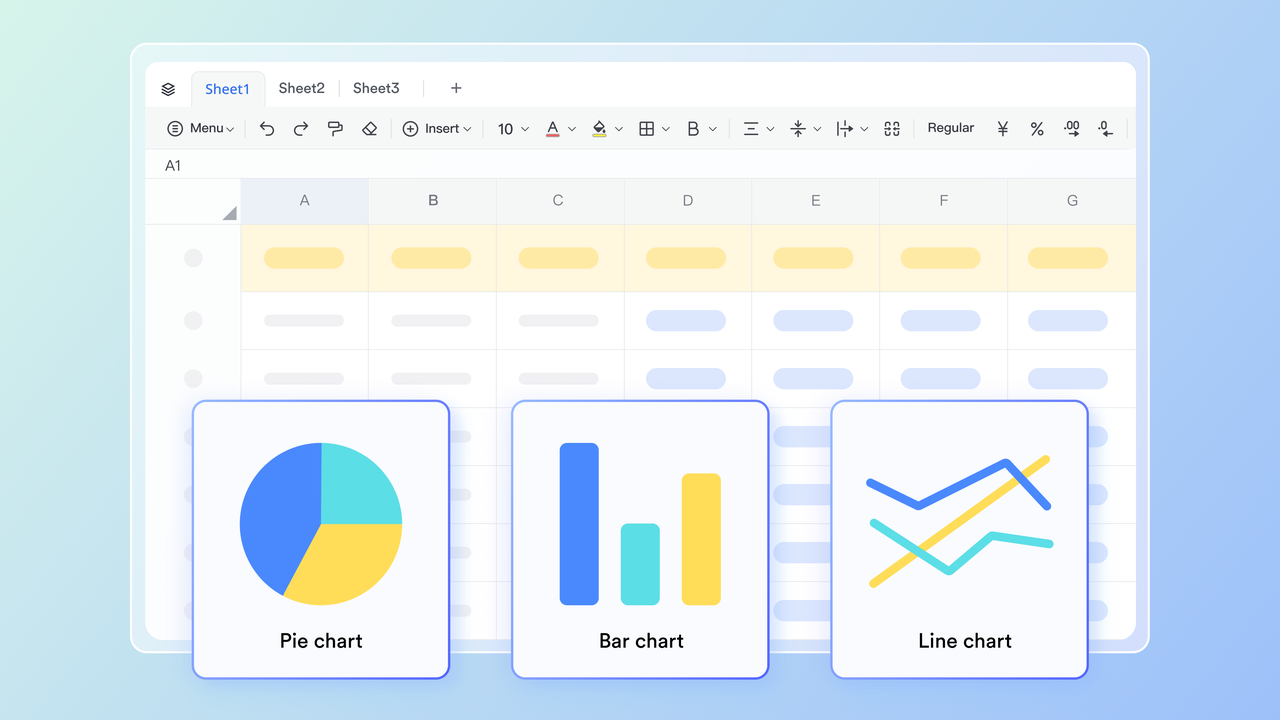
Lark Sheets helps you manage and analyze Jira data through flexible, spreadsheet-style operations. You can import Jira exports or base data, apply formulas, and run pivot comparisons to calculate metrics like sprint velocity, issue resolution time, or workload distribution. Sheets make it easy to clean, filter, and compute performance values before visualizing them in Lark Base dashboards.
If you already create filters in Jira for dashboards, Sheets adds another layer of control—allowing you to manipulate raw data, test scenarios, or prepare custom reports without overwriting original records. It’s ideal for teams that want precise, data-driven insights to support agile reviews and performance evaluations.
Lark Messenger: Real-time collaboration around dashboards
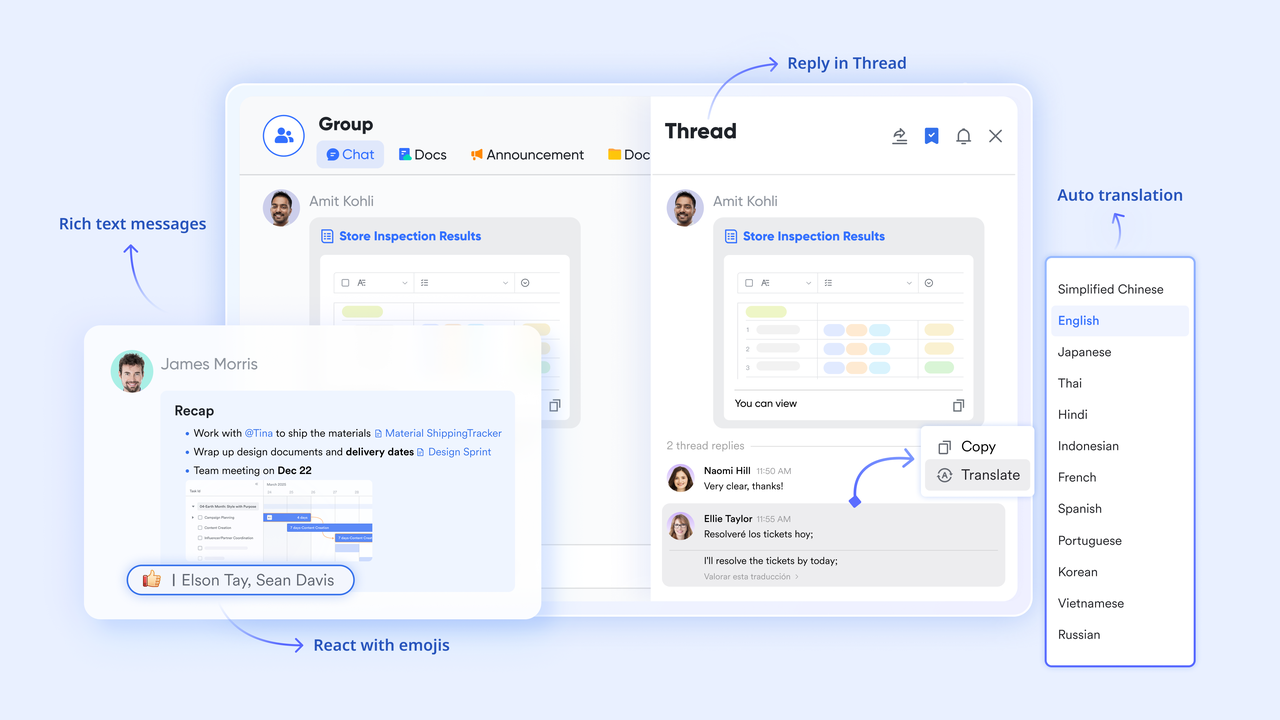
Lark Messenger brings discussions right next to the data. You can share a base card or sheet chart in a chat thread, where replies and updates remain visible beside the metric. When automation detects issues (like "Throughput down 20%"), it can automatically post an alert in the relevant channel.
If you've learned how to create a dashboard in Jira with filters, Messenger helps you act instantly on those insights without leaving the workspace. This turns dashboards from passive reports into live collaboration hubs.
- Starter plan: Free forever plan that includes 11 powerful tools for up to 20 users. It also comes with 100GB of storage, 1000 automation runs, AI translations, and more.
- Pro plan: $12/user/month (billed annually) for up to 500 users. It includes everything in Starter plus group calling for up to 500 attendees, 15TB of storage, 50,000 automation runs, and more.
- Enterprise plan: Contact sales for custom pricing. Supports unlimited users and includes even more automation runs and advanced security, compliance, and management features.
Bonus: Free Lark dashboard templates for project tracking
These templates give teams an immediate starting point for structured dashboards without building layouts from scratch. Each one opens inside the workspace so teams can co-edit, assign owners, and connect tasks directly to data. They work for agile squads, IT teams, project managers, and cross-functional workflows that need clear visibility. Instead of exporting Jira data into slides or spreadsheets, these templates help teams move from tracking to action in one place. They are fully customizable and ready to use for real projects.
Project tracker template
This template helps teams monitor tasks, owners, deadlines, and progress in one shared view. It works for any workflow, from product launches to internal ops. The table layout makes it easy to sort by status, assignee, or priority, so everyone sees what is on track or overdue. Teams can use it for weekly reviews, handoffs, or async updates without sending manual summaries. It is the fastest way to move from scattered files to a structured, real-time task tracker.
Project management template
This template offers a complete project hub with phases, dependencies, owners, timelines, and status tags. It gives managers a single place to plan, monitor, and report without switching between spreadsheets and chat threads. Multiple views, including Kanban and timeline, allow both high-level planning and daily execution tracking. It helps cross-functional teams align without repeated check-in meetings. Best for projects that move through defined stages and involve shared accountability.
Employee task allocation and tracking
This template makes workload planning more predictable by showing which team member is assigned what and how much capacity remains. It prevents overbooking and helps managers balance priorities across roles or squads. Employees can update progress directly on the record instead of sending status emails or private chat messages. It brings clarity to team-level planning when multiple deadlines overlap. Useful for HR, operations, product, and engineering teams.
Project problem tracker
This template centralizes issues, risks, and blockers that appear during project execution. It lets teams log each problem, assign owners, set urgency, and track resolution progress with full visibility. Instead of losing context across conversations, every item keeps history and comments in one place. It is ideal for engineering, product, support, or any team that needs structured follow-up instead of ad-hoc bug lists. It improves accountability and helps prevent repeated escalations.
IT project status report
This template organizes technical project updates across releases, timelines, dependencies, environments, and incidents. It is built for weekly or monthly reporting where leaders need clarity without digging through multiple tools. The template supports fields like progress percentage, risks, milestones, and next steps, so status reviews stay consistent. It helps IT teams run predictable check-ins and reduces manual slide building. Works well for infrastructure, DevOps, security, and software rollout reporting.
Milestone tracker for software projects
This template helps teams monitor product or feature milestones from planning to release. It maps deadlines, owners, risk level, and completion state in one structured view so leadership can see progress instantly. The timeline or Kanban view makes it easy to spot tasks slipping behind schedule. It is designed for long-term software projects where milestones span multiple sprints or contributors. It is especially useful for roadmap planning and launch coordination.
Web3 project watchlist
This template lets teams track blockchain, NFT, or token-based projects across metrics like roadmap stage, token performance, funding, and ecosystem relevance. It keeps research, alerts, and project notes in one shared hub instead of private spreadsheets. The table view supports grouping by chain type, market category, or status. It is helpful for investment teams, founders, analysts, and advisory groups who monitor multiple Web3 initiatives in parallel.
Comparison table: Jira vs. Lark dashboard experience
Jira dashboards focus on visualizing project and issue data, which works well for tracking progress inside the platform. However, teams often need additional tools to discuss findings, assign work, or automate follow-ups after reviewing the metrics. Lark approaches dashboards as part of a larger collaboration workflow, where data, communication, and actions stay connected in one place. The table below highlights how both tools differ in visibility, automation, and teamwork.
Conclusion
Jira dashboards give teams a clear view of project status, sprint progress, and issue trends, making them a valuable part of day-to-day tracking. But once those insights appear on screen, most teams still rely on separate tools for discussion, follow-ups, and decision-making. That is where the workflow typically breaks dashboards to show what is happening, but they do not help teams act on the data in one place.
This is where Lark begins to make a difference. Instead of exporting widgets into slides, screenshots, or long email threads, teams can keep dashboards, conversations, documents, and task ownership inside a single workspace. Metrics stay live, comments stay attached to data, and follow-ups are created instantly instead of being tracked manually. With Base for structured records, Sheets for analytics, Docs for shared context, and Messenger for real-time alignment, insights move directly into action. That turns dashboards from static reports into a continuous, collaborative loop.
FAQs
How many dashboards can I create in Jira?
Jira allows users to create multiple dashboards, and each one can focus on a specific project, team, or reporting need. The number you can create may depend on admin settings or plan limits. Many teams build separate dashboards for sprints, QA, support, or management views. If more flexibility is needed across departments, teams often pair Jira dashboards with a shared workspace where additional tracking and context can live.
Can I share a Jira dashboard outside my organization?
Jira dashboards are usually restricted to internal users unless permissions are changed. Public sharing is possible, but it may expose data more widely than intended. For external clients, vendors, or cross-company partners, teams often export dashboard insights into a shared document or workspace to control access more safely. This keeps reporting visible without giving full access to the Jira environment.
What's the best way to export Jira data for Lark dashboards?
Most teams export dashboard data using CSV, or they rely on saved filters to pull specific issue sets. API connections can automate this if the data needs to refresh in another system. Once exported, the data is often moved into tools like spreadsheets, shared databases, or collaborative dashboards to support ongoing analysis. This helps teams keep Jira as the system of record while reviewing trends elsewhere.
Does Lark support automation for project updates?
Yes, but it works differently from Jira. In Lark Base, automation rules can trigger when a condition is met, such as a rising bug count or a stalled task. Rules can assign owners, post alerts, or update fields automatically instead of waiting for manual follow-ups. This helps teams respond faster when dashboard data reveals something that needs attention.
How can I embed a Jira dashboard inside Lark Docs?
Jira does not embed full dashboards directly inside documents, so most teams use screenshots or exported charts instead. Another option is to export the filtered data into a spreadsheet or shared table, then embed the updated chart where discussion is happening. This keeps the visual data and the written context together rather than jumping between tools.
Related reading
Table of contents
Start using Lark today

Manage all your work in one place
Boost team efficiency by 10x
Save up to 70% on software costs
Table of contents
Start using Lark today
Manage all your work in one place
Boost team efficiency by 10x
Save up to 70% on software costs
Keep reading







2026 Lark Technologies Pte. Ltd.
Headquartered in Singapore with offices worldwide.






Explore: