














Top 8 Best Reporting Tools: A Comprehensive Guide for Data-Driven Decisions

Cecilia Lane
Go-to-Market Associate
Sep 18, 2026
Cecilia Lane
Sep 18, 2026

16 min read


Data is the engine of business growth, yet in its raw form, it's simply noise. The real challenge lies in translating vast amounts of information into a clear, compelling story that can guide your strategy forward. This is where reporting tools become indispensable, acting as the bridge between complex datasets and confident, data-driven decisions. They are designed to cut through the complexity, automate the mundane, and present insights in a way that everyone on your team can understand and act upon.
The most advanced platforms today are no longer isolated applications; they are part of a collaborative ecosystem where insights are shared and discussed in real-time. This guide will walk you through everything you need to know, from the fundamental features to a detailed look at the best reporting tools on the market. Next, I will highly recommend the following products:
- Lark: The all-in-one hub for collaborative reporting
- Google Analytics 4: The essential web reporting tool
- OWOX BI: The specialized marketing ROI reporting tool
- Funnel: The master tool for data preparation
- Coupler.io: The spreadsheet reporting automator
- Datapine: The intuitive business intelligence reporting tool
- Power BI: The powerhouse for enterprise reporting
- HubSpot: The unified solution for CRM reporting
What are reporting tools?
At their core, reporting tools are software applications designed to connect with various data sources, process that information, and present it in a digestible, visual format. Think of them as powerful translators that convert the complex language of numbers, queries, and tables into clear charts, graphs, and dashboards.
Their primary goal is to help businesses monitor performance, track key performance indicators (KPIs), identify trends, and share insights across the organization. While spreadsheets were the original reporting tool, modern solutions have evolved into dynamic, interactive platforms. The best reporting tools today do more than just display data; they integrate it directly into your team's workflow, allowing for discussions and decisions to happen right where the insights are discovered, creating a seamless flow from analysis to action.
Key features to look for in a reporting tool
Data connectivity
This is the foundation of any effective reporting tool. Its ability to connect to a wide range of data sources—from internal databases and spreadsheets to cloud services, is crucial. A tool with robust data connectivity ensures you can create a holistic view of your business performance without being limited by data silos. Look for a platform with a wide array of pre-built connectors and the flexibility to connect to custom sources via APIs.
Customizable dashboards and visualizations
Data is most impactful when it’s visualized effectively. A great reporting tool offers a variety of visualization options, including charts, graphs, maps, and tables, that you can customize to fit your specific needs. The ability to create interactive dashboards allows users to drill down into the data, filter information, and explore insights on their own. This transforms static reports into dynamic analytical tools that empower your team to ask and answer their own questions.
Collaboration and sharing
Reporting is not a solo activity; it's about sharing insights to drive collective action. Modern reporting tools have moved far beyond simply emailing a PDF file. Look for features that allow users to share live dashboards, leave comments directly on visualizations, and even @-mention colleagues to draw their attention to a specific insight. The most integrated platforms allow you to embed live reports directly into shared team documents or wikis, ensuring everyone is working from the same up-to-date information.
Manually creating and distributing reports is time-consuming and prone to error. A key feature of any top-tier reporting tool is the ability to automate these processes. You should be able to schedule reports to run at specific intervals—daily, weekly, or monthly—and have them automatically sent to relevant stakeholders. This not only saves a significant amount of time but also ensures that everyone receives consistent and timely updates on key metrics.
Security
Data is one of your most valuable assets, and protecting it is non-negotiable. A secure reporting tool provides robust features to manage data access and protect sensitive information. This includes role-based access controls that allow you to define who can view, edit, and create reports, as well as data encryption and compliance with international standards like GDPR. Ensure the tool you choose provides the peace of mind that your business intelligence is secure.

The best reporting tools at a glance
A deep dive into the top reporting tools
1. Lark: The all-in-one hub for collaborative reporting
Overview
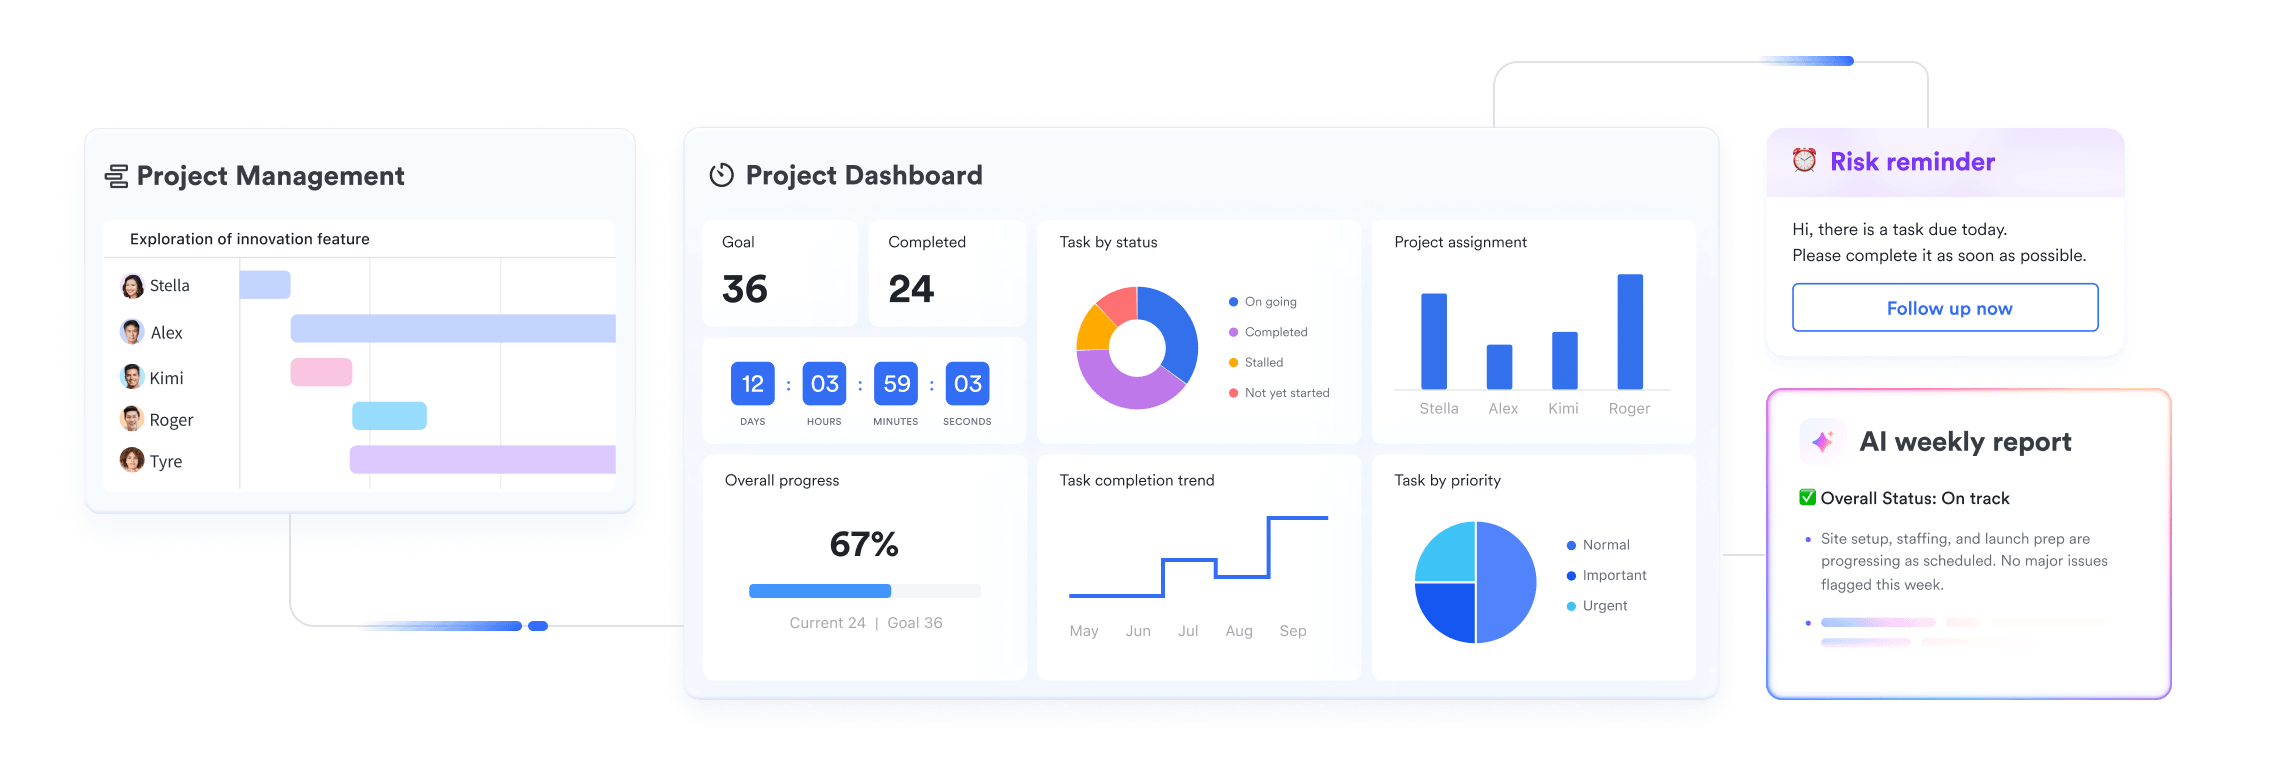
Lark is a comprehensive platform that redefines the concept of a reporting tool by weaving data analysis directly into the fabric of daily work. Instead of isolating reporting in a separate application, Lark allows teams to build, share, and act on data within the same space they use for documents, project management, and communication. This approach transforms static reports into living, collaborative workspaces where insights fuel immediate action.
Key features
Lark's strength as a reporting tool comes from the synergy between its powerful modules, especially Lark Base. This allows teams to construct sophisticated, custom reporting solutions that are connected to their actual work.
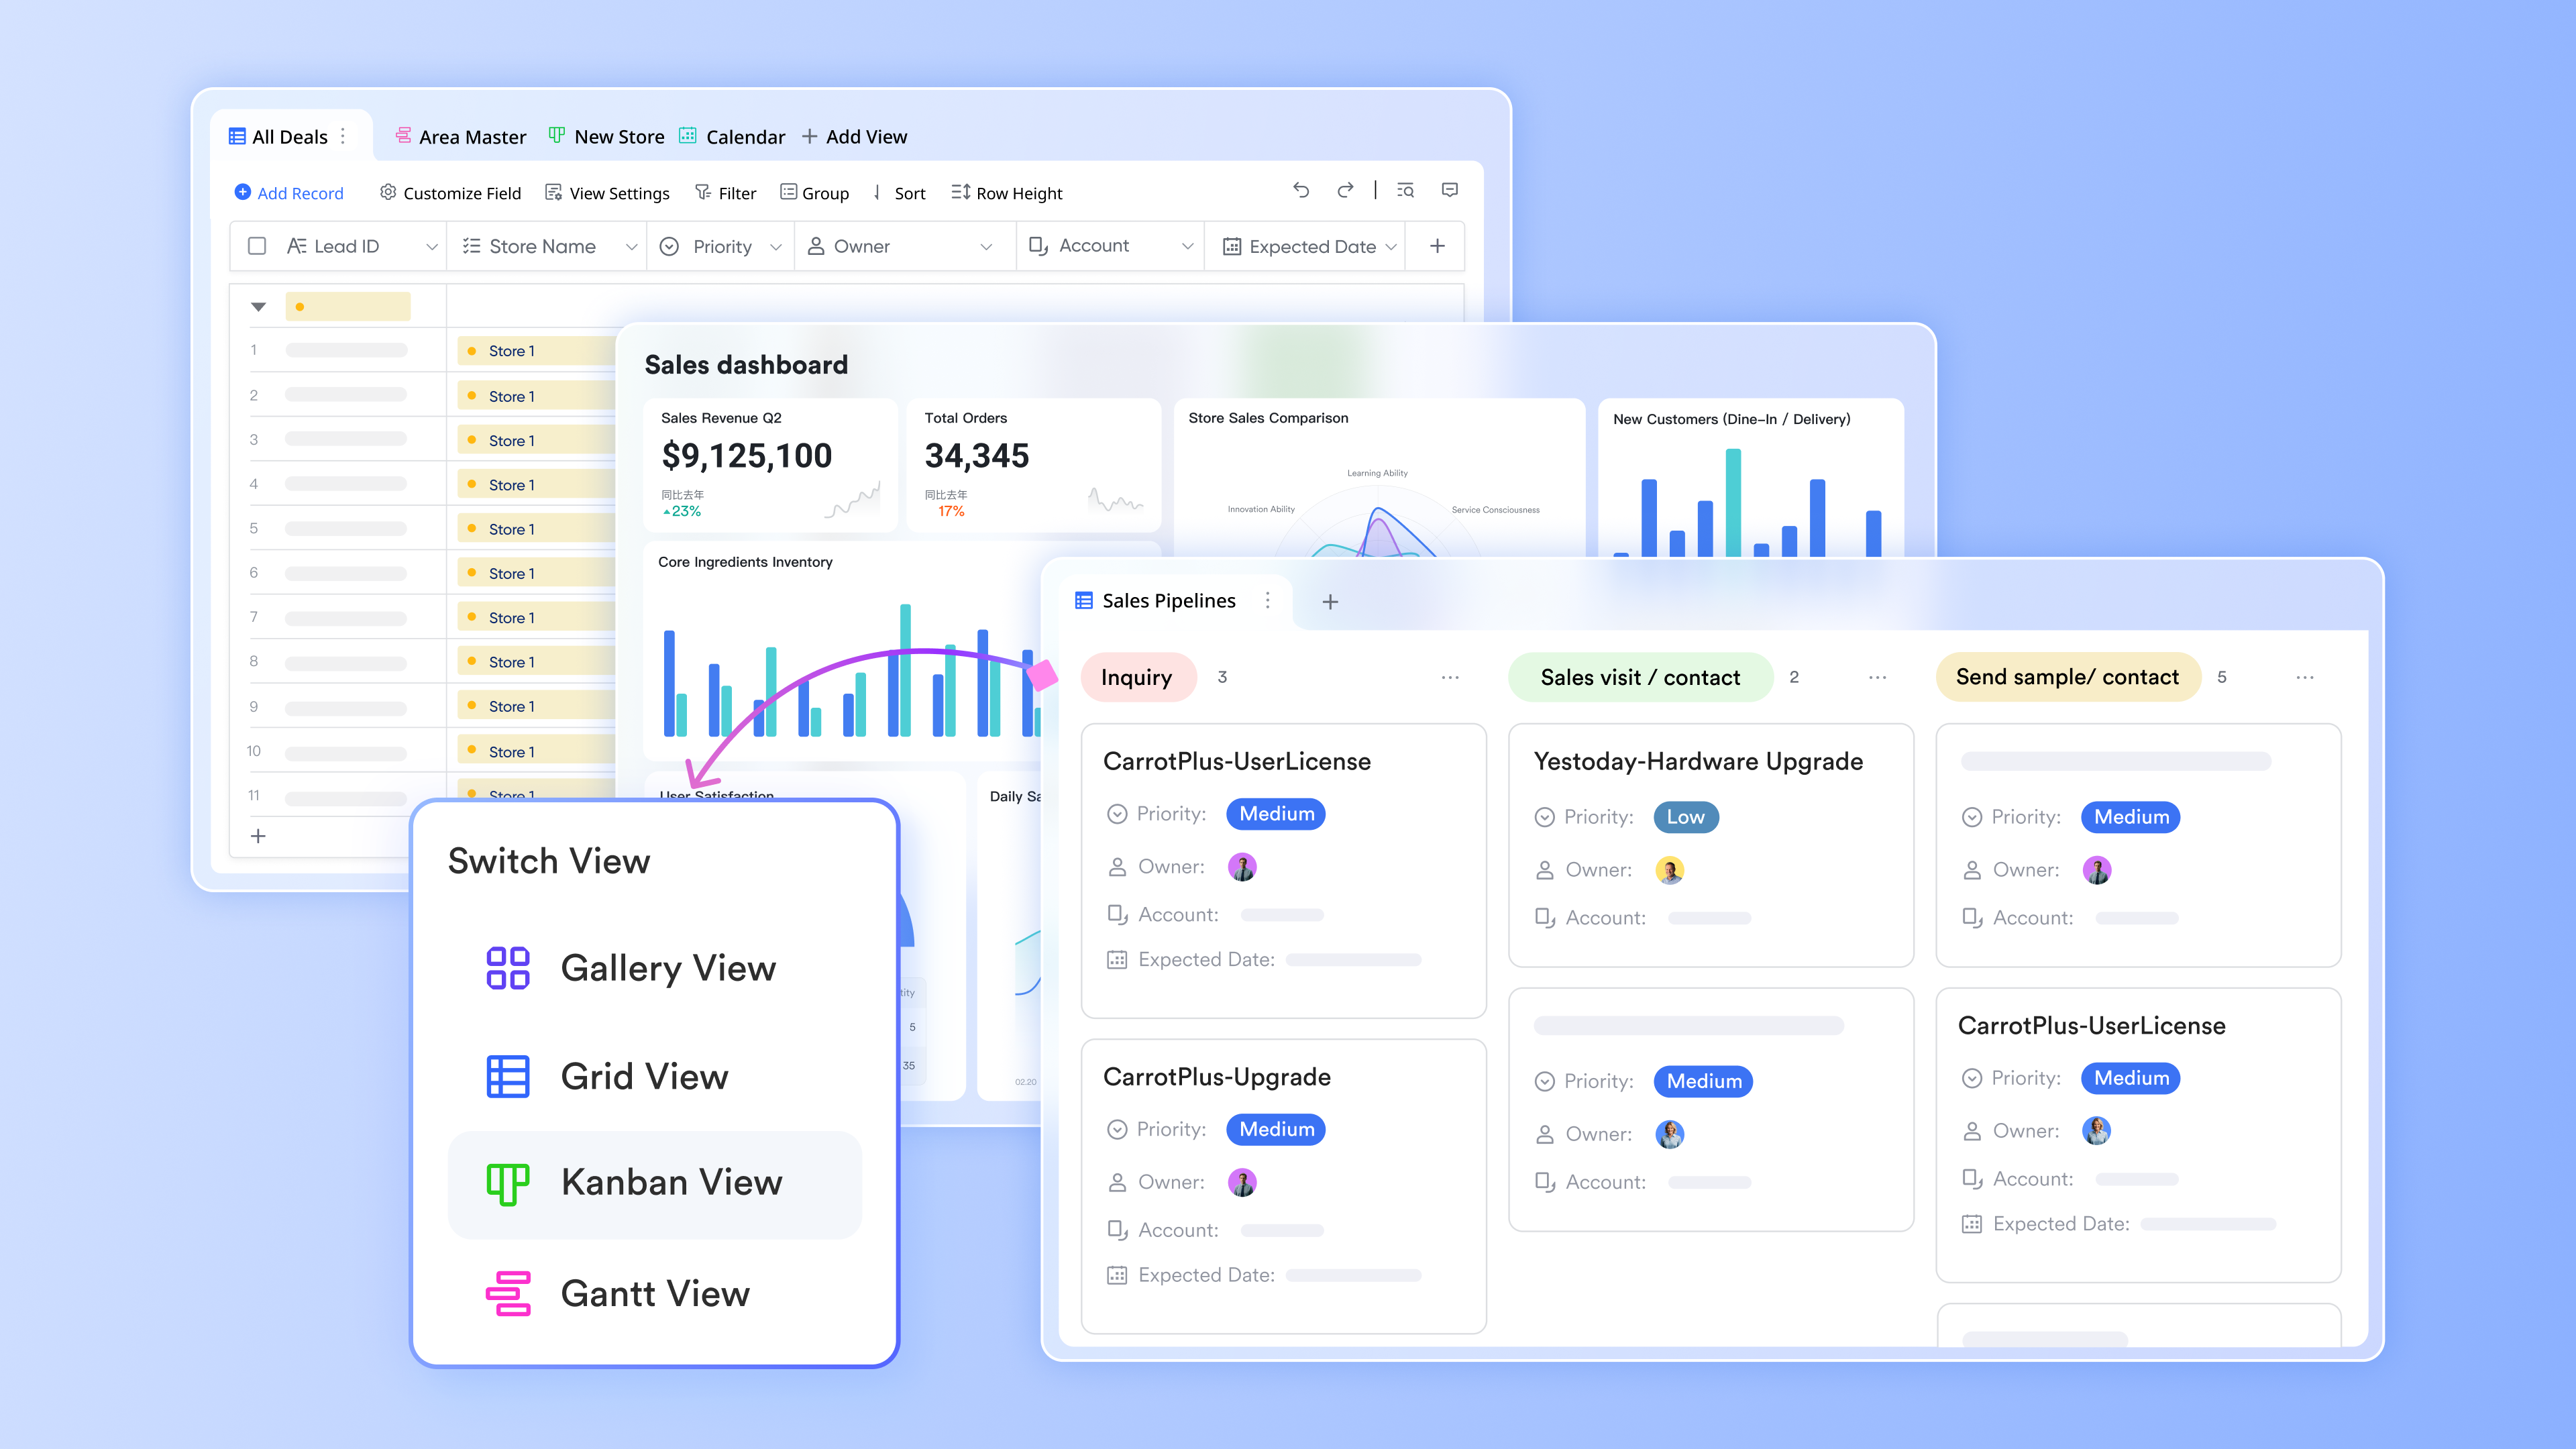
- Customizable views: From a single dataset, you can generate multiple report views tailored to different audiences. For an event planning team, a manager can use a Gantt chart view for a high-level timeline report, while the marketing team uses a Calendar view to track promotional deadlines, and the logistics team uses a Grid view to monitor vendor status—all without altering the source data.
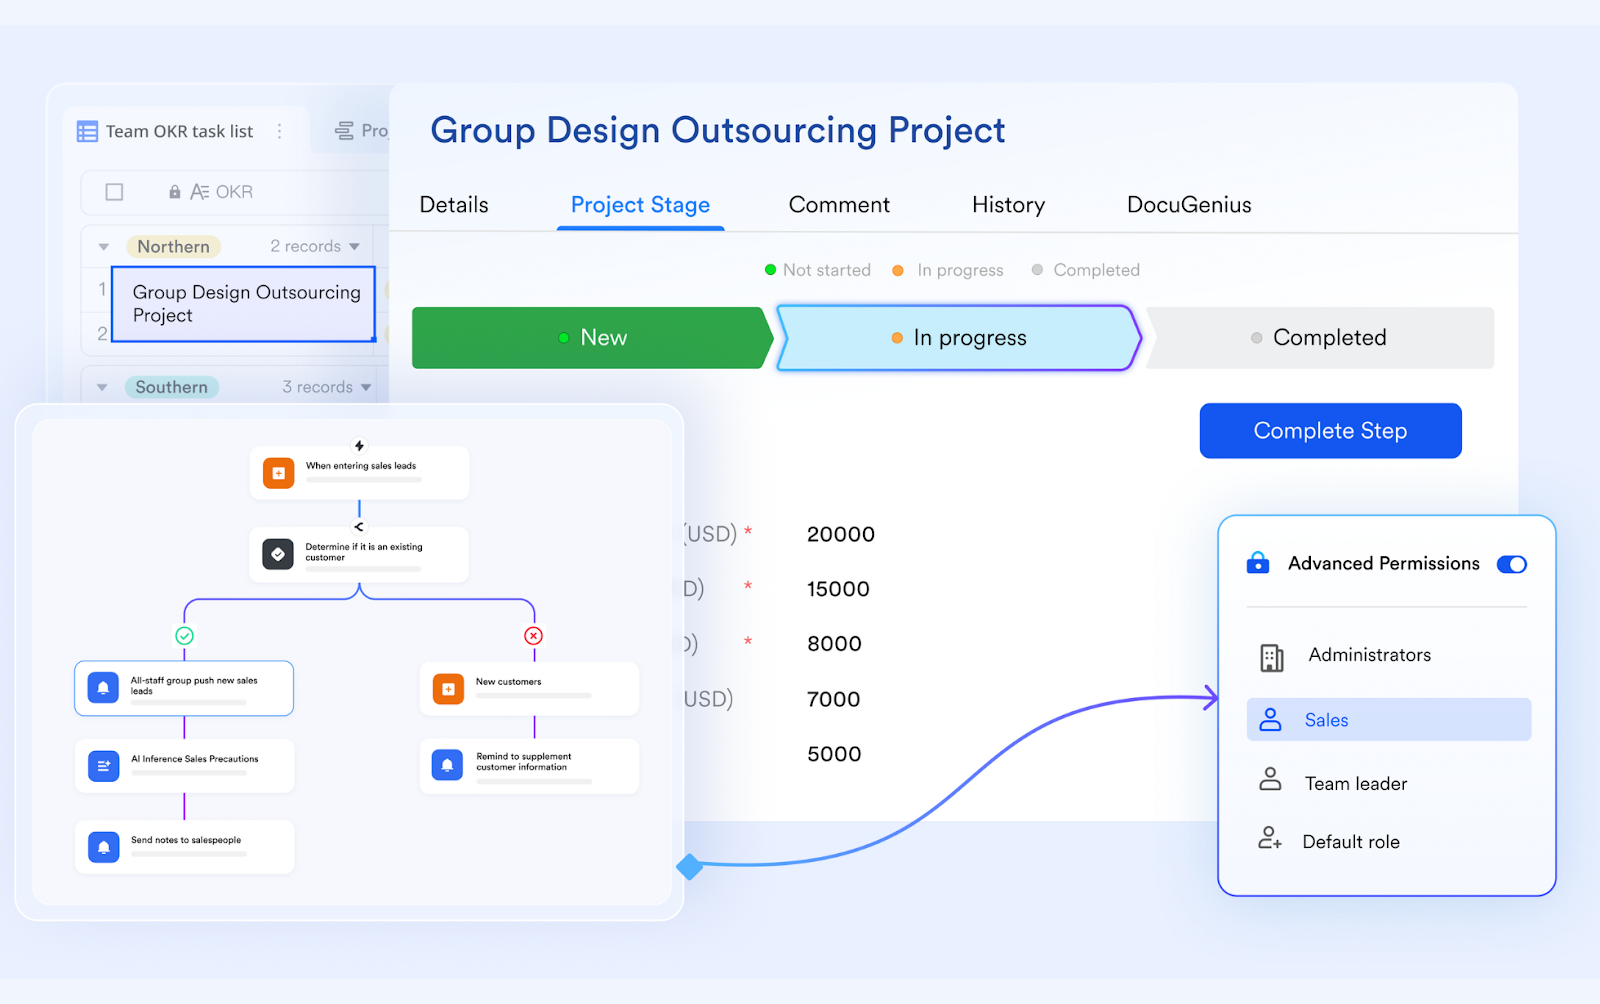
- Workflow automation: Convert your reports from passive documents into active project management tools. You can configure automations where a data change triggers a specific action. For instance, when an event planner updates a task in a report to "Blocked," it can automatically notify the project lead and create an urgent task in their to-do list, ensuring no delays.
- Connected task management: Seamlessly bridge the gap between insight and action. If a budget report reveals an overspend, you can create a task directly from that data point, assign it to a team member, set a deadline, and link it back to the report. This creates a transparent, auditable trail from data discovery to resolution.
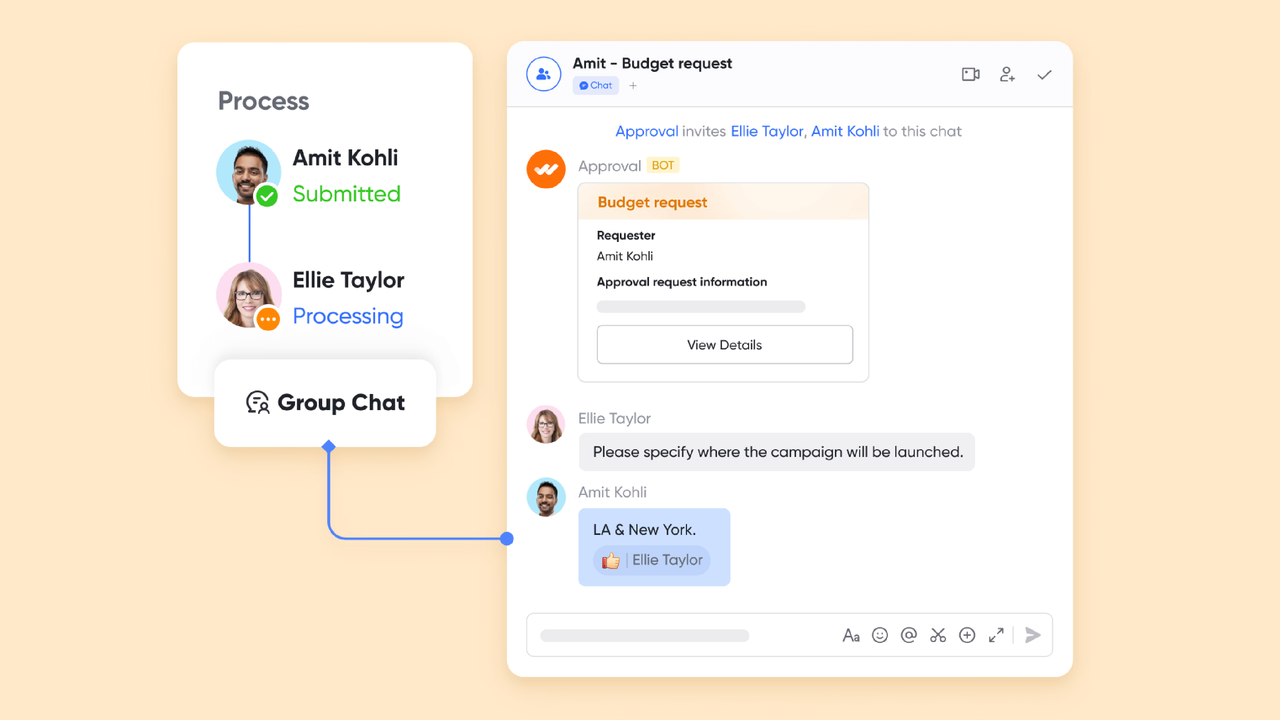
- Built-in approval workflows: Formalize and accelerate processes that require sign-offs. An event budget report built in Base can be submitted through a custom approval flow. Stakeholders are automatically notified and can review, comment on, and approve or reject the report directly, creating an official record and moving projects forward faster.
- Embedded calendar and meetings: Discuss report findings without context switching. You can schedule a team meeting directly from a Lark Base report to review progress. The meeting invite in Lark Calendar automatically includes a link to the report, and during the Lark Meetings, the team can co-edit the report in real time as they make decisions.
- Starter plan: Free forever plan that includes 11 powerful tools for up to 20 users. It also comes with 100GB of storage, 1000 automation runs, AI translations, and more.
- Pro plan: $12/user/month (billed annually) for up to 500 users. It includes everything in Starter plus group calling for up to 500 attendees, 15TB of storage, 50,000 automation runs, and more.
- Enterprise plan: Contact sales for custom pricing. Supports unlimited users and includes even more automation runs and advanced security, compliance, and management features.
Reviews
Users consistently praise the platform's all-in-one design, which eliminates the friction of switching between multiple apps. The flexibility of Lark Base is frequently cited as a standout feature for creating custom internal reporting tools and workflows.
Best for
Teams like event planners, project managers, and operations units who need to build dynamic, actionable reporting tools that are deeply connected with their daily communication, task management, and approval processes.
2. Google Analytics 4: The essential web reporting tool
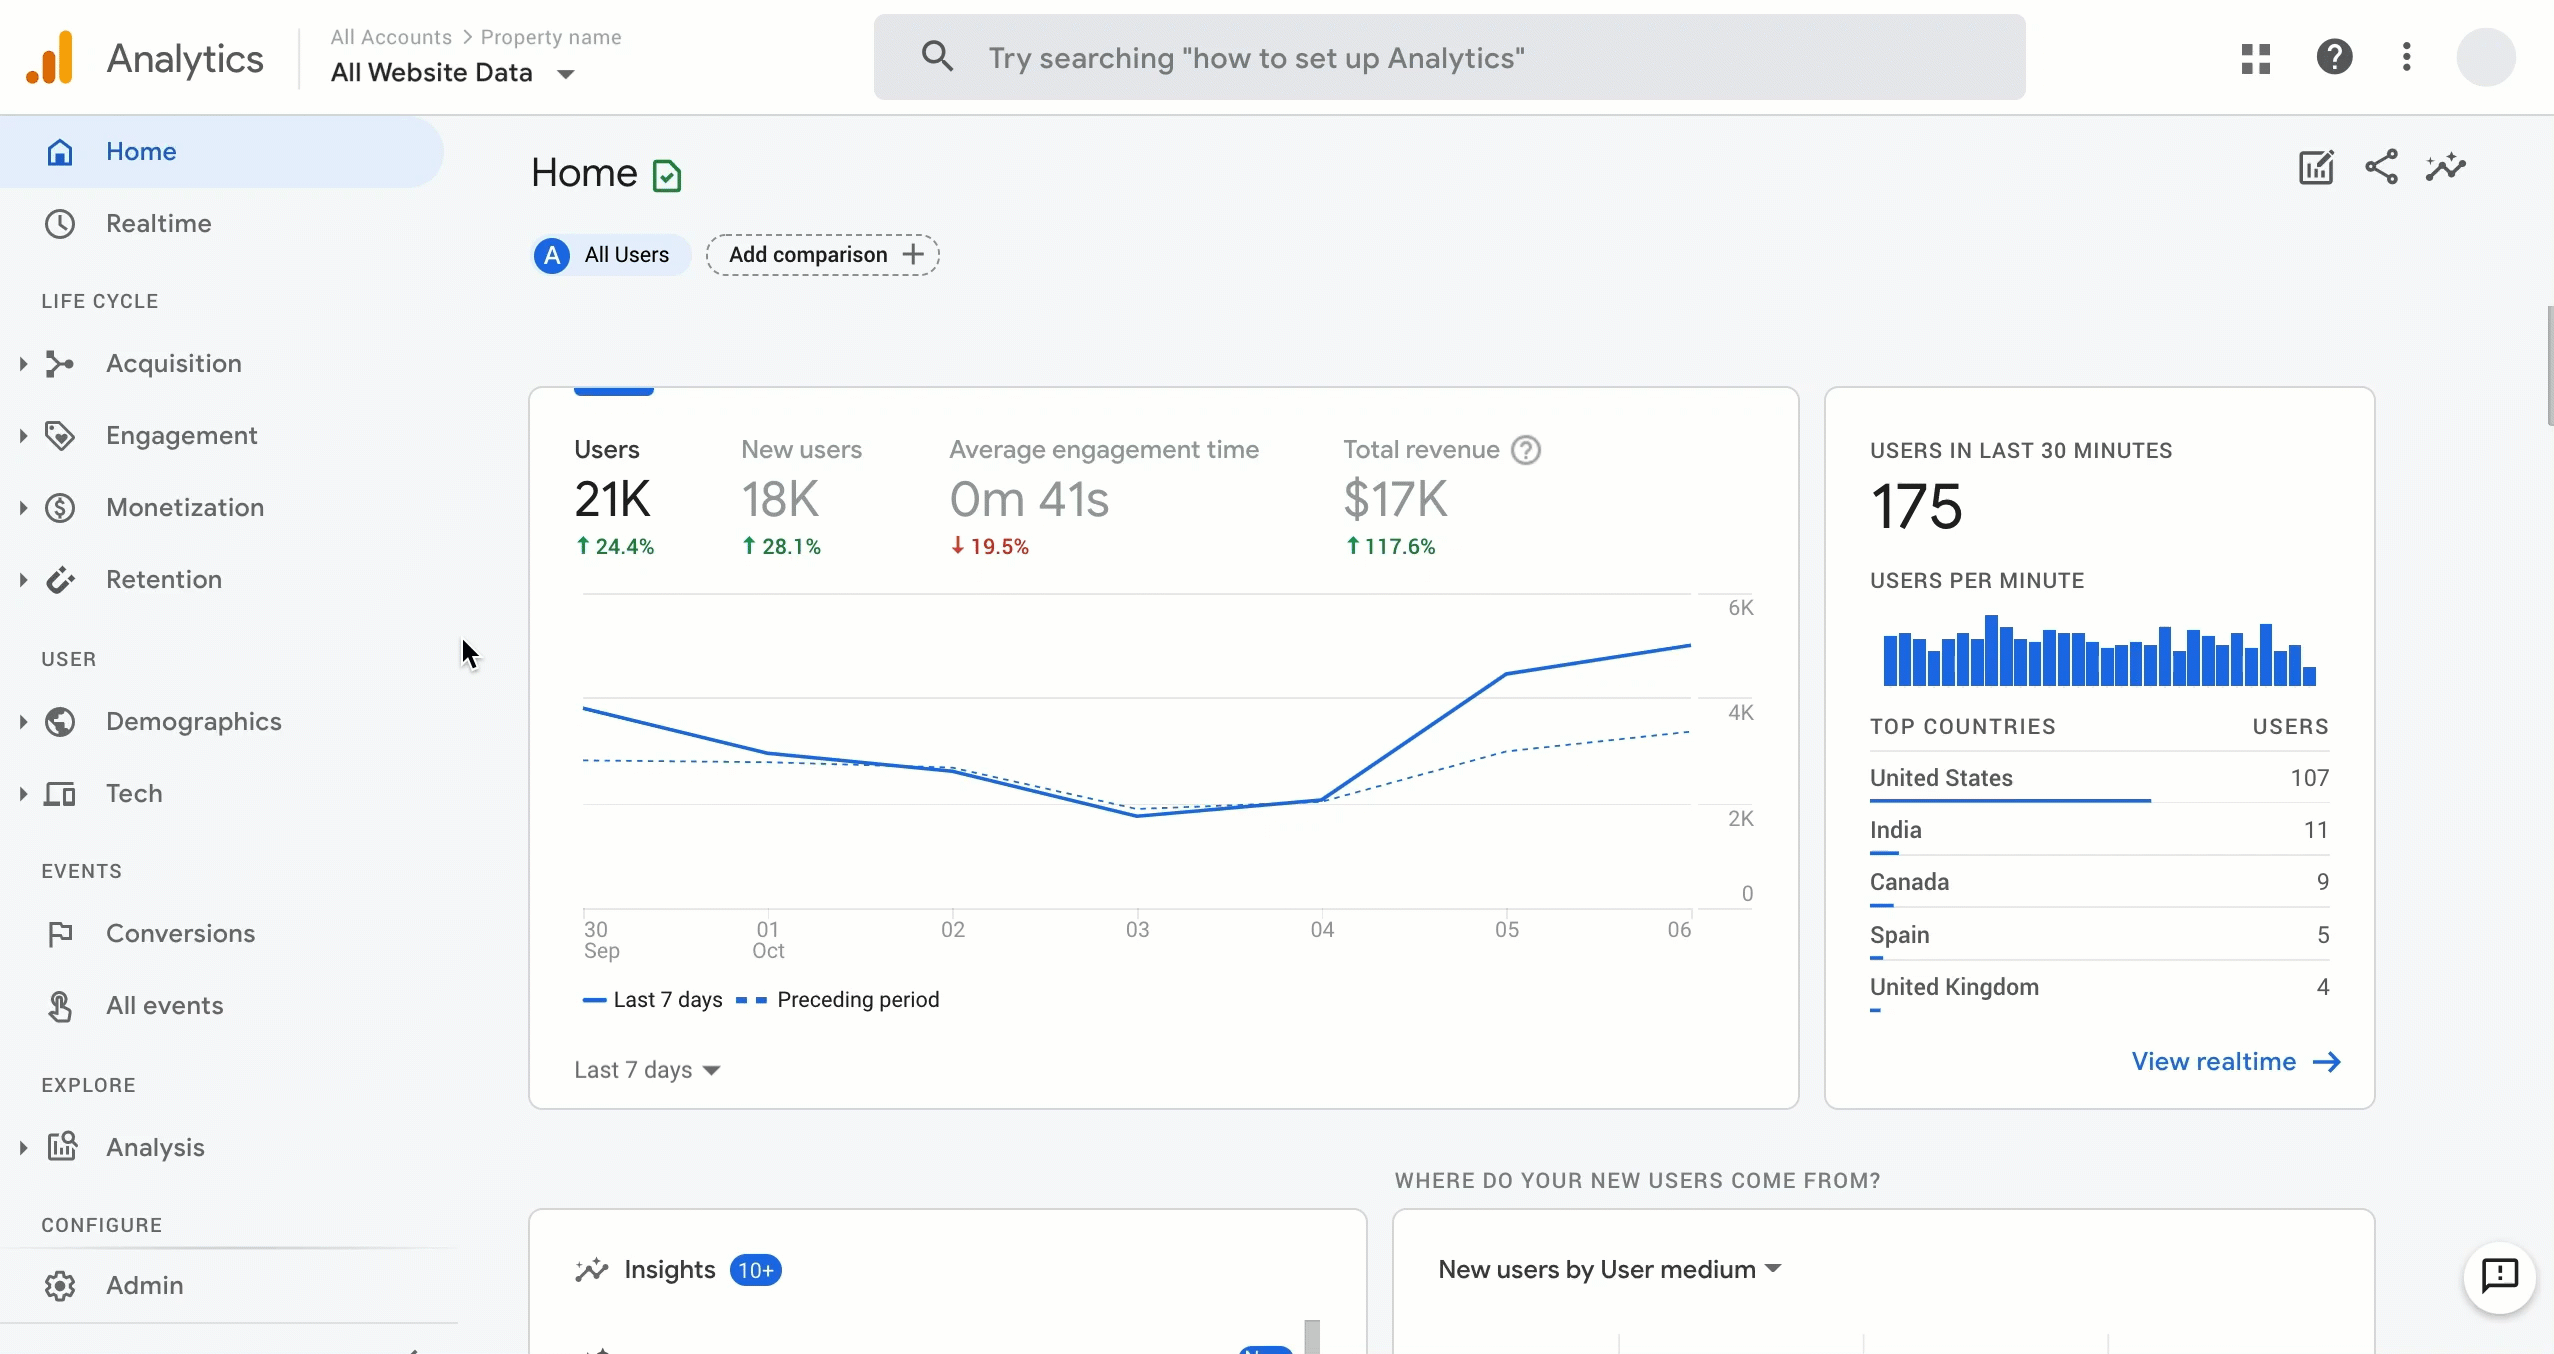
Image source: google.com
Overview
Google Analytics 4 (GA4) is the premier web analytics service for tracking and reporting website and app traffic. It’s the industry-standard reporting tool for any business that needs to understand its online audience, user behavior, and the effectiveness of its digital marketing efforts.
Key features
GA4’s reporting power is built on an event-based tracking model, which offers a more flexible view of user interactions than older, session-based models. Its "Explorations" hub is a sophisticated analysis module that lets users build custom reports like funnels and path analyses. It also leverages Google's AI to provide predictive metrics, such as churn probability.
Limitations
The transition to GA4 has introduced a steep learning curve, and the interface can be less intuitive for casual users. Its data connectivity is primarily focused on the Google ecosystem (Google Ads, BigQuery), making it more challenging to blend with external data sources without a third-party tool.
Pricing
The standard version of Google Analytics is free and sufficient for most businesses. A high-end paid version, Analytics 360, is available for large enterprises with massive data volumes.
Reviews
Praised by data analysts for its powerful, flexible reporting capabilities that allow for deep-dive analysis. However, it's often criticized by small business owners and marketing generalists for its complexity compared to its predecessor.
Best for
Data-driven marketers, web analysts, and product managers who need to generate deep, granular reports on user acquisition, engagement, and conversion across digital platforms.
3. OWOX BI: The specialized marketing ROI reporting tool
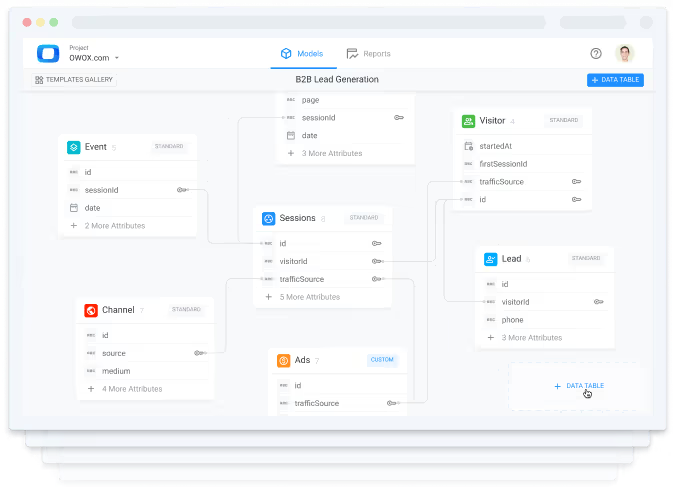
Image source: owox.com
Overview
OWOX BI is a purpose-built marketing analytics platform. Its core function is to help businesses generate accurate ROI reports by consolidating advertising spend data from dozens of platforms and blending it with on-site user behavior data.
Key features
Its standout feature is the automated collection of cost data from non-Google ad platforms (like Facebook, LinkedIn, TikTok), which it then combines with session data from Google Analytics. This allows for the creation of comprehensive performance reports and the development of data-driven attribution models that accurately reflect the entire marketing mix.
Limitations
Its focus is highly specialized on marketing analytics and may be overly complex or unnecessary for businesses with simple advertising strategies. It serves a specific, though critical, reporting need.
Pricing
OWOX BI is a subscription-based service. Pricing is typically dependent on the volume of data processed and the number of connected data sources.
Reviews
Highly regarded within the marketing analytics community for its robust and reliable solution to the complex challenge of multi-channel ad spend reporting. Users praise its ability to create a single source of truth for marketing performance.
Best for
E-commerce businesses and data-centric marketing agencies that need to generate precise, consolidated reports on multi-channel advertising performance and true ROI.
4. Funnel: The master tool for data preparation
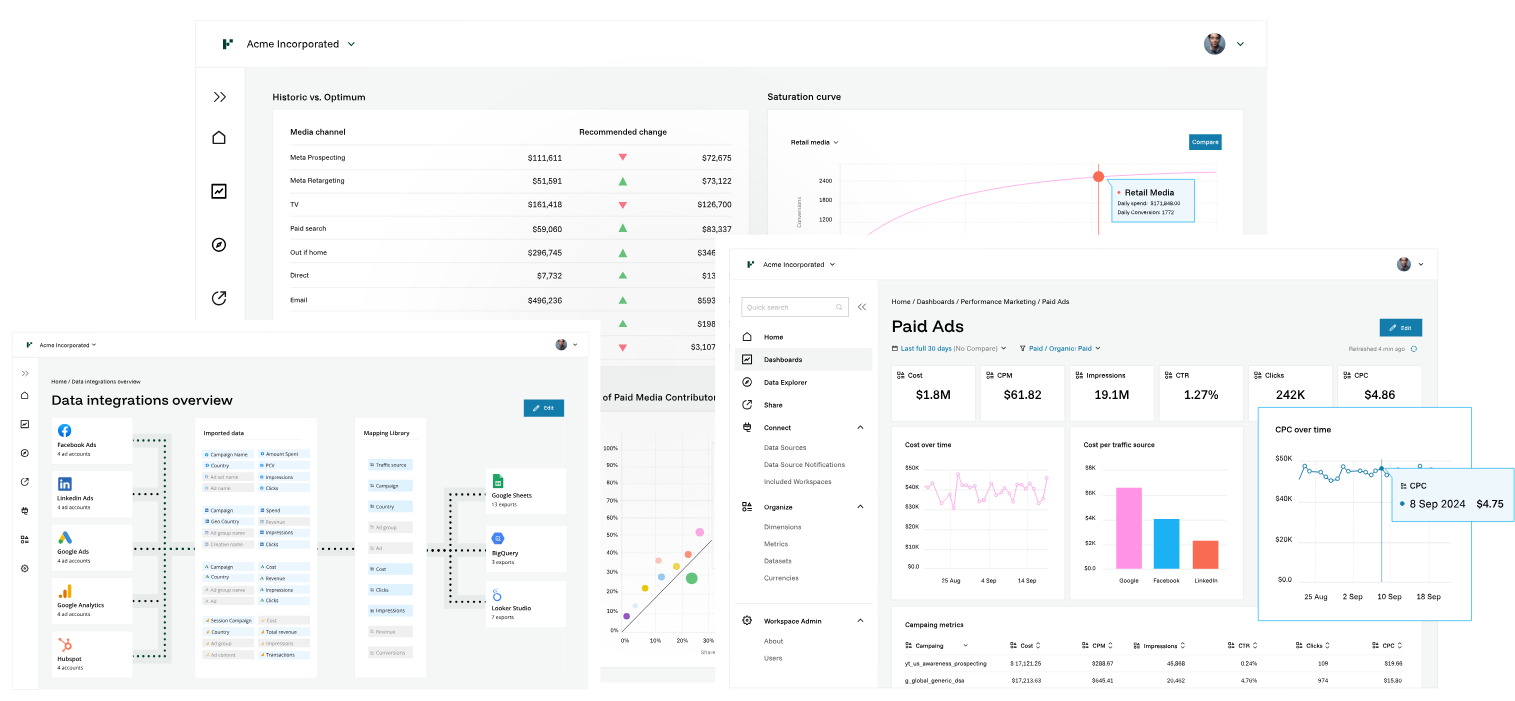
Image source: funnel.io
Overview
Funnel is a data collection and transformation tool that automates the tedious process of gathering marketing data and preparing it for reporting. It sits upstream from visualization tools, ensuring the data they receive is clean, standardized, and ready for analysis.
Key features
Funnel's primary strength is its extensive library of over 500 pre-built marketing data connectors. Its powerful engine automatically cleans, maps, and harmonizes data from all these sources into a single, cohesive dataset, saving teams countless hours of manual work.
Limitations
It's important to note that Funnel is not a visualization tool itself. It is a critical intermediary platform that feeds clean data into other reporting tools like Power BI, Tableau, or Google Data Studio. Its value lies entirely in data preparation.
Pricing
Funnel is a subscription-based service, and its pricing is typically determined by the client's monthly advertising spend, which correlates with data volume.
Reviews
Universally loved by marketing operations teams and data analysts for its ability to save time and eliminate errors in the data collection process, leading to more reliable and trustworthy reporting.
Best for
Marketing teams and agencies that rely on a wide array of advertising and sales platforms and need to automate the aggregation and harmonization of their data before reporting.
5. Coupler.io: The spreadsheet reporting automator
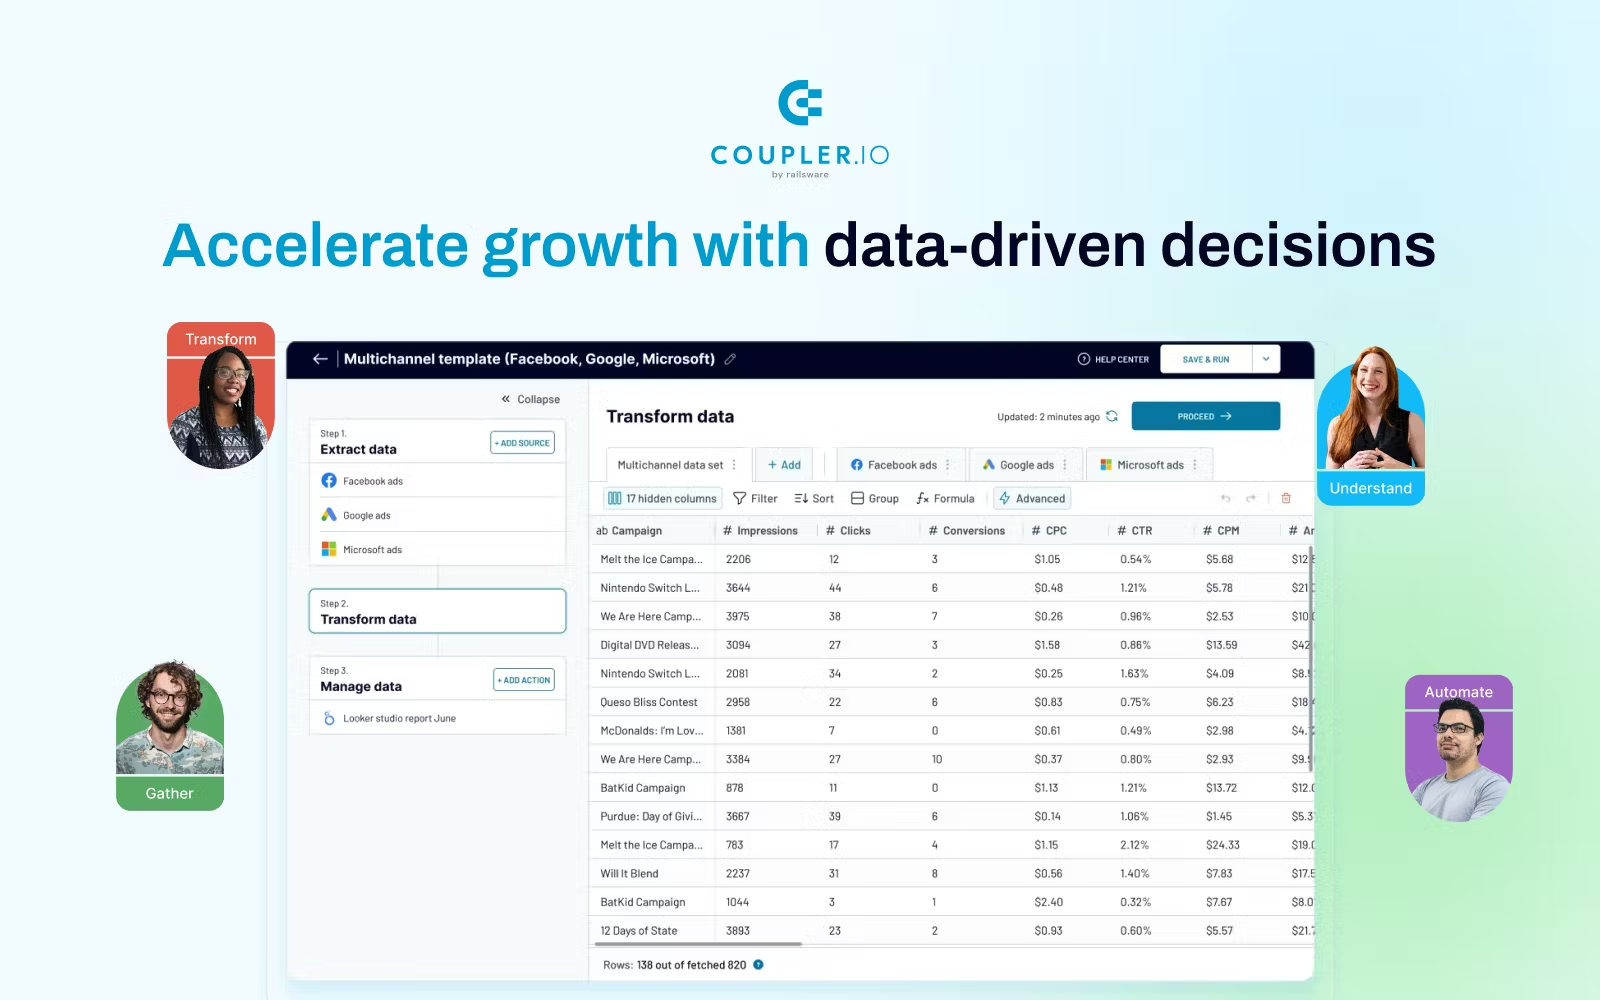
Image source: softwareadvice.ie
Overview
Coupler.io is a data integration tool designed for those who prefer to build their reports in the familiar environment of a spreadsheet. It automates the process of exporting data from various business apps directly into Google Sheets, Microsoft Excel, or BigQuery.
Key features
Its core feature is the ability to schedule automatic data refreshes (e.g., every hour or every day), which ensures that spreadsheet-based reports and dashboards are always up-to-date without any manual exporting and importing. It connects to over 70 common business applications.
Limitations
The tool is dependent on the native reporting and visualization capabilities of the destination spreadsheet. For highly complex or interactive dashboards, a dedicated BI tool would be more suitable.
Pricing
Coupler.io offers a Freemium plan for small-scale use, with paid Subscription tiers that scale based on the frequency of data refreshes and the volume of data transferred.
Reviews
Valued for its simplicity, reliability, and ease of use. It's a favorite among operations managers and business analysts who need to quickly create automated reports without a steep learning curve.
Best for
Business users and analysts who want to build simple, effective, and automated reports and dashboards within the familiar interface of Google Sheets or Excel.
6. Datapine: The intuitive business intelligence reporting tool
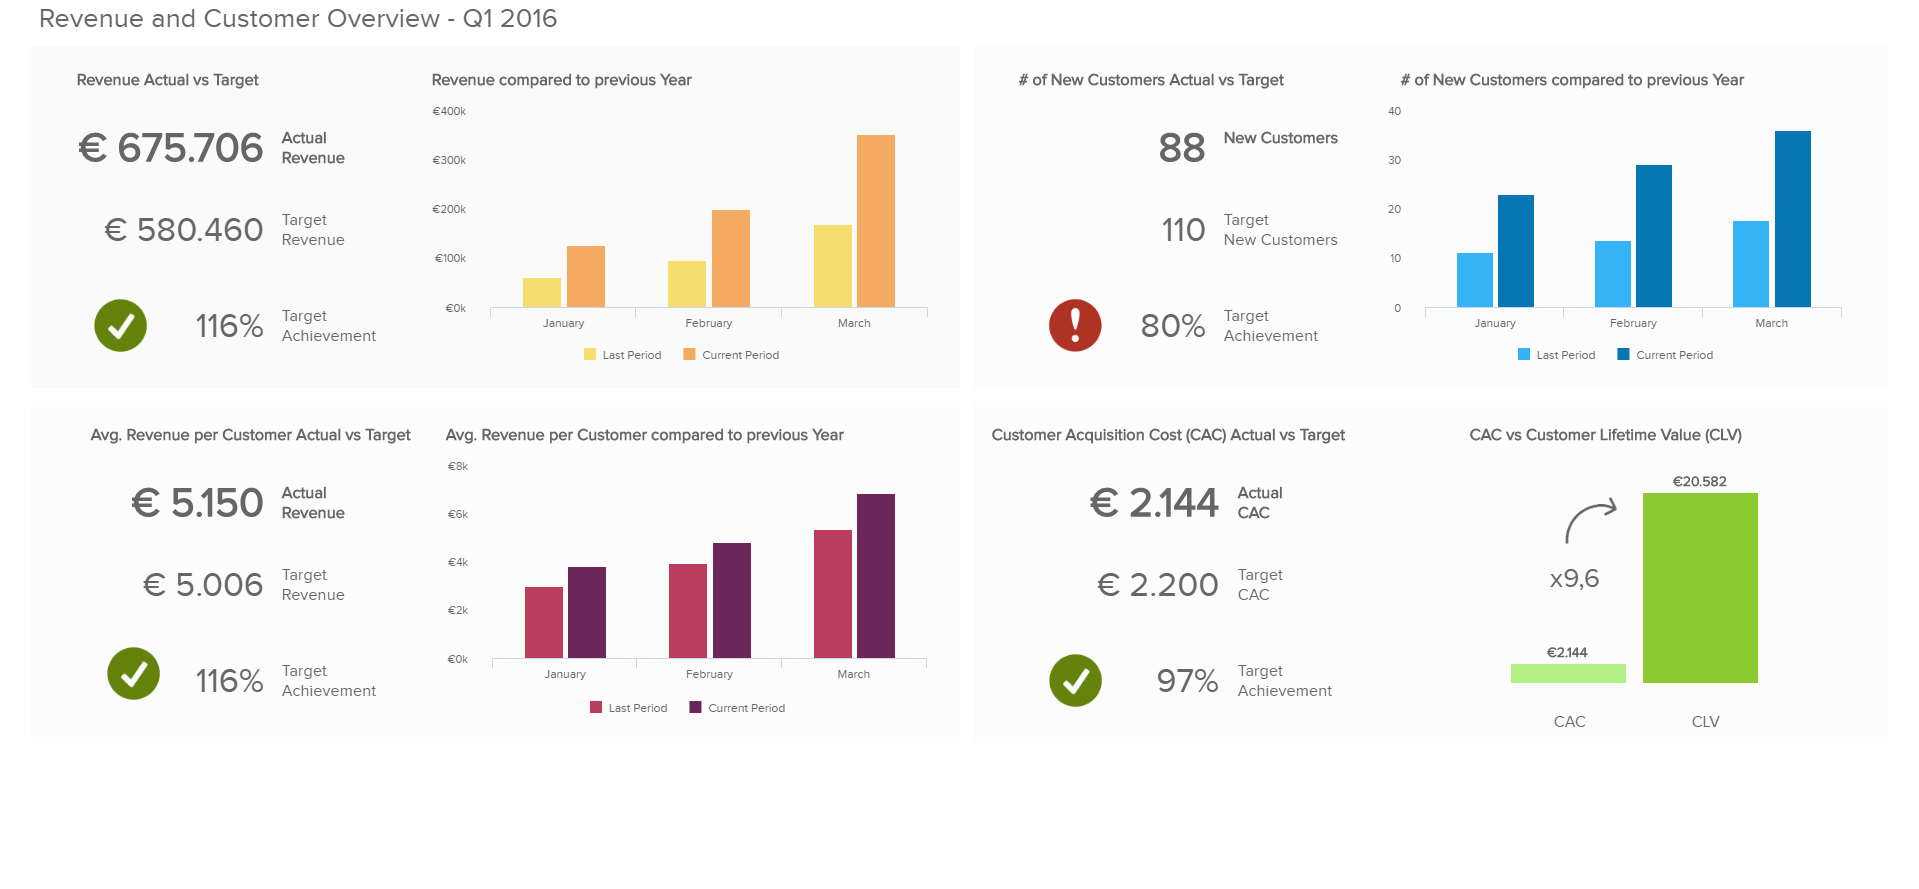
Image source: dbmstools.com
Overview
Datapine is a comprehensive, all-in-one business intelligence platform that empowers users with limited technical knowledge to create powerful data visualizations and professional, interactive business dashboards.
Key features
Its main strengths are an intuitive drag-and-drop report builder, a wide range of modern visualization options, and AI-powered features like "Insights" that automatically detect trends or anomalies in the data. This makes advanced data analysis accessible to a broader audience.
Limitations
As a self-service tool designed for ease of use, it may lack some of the extremely deep data modeling, governance, and customization capabilities required by very large enterprises with dedicated BI teams.
Pricing
Datapine is a subscription-based service with different pricing tiers designed for individuals, small teams, and entire enterprises.
Reviews
Frequently praised for its excellent user experience, top-tier customer support, and for successfully empowering business users (not just data analysts) to create their own insightful and professional reports.
Best for
Small to medium-sized businesses and individual departments that need a powerful yet user-friendly reporting tool for self-service business intelligence.
7. Power BI: The powerhouse for enterprise reporting
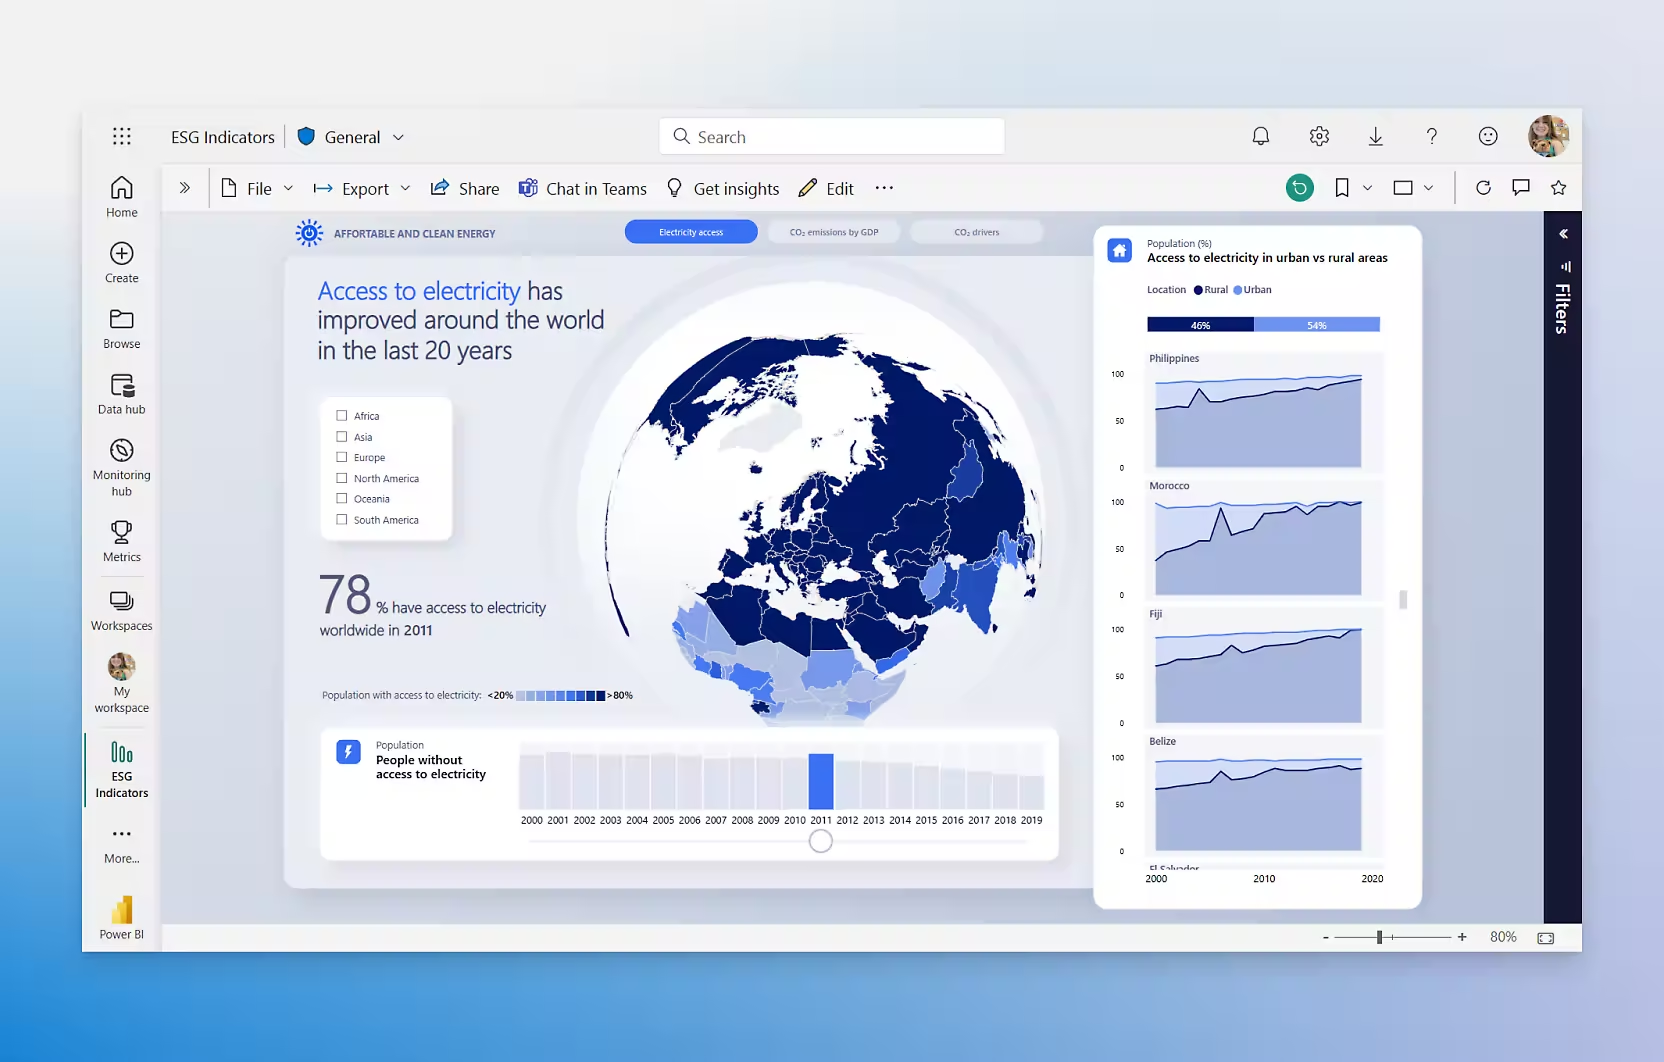
Image source: microsoft.com
Overview
Microsoft Power BI is a market-leading business analytics and reporting tool. It is designed for deep data analysis, complex data modeling, and creating highly interactive, enterprise-grade visualizations.
Key features
It stands out with its exceptional data modeling engine, which uses the DAX formula language for sophisticated calculations. Its seamless integration with the entire Microsoft ecosystem (Azure, Office 365, SQL Server) makes it a natural choice for organizations already invested in those technologies.
Limitations
The full-featured desktop application is only available for Windows. Its sheer power and the complexity of its data modeling layer can be overwhelming for beginners and casual users.
Pricing
Power BI offers a free desktop version for individual use. The "Pro" and "Premium" plans, which are required for sharing and collaboration, are offered as affordable per-user monthly subscriptions.
Reviews
Widely regarded as one of the most powerful and comprehensive BI reporting tools on the market. It is consistently ranked as a leader by industry analysts like Gartner for its completeness of vision and ability to execute.
Best for
Data analysts and large organizations that require a robust, scalable, and secure platform for developing and distributing enterprise-wide business intelligence reports.
8. HubSpot: The unified solution for CRM reporting
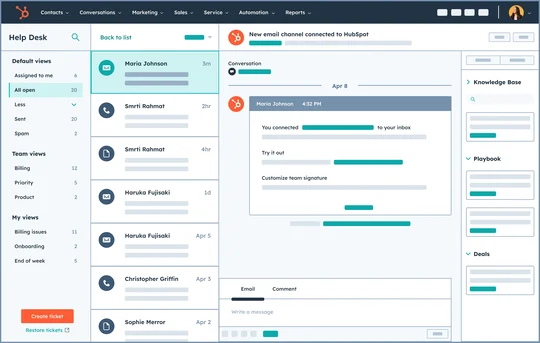
Image source: hubspot.com
Overview
HubSpot provides a suite of reporting tools built directly into its CRM platform. This offers sales, marketing, and service teams a single, unified source of truth for all data related to the customer lifecycle.
Key features
Its unique strength is the ability to generate reports that track the entire customer journey—from the first marketing touchpoint (e.g., a blog post view) to a closed deal in the sales pipeline and subsequent customer service interactions. The custom report builder is flexible and easy to use for those familiar with the platform.
Limitations
Reporting capabilities are primarily limited to the data that is stored within the HubSpot ecosystem. While it has some integration capabilities, blending large volumes of external financial or product data can be challenging compared to a dedicated BI tool.
Pricing
The reporting tools are included as a core feature in the paid tiers of HubSpot's Marketing, Sales, and Service Hubs. The sophistication of the reporting tools increases with the price tier.
Reviews
Praised by its user base for providing a 360-degree view of the customer and for making sales pipeline and marketing funnel reporting incredibly straightforward and accessible.
Best for
Businesses of all sizes that use the HubSpot CRM as their central customer record and need to generate integrated reports across their sales, marketing, and customer service teams.
The powerful benefits of using reporting tools
- Improved and faster decision-making: Reporting tools replace intuition and guesswork with hard data. By presenting clear, visual insights into business performance, they empower leaders and teams to make more accurate, confident, and timely strategic decisions.
- Enhanced operational efficiency: By automating the time-consuming processes of data collection, aggregation, and report generation, these tools save countless hours of manual labor. This frees up your employees to focus on high-value activities like analyzing the data and implementing improvements rather than just compiling it.
- A single source of truth: A centralized reporting tool eliminates data silos and ensures that everyone in the organization is working from the same information. This creates alignment across departments, reduces errors, and puts an end to debates over whose numbers are correct.
- Proactive performance monitoring: With real-time dashboards, you can continuously track Key Performance Indicators (KPIs) and monitor business health. This allows you to proactively identify positive trends to capitalize on and spot potential issues or bottlenecks before they escalate into major problems.
- Increased transparency and collaboration: Shareable reports and dashboards make data accessible to everyone, fostering a culture of transparency and accountability. When teams have a shared view of goals and performance, it facilitates more productive, data-driven conversations and better cross-functional collaboration.
Conclusion
In the end, the journey from raw data to decisive action is paved with the right reporting tools. They are the essential instruments that translate complex numbers into a clear, strategic narrative for your business. We've explored a range of powerful options, from specialized analytics platforms to comprehensive business intelligence suites.
The "best" reporting tool is not a one-size-fits-all solution; it is the one that aligns perfectly with your team's unique workflow, data sources, and strategic goals. As you make your choice, consider not only how a tool visualizes data, but how it helps your team act on it. Choose a platform like Lark, that brings insights directly into your daily operations, fostering a culture of continuous, data-driven improvement.
FAQs
What is the best tool for reporting?
There is no single "best" tool, as the ideal choice depends entirely on your needs. For deep web analytics, Google Analytics 4 is unparalleled, while Power BI excels at enterprise-level BI. For teams that need to turn reports into immediate, collaborative action, an all-in-one platform like Lark is often the most effective solution.
What do reporting tools mean?
Reporting tools are software applications that connect to various data sources, process the information, and present it in an understandable format like dashboards, charts, and tables. Their purpose is to help businesses monitor performance, track goals, and make informed, data-driven decisions.
Is PowerPoint a reporting tool?
While PowerPoint is a powerful tool for presenting the findings of a report, it is not a reporting tool itself. It cannot connect to live data sources, process information, or create interactive visualizations automatically, which are the core functions of a true reporting tool.
What reporting tools are you familiar with using?
This guide covers a wide range of popular and effective reporting tools, from web analytics platforms like Google Analytics 4 to enterprise-grade BI solutions like Power BI. It also explores innovative collaborative platforms like Lark that embed reporting directly into team workflows for seamless analysis and action.
Related reading
Table of contents
Start using Lark today

Manage all your work in one place
Boost team efficiency by 10x
Save up to 70% on software costs
Table of contents
Start using Lark today
Manage all your work in one place
Boost team efficiency by 10x
Save up to 70% on software costs
Keep reading








2026 Lark Technologies Pte. Ltd.
Headquartered in Singapore with offices worldwide.






Explore: