














10 Sales Analytics Tools That Turn Data into Decisions and Guide included

Ryan Tanner
Product Marketing Specialist
Sep 8, 2026
Ryan Tanner
Sep 8, 2026

22 min read


Understanding data is no longer optional—it's essential. That's where sales analytics comes in. It helps teams uncover patterns, track performance, and make smarter, faster decisions. Whether you're optimizing pipelines, forecasting revenue, or identifying top-performing reps, the right tools can turn raw numbers into actionable insights.
In this guide, we've rounded up 10 powerful sales analytics tools that make decision-making effortless and data-driven. From automation to real-time dashboards, these platforms can transform how you manage, measure, and grow your sales performance.
1. Lark: Unified sales analytics and collaboration workspace
2. Salesforce Analytics Cloud: Enterprise-grade predictive insights
3. HubSpot Sales Hub: CRM-native sales analytics
4. Zoho Analytics: Flexible, budget-friendly BI tool
5. Pipedrive insights: Simple visualization for sales teams
6. Klipfolio: Customizable dashboard builder
7. Google Looker Studio: Free analytics visualization tool
8. Power BI: Enterprise visualization and reporting
9. Tableau: Interactive sales data exploration
10. Insightly analytics: CRM reporting for SMBs

What is sales analytics—and why it matters more than ever
Sales analytics is the process of collecting, analyzing, and interpreting sales data to improve decision-making and performance. It goes beyond tracking revenue and quotas—it reveals trends, customer behaviors, and market opportunities that might otherwise go unnoticed. By using sales analytics, businesses can identify which strategies are working, forecast demand more accurately, and allocate resources where they'll have the greatest impact.
In today's competitive environment, data-driven decisions are no longer a luxury—they're a necessity. Companies that rely on sales analytics gain a clearer understanding of their customers, shorten sales cycles, and increase win rates. With powerful platforms like Lark, teams can visualize real-time insights, automate reporting, and collaborate seamlessly across departments. In short, sales analytics gives businesses the clarity and confidence to act faster, plan smarter, and achieve consistent growth in a constantly changing market.
Image source: unsplash.com
Key metrics and KPIs that power smart sales analytics
Smart sales analytics relies on the right metrics and KPIs to reveal what's really driving performance. Here are the key areas every sales team should track:
- Pipeline health: Monitor conversion rates, deal velocity, and average deal size to understand how efficiently leads move through the funnel. These metrics highlight bottlenecks and help improve overall deal flow.
- Rep performance: Track individual activities like calls made, demos booked, and quota attainment. These numbers show who's hitting targets, who needs support, and where coaching can make the biggest difference.
- Customer insights: Keep an eye on win/loss ratios, churn rates, and customer lifetime value. These metrics help you evaluate customer satisfaction, retention, and long-term profitability.
- Forecast accuracy: Use predictive analytics to project future sales and revenue. Accurate forecasting allows teams to plan resources management, budgets, and targets more effectively—turning data into confident decisions with tools like Lark.
Quick glance: Top sales analytics tools
Top 10 sales analytics tools for data-driven teams
1. Lark: Unified sales analytics and collaboration workspace
Lark doesn't just manage projects or oversee businesses—it connects the two. By bringing together Base, Tasks, Calendar, Docs, Approval, Sheets, OKR, and Messenger in one ecosystem, Lark ensures strategic goals translate into measurable, on-time results. It empowers leaders with visibility, equips teams with structure, and keeps communication transparent—turning vision into execution and execution into business success.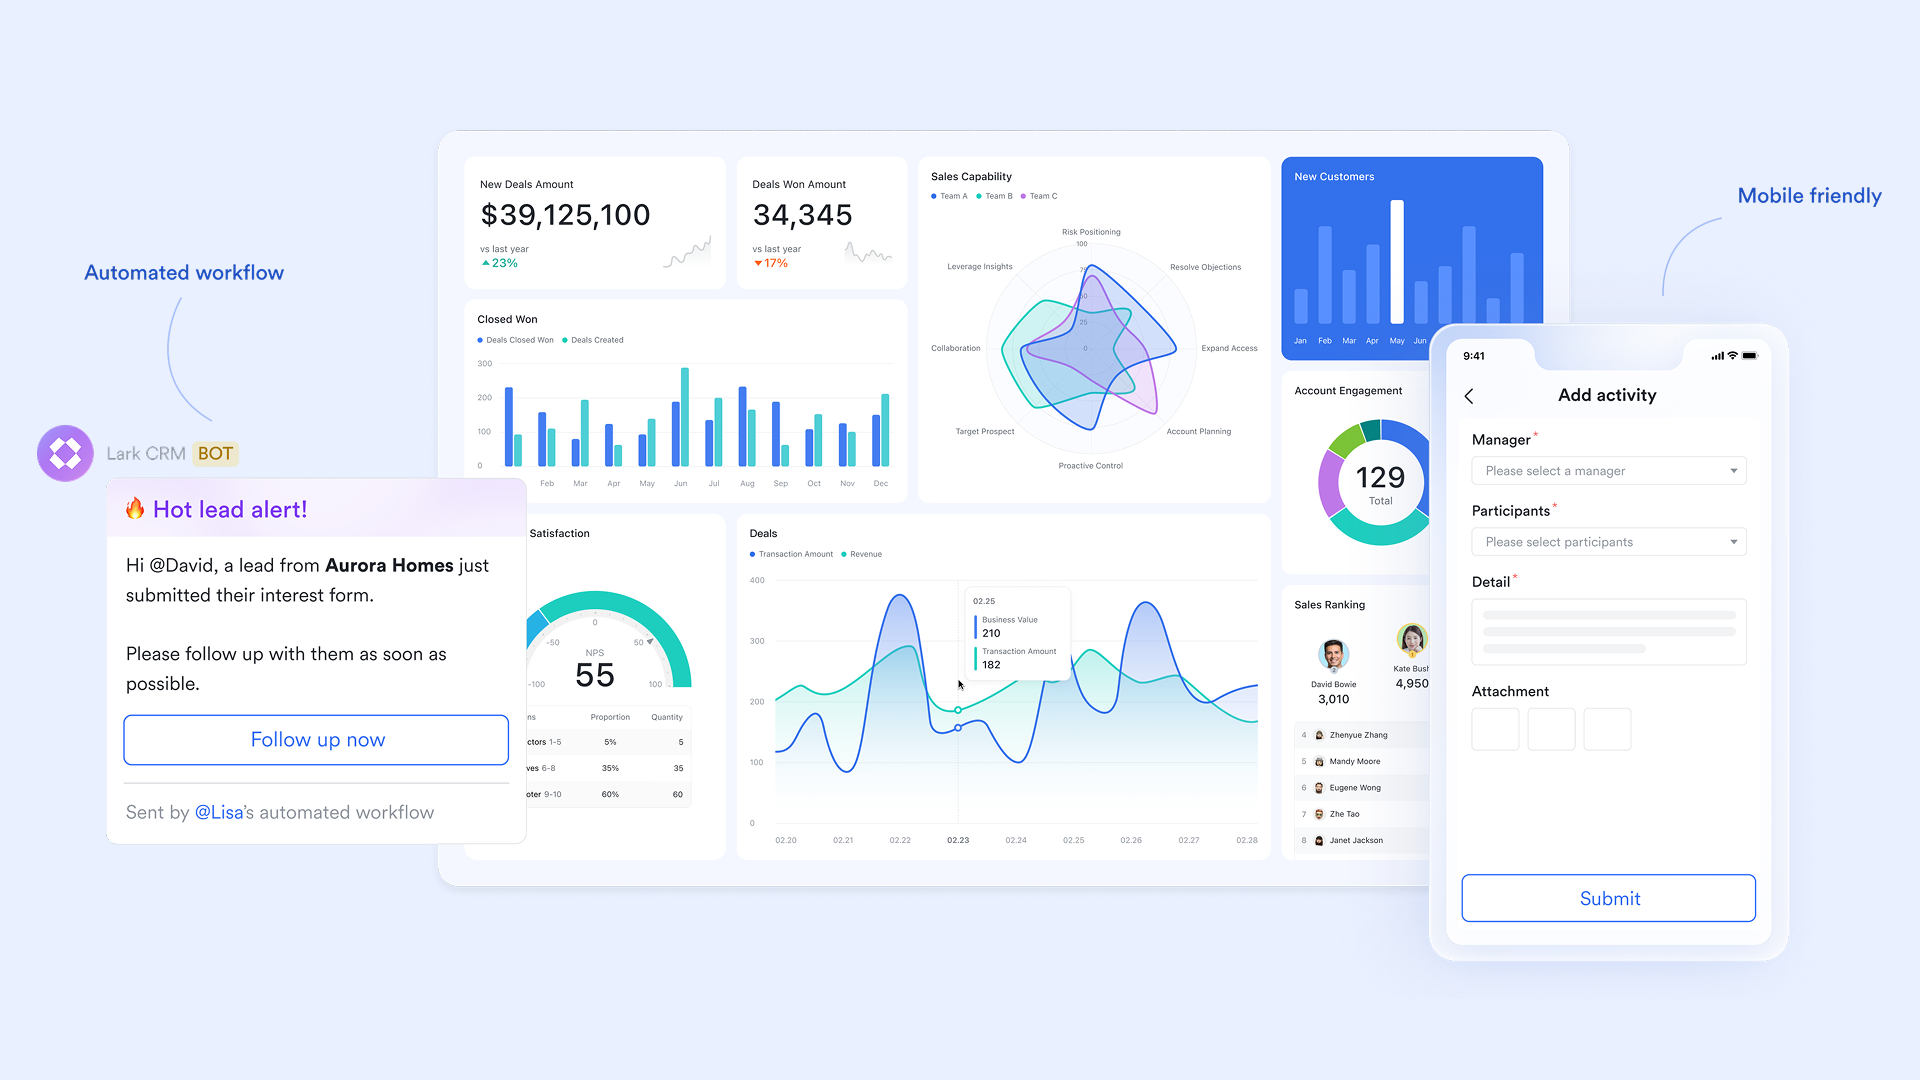
Dashboard in Lark Base: Build live dashboards:
The Lark Base Dashboard gives sales leaders a real-time view of their entire operation. It brings together revenue trends, client satisfaction scores, and profit metrics in one central space. Teams can filter by product line, region, or account manager to analyze what's driving performance—or where things might be slowing down. Visual charts and status views make it easy to spot issues before they impact results.
Example: A regional sales lead checks the Base Dashboard every Monday to compare this week's bookings versus the forecast. Seeing a dip in one territory, they drill down into deal-level data and assign follow-ups to the local team within seconds.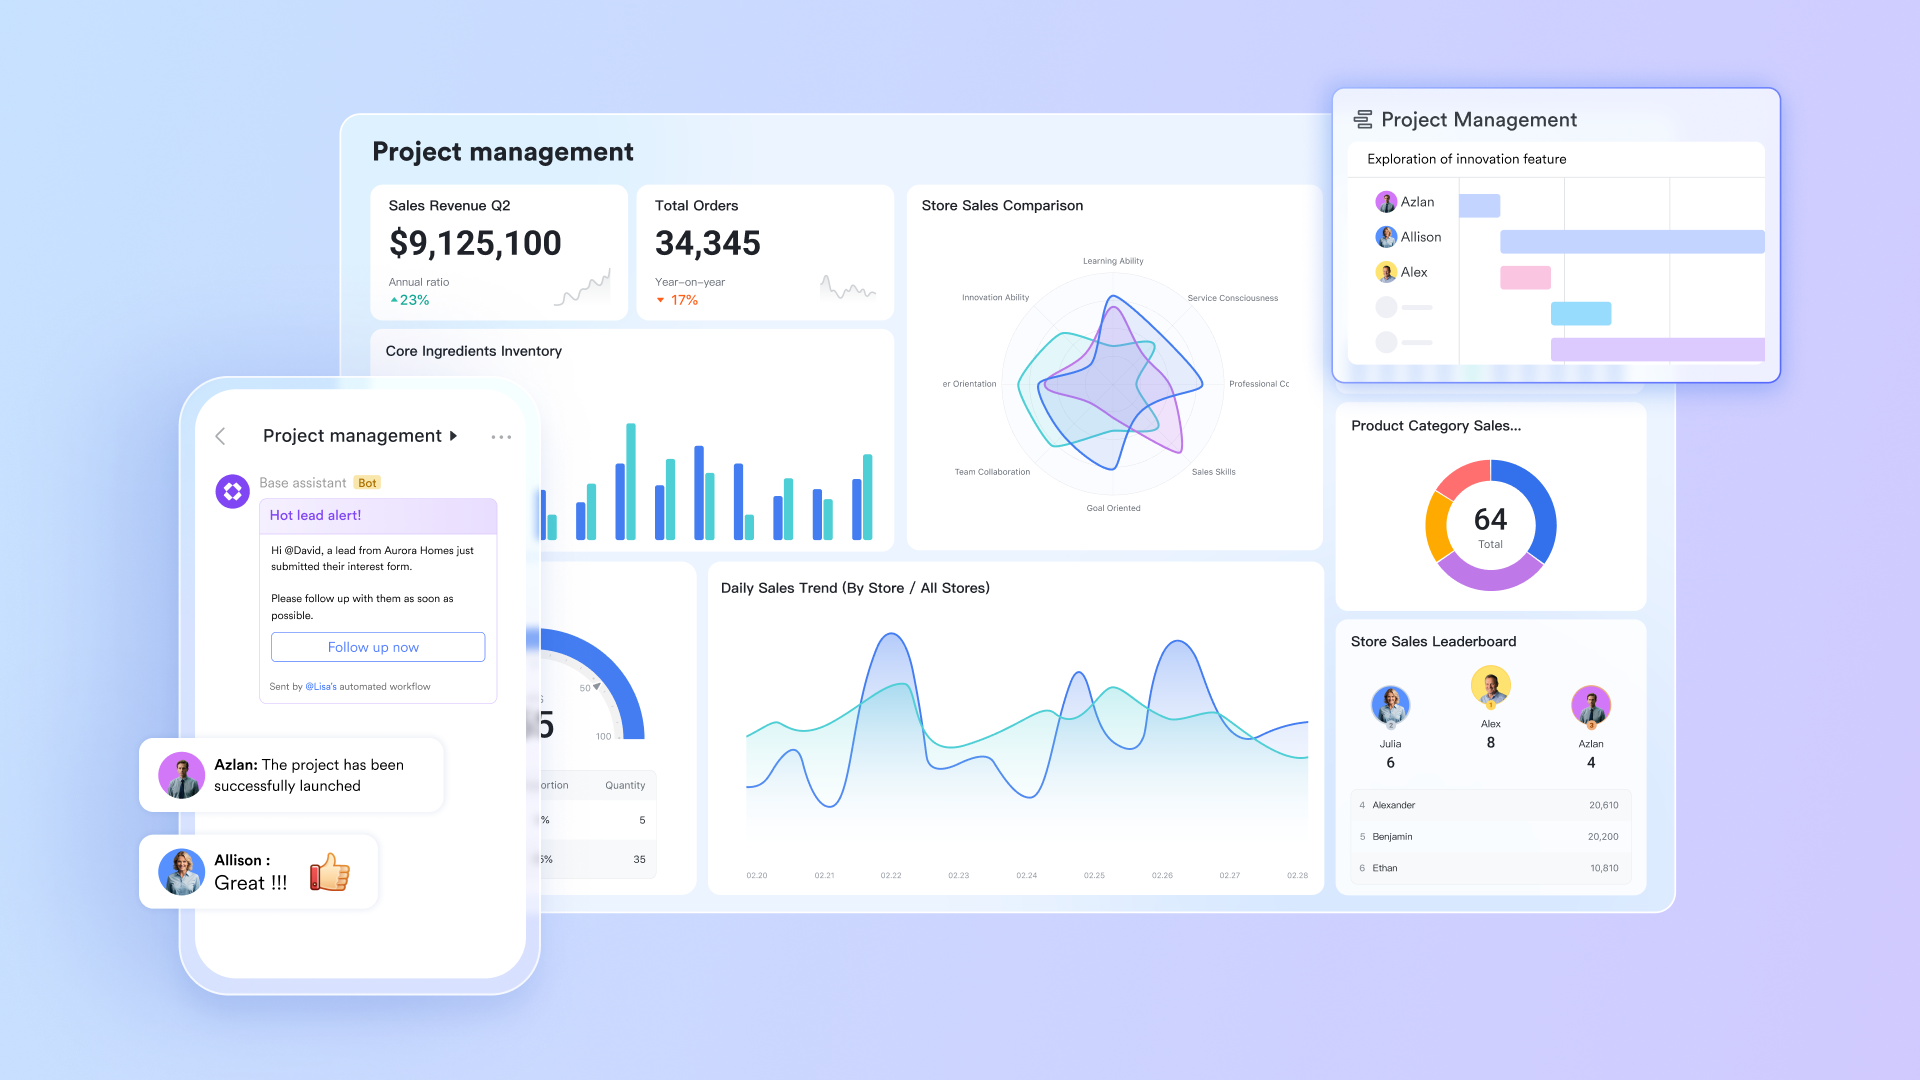
Smart Analysis in Lark Base: One-click AI insights
Smart Analysis in Lark helps sales teams quickly interpret and extract insights from sales data charts. By hovering over a chart block and selecting Smart Analysis, teams receive AI-generated summaries of key metrics such as sales performance, revenue, costs, and client satisfaction. This allows users to easily assess both team and individual results, monitor real-time sales data and regional rankings, and develop effective, data-driven strategies.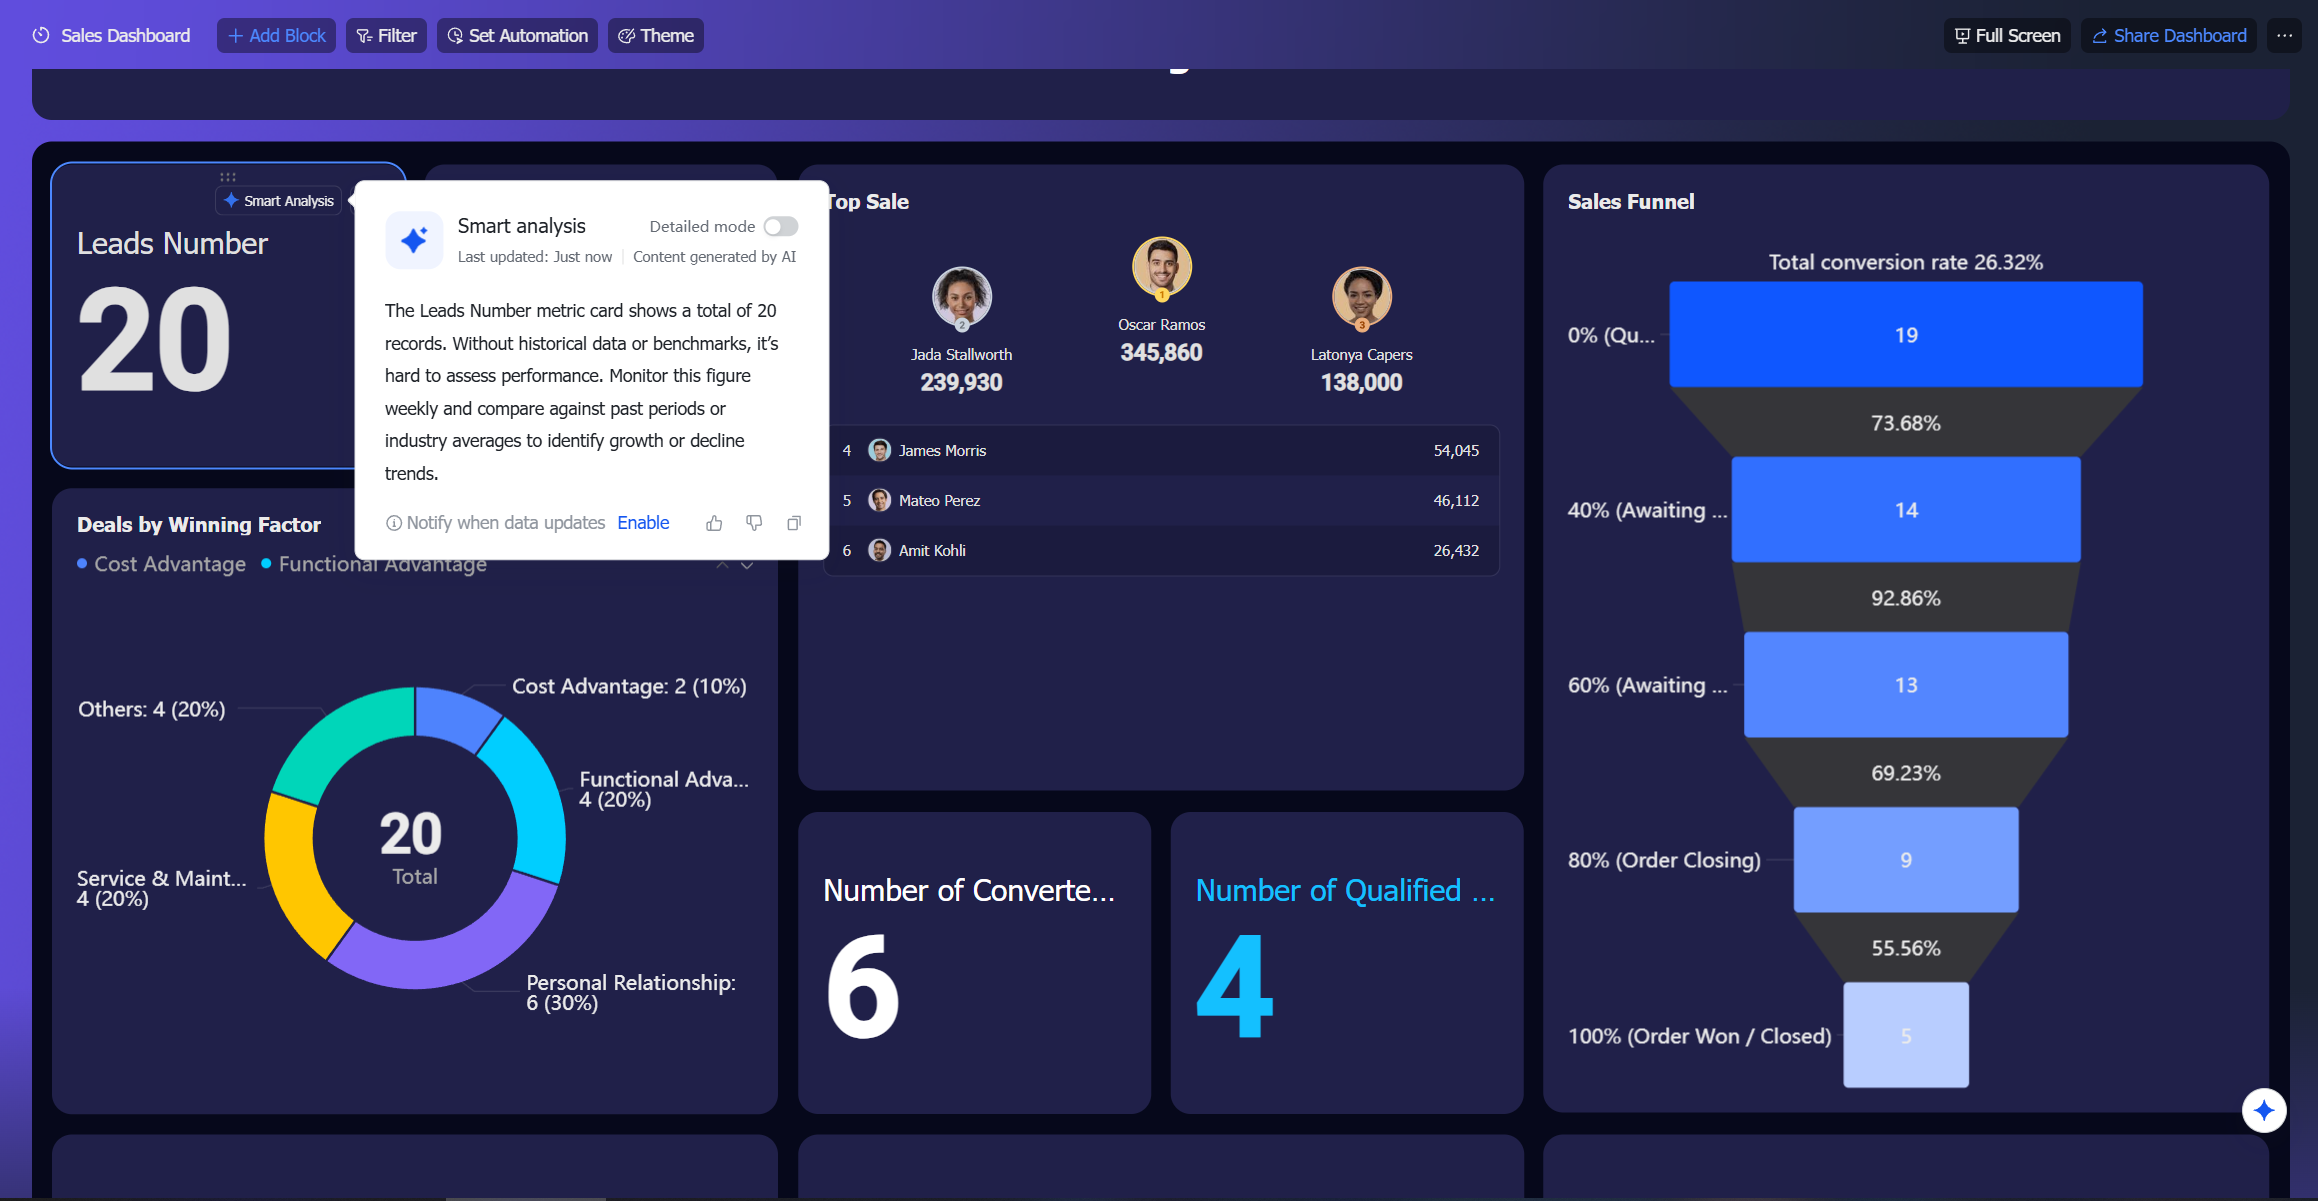
Automation in Lark Base: Automate sales reporting:
Automation in Base eliminates repetitive reporting work by sending scheduled or triggered sales reports automatically. You can set workflows to deliver updates to specific groups—like regional heads or product managers—at fixed intervals or when certain thresholds are met. It ensures everyone stays aligned without manually exporting data or building presentations.
Example: The sales operations team configures Base Automation to send weekly "Closed Won Deals" summaries to management. The workflow triggers every Friday, pulling live numbers from the database and distributing formatted summaries via Lark Messenger.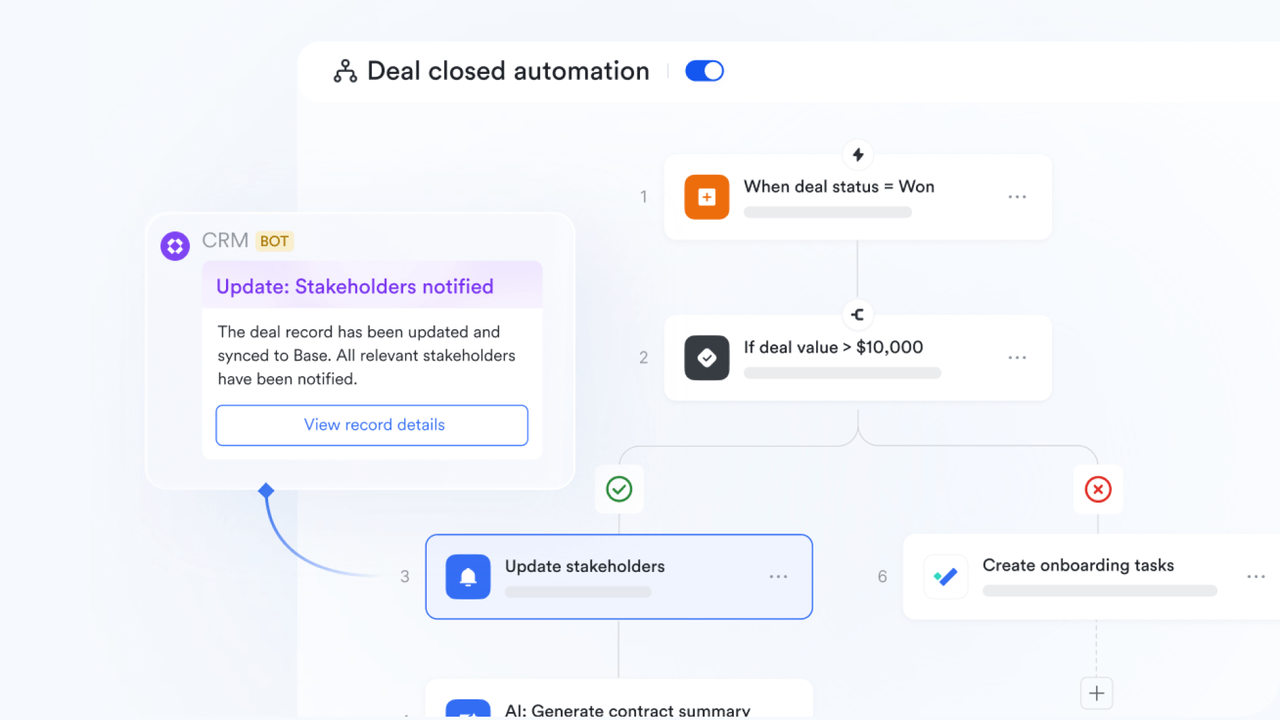
Pivot tables in Sheets: Analyze and visualize sales data flexibly
Pivot tables give teams the flexibility to analyze sales performance across multiple dimensions—time, region, product, or revenue channel. They help uncover hidden patterns, such as seasonal fluctuations or underperforming products. Because Lark Sheets is fully collaborative, multiple users can work on the same dataset simultaneously, creating faster insights without version conflicts.
Example: The finance team uses Pivot Tables in Sheets to compare quarterly performance across five regions. As soon as one analyst updates Q4 results, everyone sees the changes reflected live in their shared view.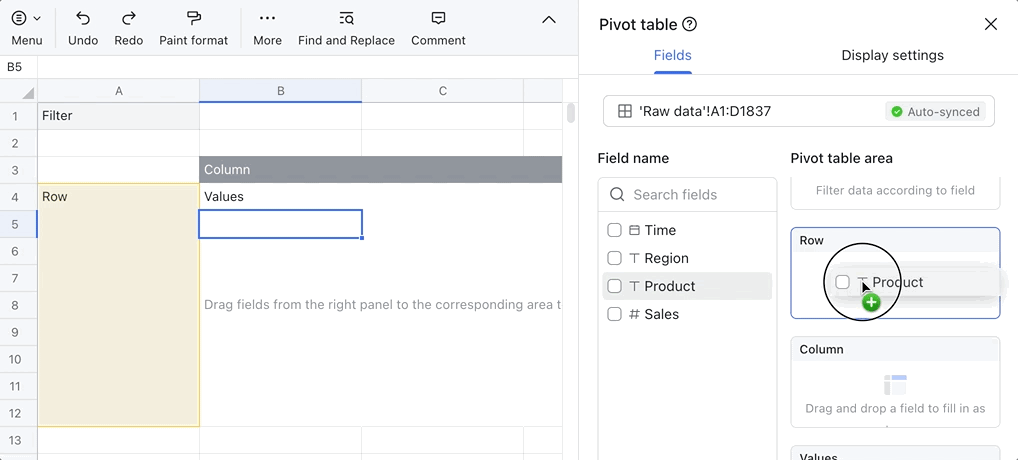
Lark Docs: Create and collaborate on reports and presentations
Lark Docs transforms static reporting into a live, interactive process. Teams can co-author sales reports, strategy summaries, or performance decks in real time, with inline comments and tag-based discussions to resolve questions instantly. You can embed live tables from sheets or dashboards from base directly into a doc, ensuring the report is always current. This eliminates scattered file versions and outdated attachments.
Example: During quarterly planning, the sales director drafts the "Q1 performance review" in a shared Lark Doc. Regional managers add their insights directly in the same file, and live data from Sheets populates charts automatically. Everyone works on the same document—no emailing files around.
Lark Meetings: Turn insights into live discussions
Lark Meetings bridges the gap between numbers and action. Teams can launch meetings straight from Base, Docs, or Calendar to discuss performance in real time. Live dashboards, sales reports, and sheets can be shared during the meeting, so decisions happen on up-to-date data—not last week's version. Notes, action items, and tasks created during the meeting sync instantly across Lark's workspace.
Example: During a weekly pipeline review, the VP of Sales shares the "Top 20 Deals" dashboard from Base inside a Lark Meeting. As the team identifies stalled deals, they create follow-up tasks directly in the sidebar. When the meeting ends, all tasks are assigned and visible in Base—no separate recap email needed.
Pros:
- Unified workspace combining analytics, communication, and collaboration
- Real-time dashboards and automatic data syncing for up-to-date insights
- Automated reporting workflows that save time and reduce manual effort
- Collaborative Docs and Meetings for seamless, data-driven discussions
Cons:
- A slight learning curve is due to its wide range of tools, but its Help Center provides complete guidance.
- Starter plan: Free forever plan that includes 11 powerful tools for up to 20 users. It also comes with 100GB of storage, 1000 automation runs, AI translations, and more.
- Pro plan: $12/user/month (billed annually) for up to 500 users. It includes everything in Starter plus group calling for up to 500 attendees, 15TB of storage, 50,000 automation runs, and more.
- Enterprise plan: Contact sales for custom pricing. Supports unlimited users and includes even more automation runs and advanced security, compliance, and management features.
2. Salesforce analytics cloud: Enterprise-grade predictive insights
Salesforce analytics cloud, also known as Tableau CRM, delivers powerful, AI-driven insights designed for large enterprises. It connects seamlessly with Salesforce CRM and other data sources, allowing teams to visualize performance, predict outcomes, and uncover growth opportunities in real time. Its predictive models and interactive dashboards help leaders make confident, data-backed decisions. Salesforce analytics cloud turns massive datasets into clear, actionable strategies that scale with your business.
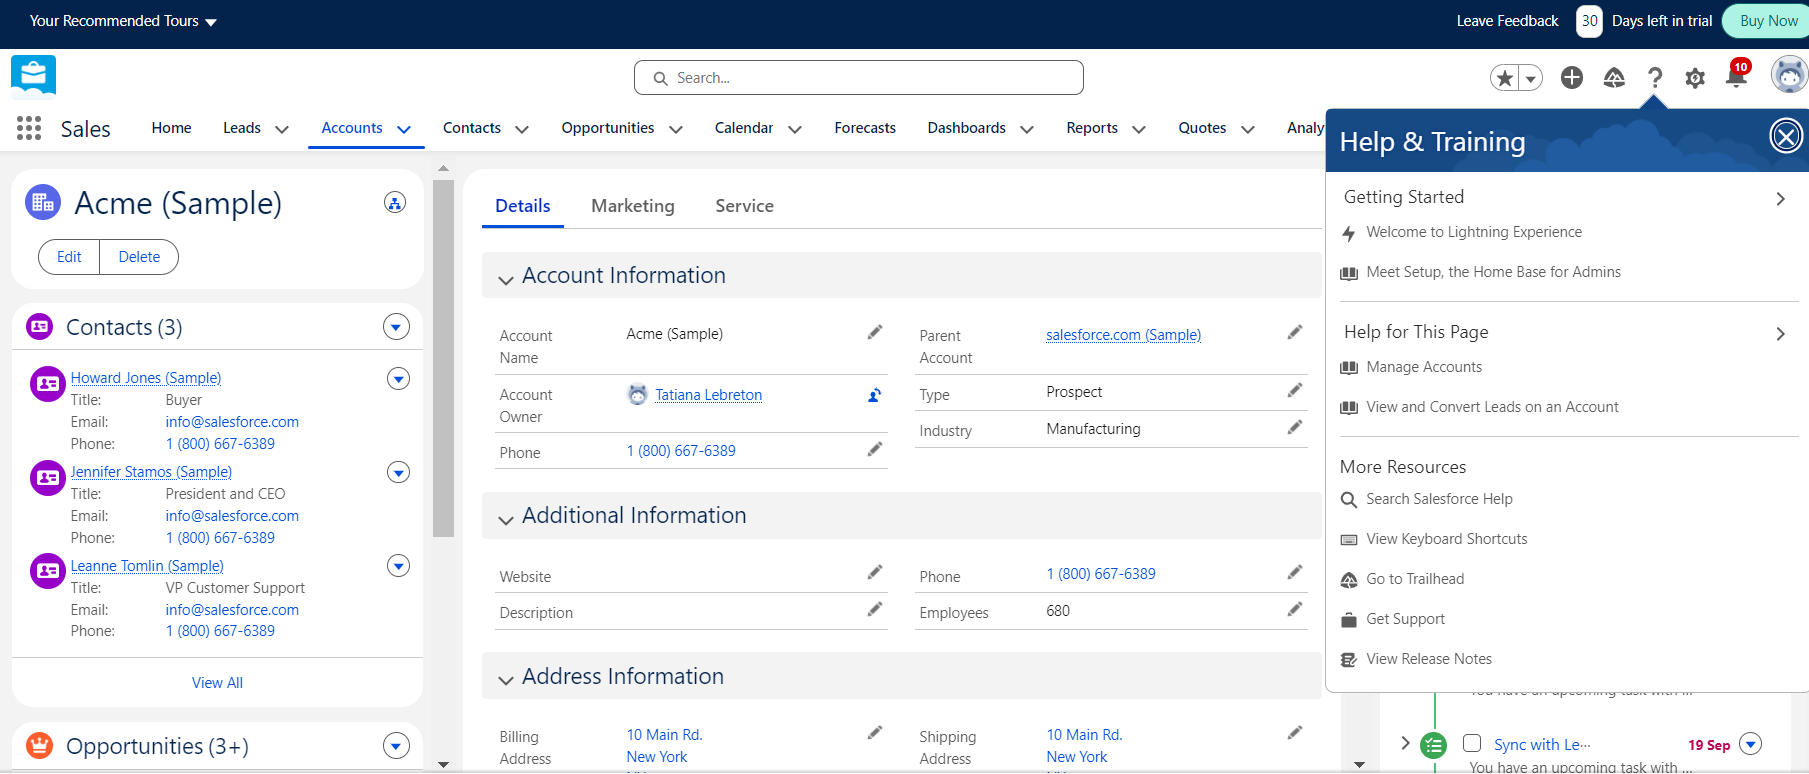
Image source: salesforce.com
Features:
- AI-powered predictive analytics for sales and revenue forecasting
- Real-time dashboards with interactive data visualization
- Deep integration with Salesforce CRM and external data systems
- Customizable reports for teams and leadership
- Advanced data security and governance controls
Pros:
- Highly scalable and suitable for enterprise-level data operations
- Seamless integration with the Salesforce ecosystem
- Robust predictive capabilities powered by AI and machine learning
- Detailed dashboards that support strategic decision-making
Cons:
- Expensive setup and licensing costs for smaller teams
- Requires technical expertise to fully customize and manage
Pricing:
- Starter plan: ~US$75+/user/month (Tableau Creator)
- Mid-tier plan: ~US$140+/user/month (CRM Analytics)
- Enterprise plan: ~US$250+/user/month
3. HubSpot Sales Hub: CRM-native sales analytics
HubSpot Sales Hub brings powerful sales analytics directly into the CRM environment, making it ideal for teams that want actionable insights without switching tools. It helps sales managers track pipelines, monitor team performance, and forecast revenue—all within one unified dashboard. With real-time reporting, visual deal tracking, and automated insights, HubSpot simplifies how teams understand and act on their data. It's an accessible, user-friendly choice for growing businesses looking to align analytics with everyday sales activity.
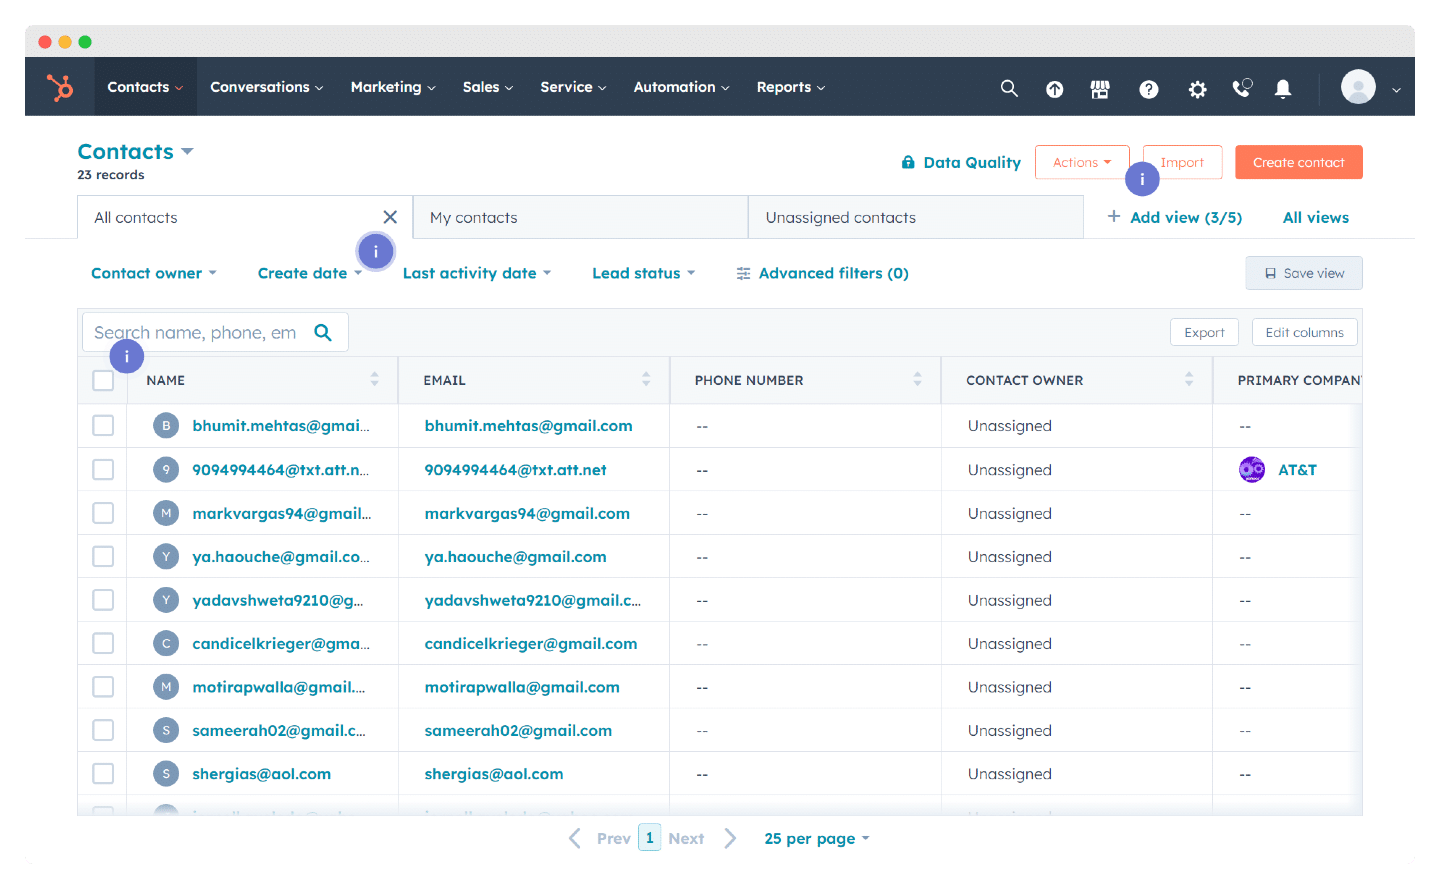
Image source: hubspot.com
Features:
- Built-in dashboards with customizable reports and filters
- Deal tracking and pipeline visualization in real time
- Revenue forecasting based on deal stages and probabilities
- Integration with marketing and service data for full-funnel visibility
- Automated alerts and insights for performance tracking
Pros:
- Easy to use with minimal setup required
- Seamlessly integrates with HubSpot's marketing and service hubs
- Provides clear, visual analytics for fast decision-making
- Great balance of automation and manual control for flexible analysis
Cons:
- Limited advanced analytics compared to enterprise-level tools
- Customization options can be restrictive for complex sales structures
Pricing:
- Free plan: Free
- Starter plan: ~US$20/user/month (annual)
- Professional plan: ~US$100/user/month
- Enterprise plan: ~US$150/user/month
4. Zoho Analytics: Flexible, budget-friendly BI tool
Zoho Analytics is a versatile business intelligence platform that makes sales analytics accessible for small and mid-sized businesses. It allows teams to combine data from multiple sources, visualize trends, and generate actionable insights without a heavy investment. With intuitive dashboards, drag-and-drop reporting, and automated data syncing, Zoho Analytics helps businesses uncover opportunities, track performance, and make informed decisions.
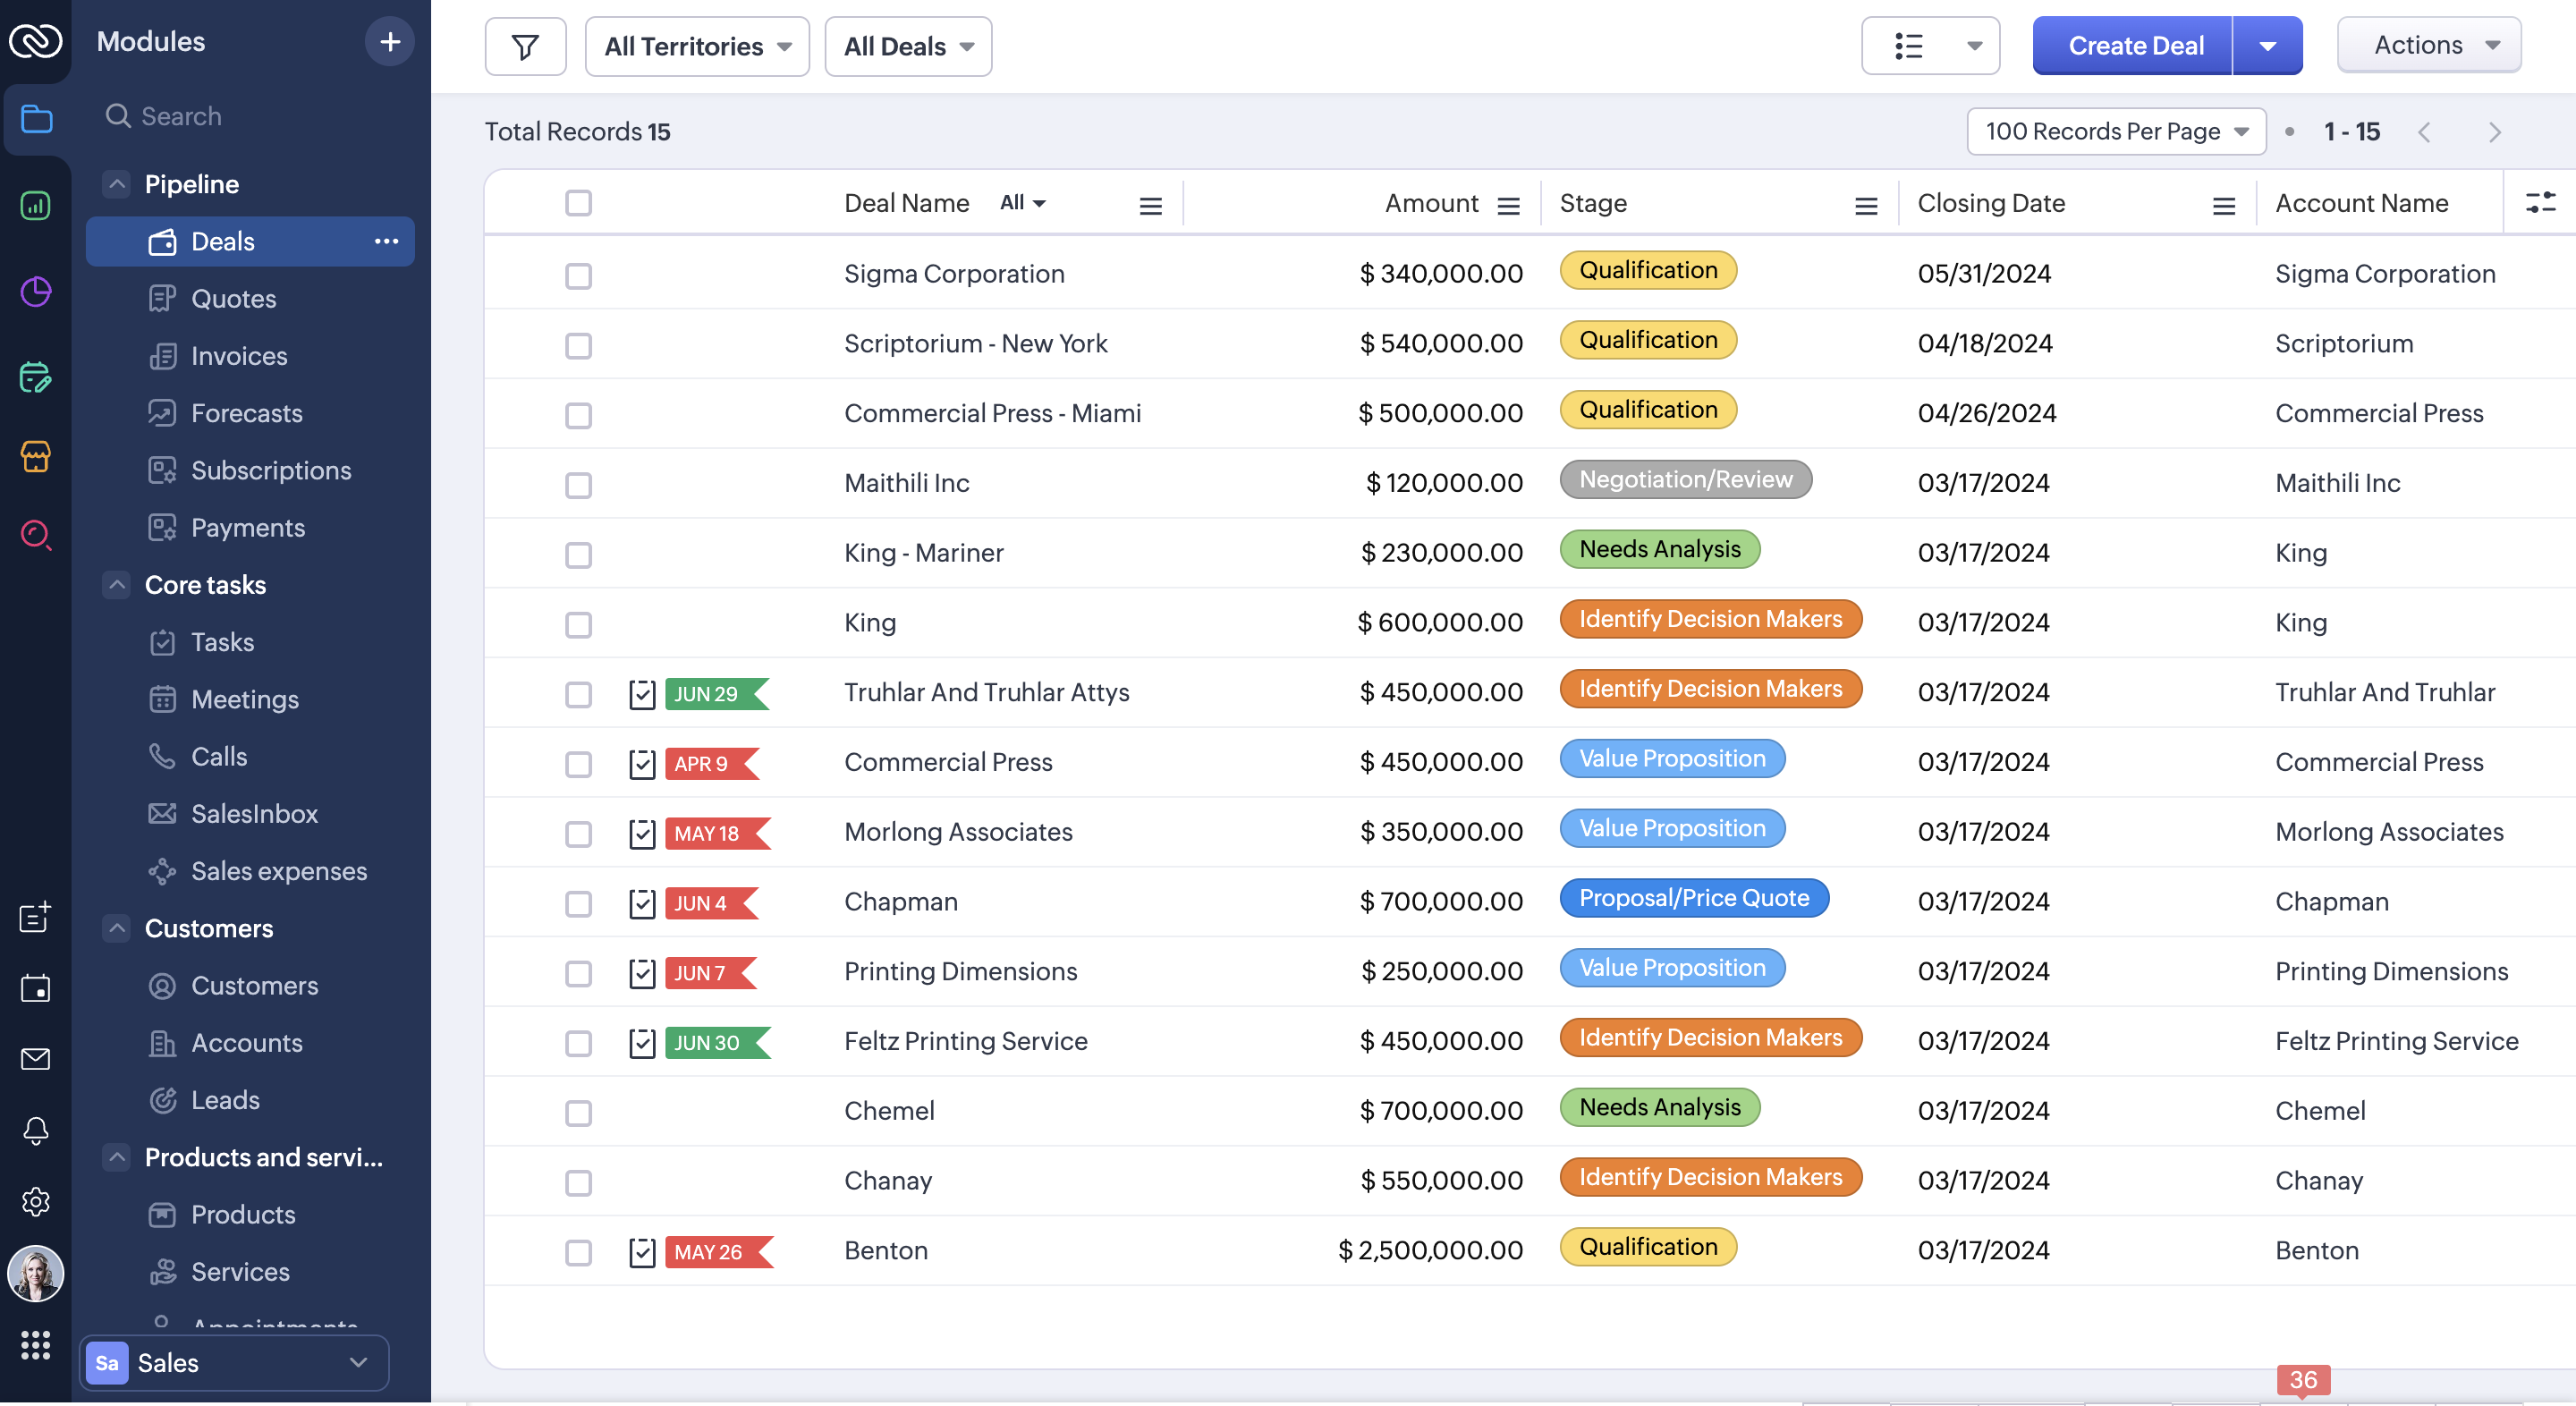
Image source: zoho.com
Features:
- Drag-and-drop dashboard and report creation
- Data integration from multiple sources including CRM, spreadsheets, and cloud apps
- AI-powered insights and trend predictions
- Automated reporting and scheduled data updates
- Role-based access and collaboration for teams
Pros:
- Affordable and suitable for SMB budgets
- User-friendly interface with minimal technical expertise required
- Flexible reporting and visualization options
- Supports cross-department analytics for unified insights
Cons:
- May lack advanced predictive analytics of enterprise tools
- Performance can slow with very large datasets
Pricing:
- Free plan: Free (up to 2 users)
- Basic plan: US$25/month (2 users)
- Enterprise plan: US$575/month (50 users)
5. Pipedrive Insights: Simple visualization for sales teams
Pipedrive Insights offers straightforward sales analytics designed for small to mid-sized teams focused on pipeline management. It transforms raw sales data into easy-to-read visual dashboards, helping managers track deal progress, monitor team activity, and spot trends quickly. With built-in reports and intuitive charts, Pipedrive makes it simple to measure performance without needing a dedicated analytics team. Its simplicity and focus on core sales metrics make it an ideal tool for teams that want fast, actionable insights without complexity.
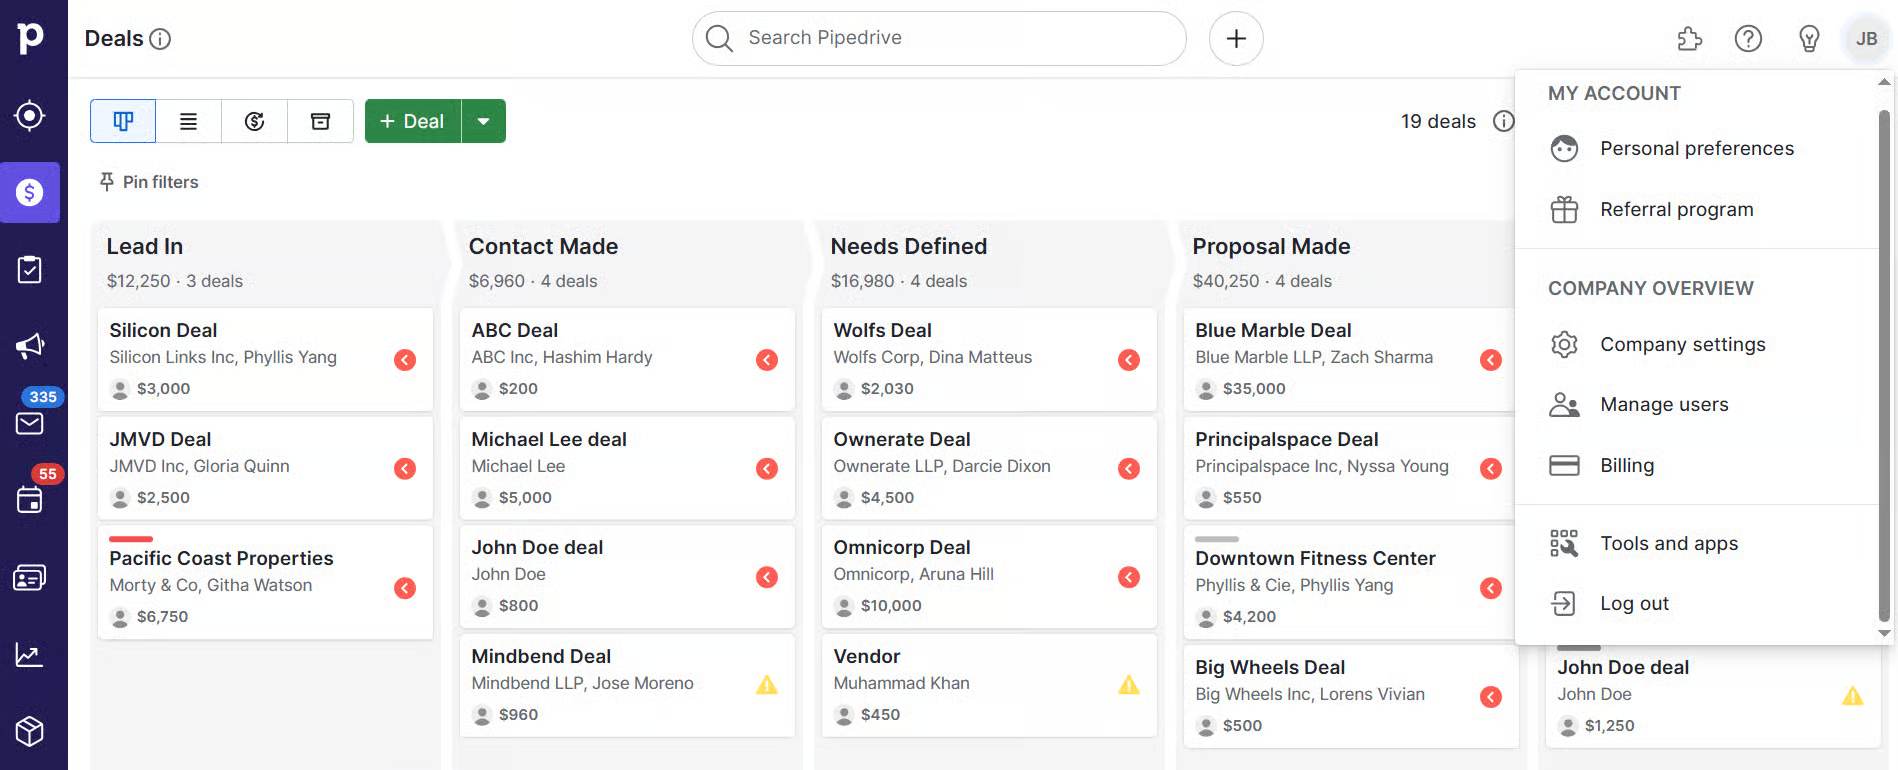
Image source: pipedrive.com
Features:
- Visual dashboards for pipeline tracking and deal status
- Pre-built reports for team performance and revenue metrics
- Customizable metrics and filters for focused analysis
- Goal tracking and performance comparison over time
- Integration with CRM data and external apps
Pros:
- Easy to set up and use for small teams
- Clear, visual reporting for quick decision-making
- Focused on actionable sales metrics
- Lightweight platform without unnecessary complexity
Cons:
- Limited advanced analytics and predictive capabilities
- Less suitable for large enterprises with complex data needs
Pricing:
- Free plan: Not available
- Essential plan: US$14/user/month (annual)
- Advanced plan: US$29/user/month
- Professional plan: US$49/user/month
- Enterprise plan: US$79/user/month
6. Klipfolio: Customizable dashboard builder
Klipfolio is a powerful dashboard platform that turns scattered data into clear, real-time visualizations. It's designed for teams that need to consolidate information from multiple sources—CRMs, spreadsheets, marketing tools, and more—into a single view. With fully customizable dashboards, users can track key sales analytics metrics, monitor trends, and make informed decisions quickly. Its flexibility and integration options make it ideal for teams seeking a centralized, data-driven overview of their business performance
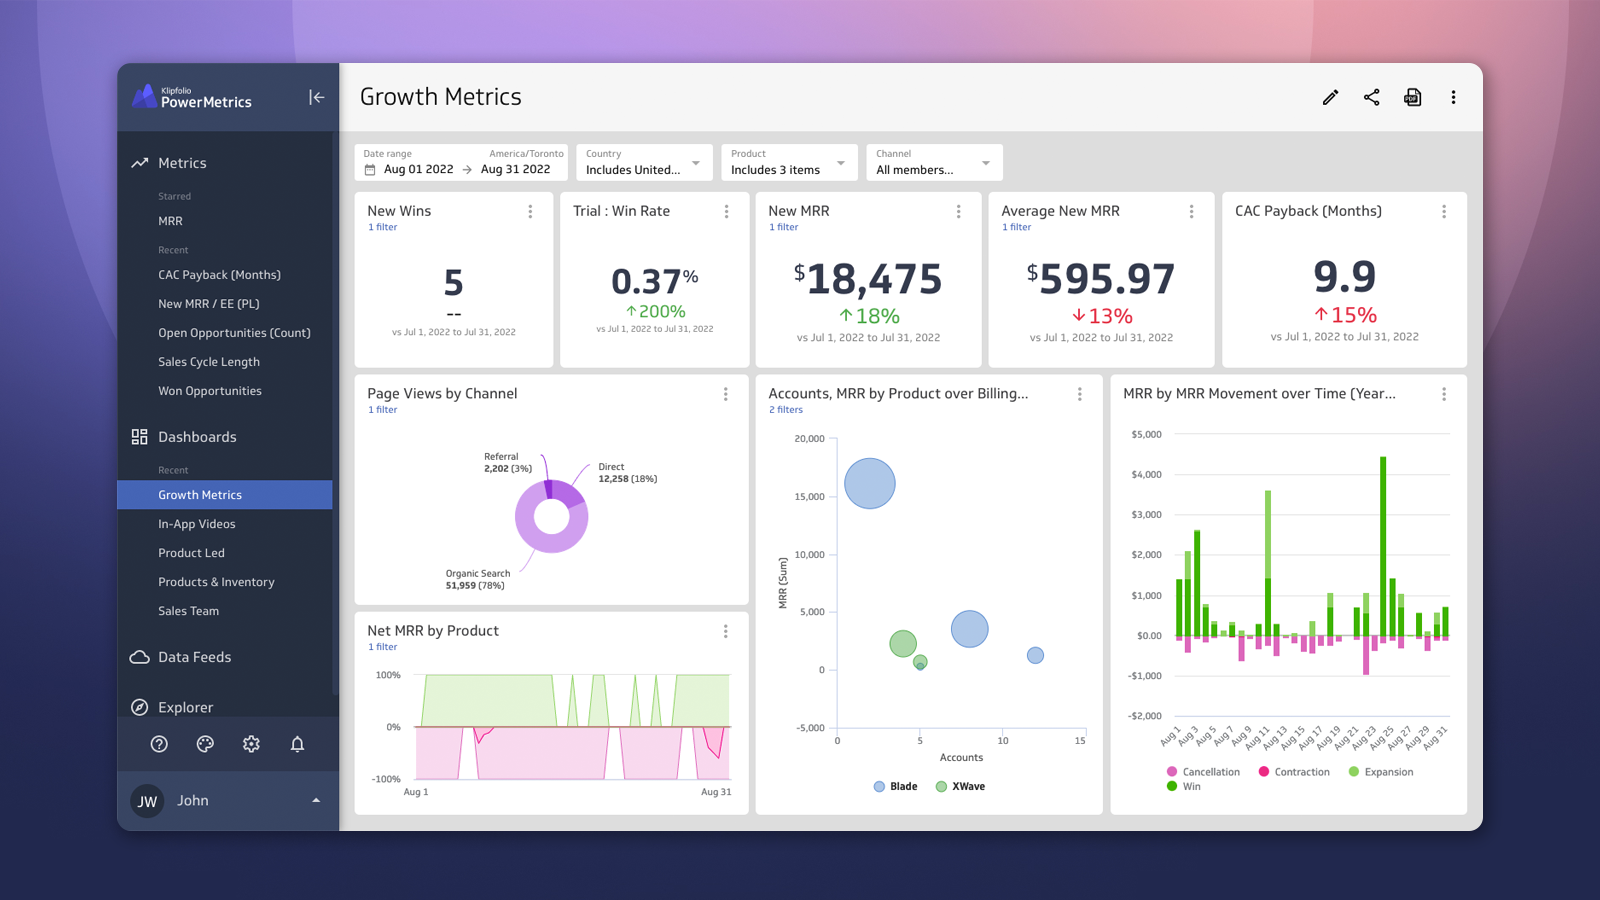
Image source: klipfolio.com
Features:
- Customizable, real-time dashboards and visualizations
- Integration with dozens of data sources including CRM and marketing tools
- Drag-and-drop interface for creating reports and charts
- Automated alerts and data refresh scheduling
- Collaborative features for team-wide access and updates
Pros:
- Centralizes data from multiple platforms for a unified view
- Real-time updates ensure decisions are based on current information
- Highly customizable dashboards for specific team needs
- Supports collaboration across departments
Cons:
- Can be complex to set up for users without technical experience
- Pricing may increase as more data sources and dashboards are added
Pricing:
- Base plan: US$120/month
- Grow plan: US$190/month
- Team plan: US$310/month
- Enterprise: Custom
7. Google Looker Studio: Free analytics visualization tool
Google Looker Studio is a free, powerful tool that transforms data into interactive, easy-to-understand visualizations. Ideal for teams already using Google products, it connects seamlessly with Google analytics, ads, sheets, and other sources to provide a unified view of performance. With customizable dashboards and reports, sales and marketing teams can track sales analytics, monitor campaign effectiveness, and uncover trends in real time.
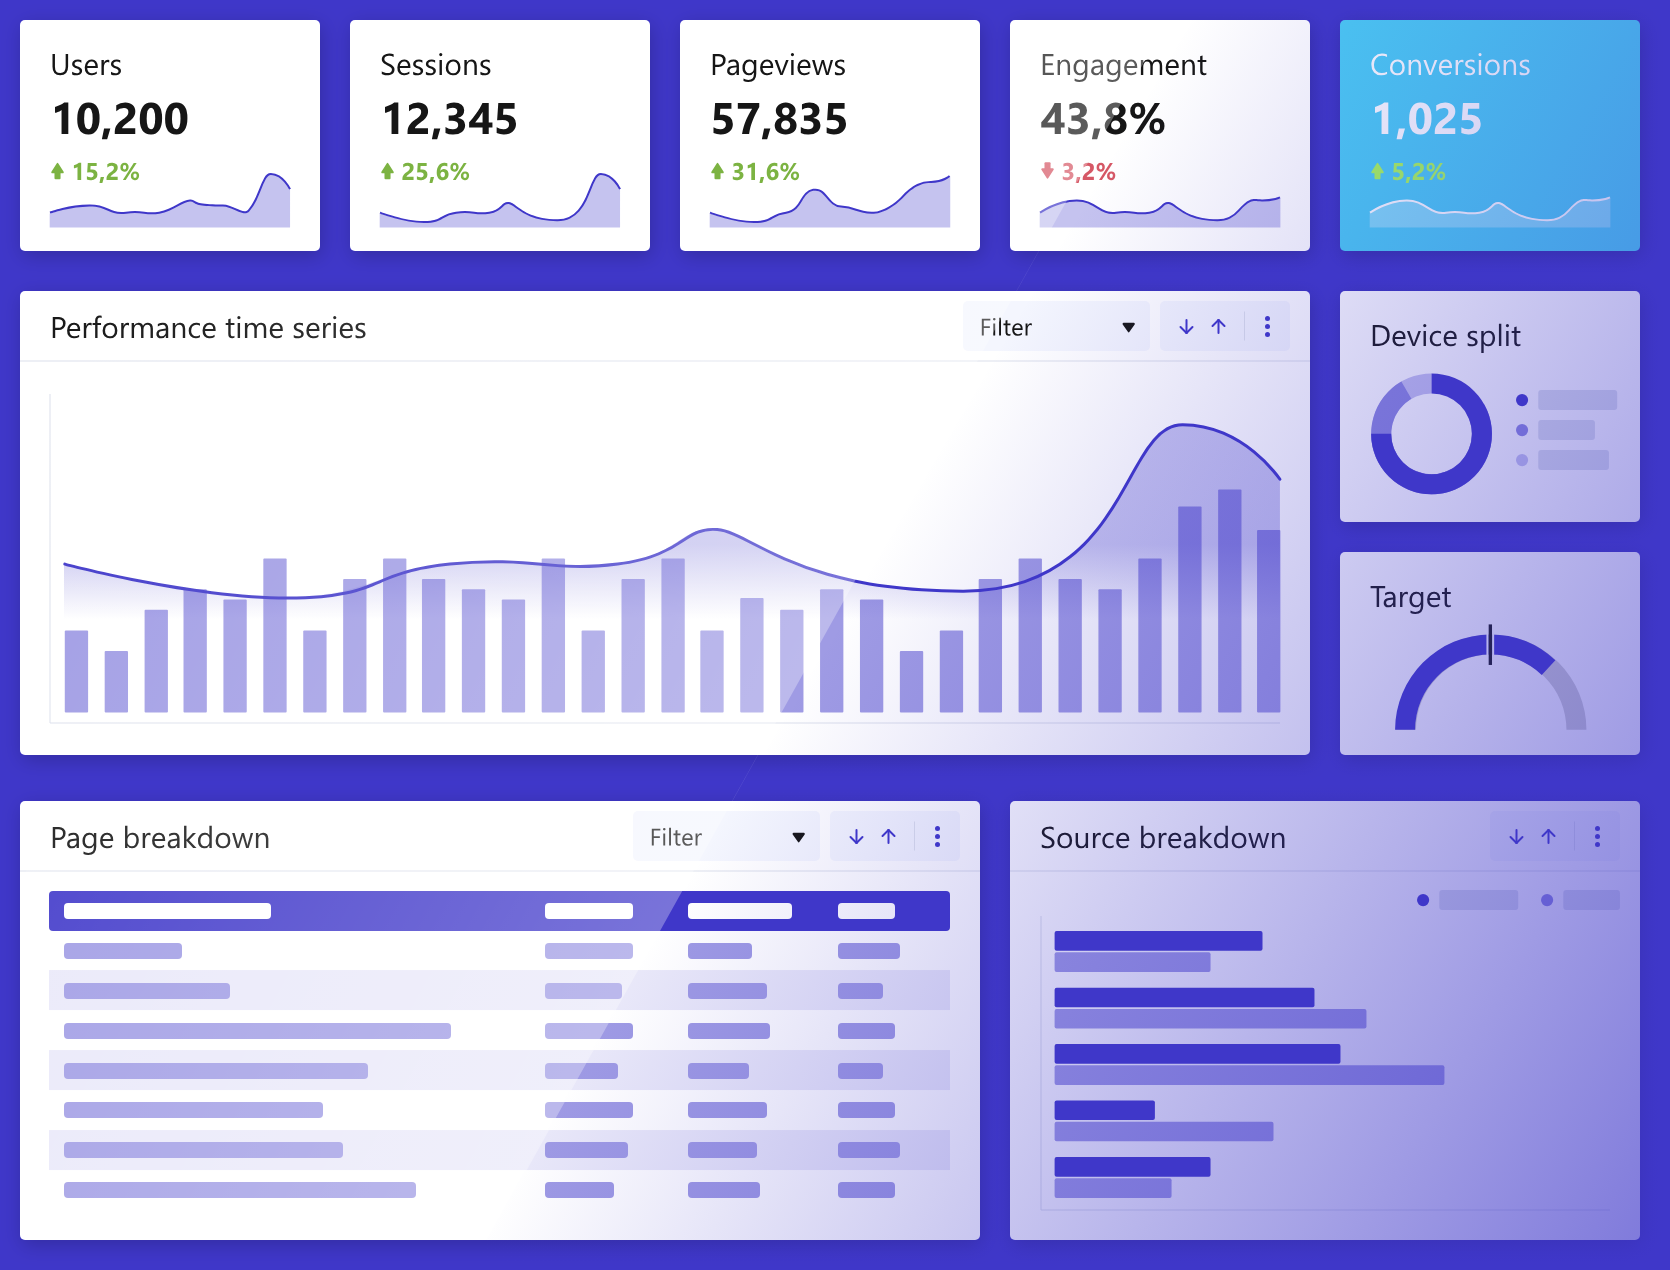
Image source: lookerstudio.google.com
Features:
- Customizable dashboards with interactive charts and graphs
- Integration with Google products like analytics, ads, and sheets
- Real-time data updates for accurate reporting
- Collaborative sharing and commenting for teams
- Pre-built templates for quick setup
Pros:
- Free to use with robust visualization capabilities
- Seamless integration with Google ecosystem
- Real-time insights for fast decision-making
- Easy collaboration and report sharing
Cons:
- Limited advanced analytics and predictive modeling
- Performance may slow with very large datasets
Pricing:
- Free plan: Free (formerly Google Data Studio)
8. Power BI: Enterprise visualization and reporting
Power BI is a robust business intelligence platform designed for organizations that need advanced sales analytics and reporting capabilities. It consolidates data from multiple sources, allowing teams to create interactive dashboards, generate detailed reports, and uncover actionable insights. With strong visualization tools and AI-powered analytics, Power BI helps businesses monitor performance, forecast trends, and make informed, data-driven decisions.
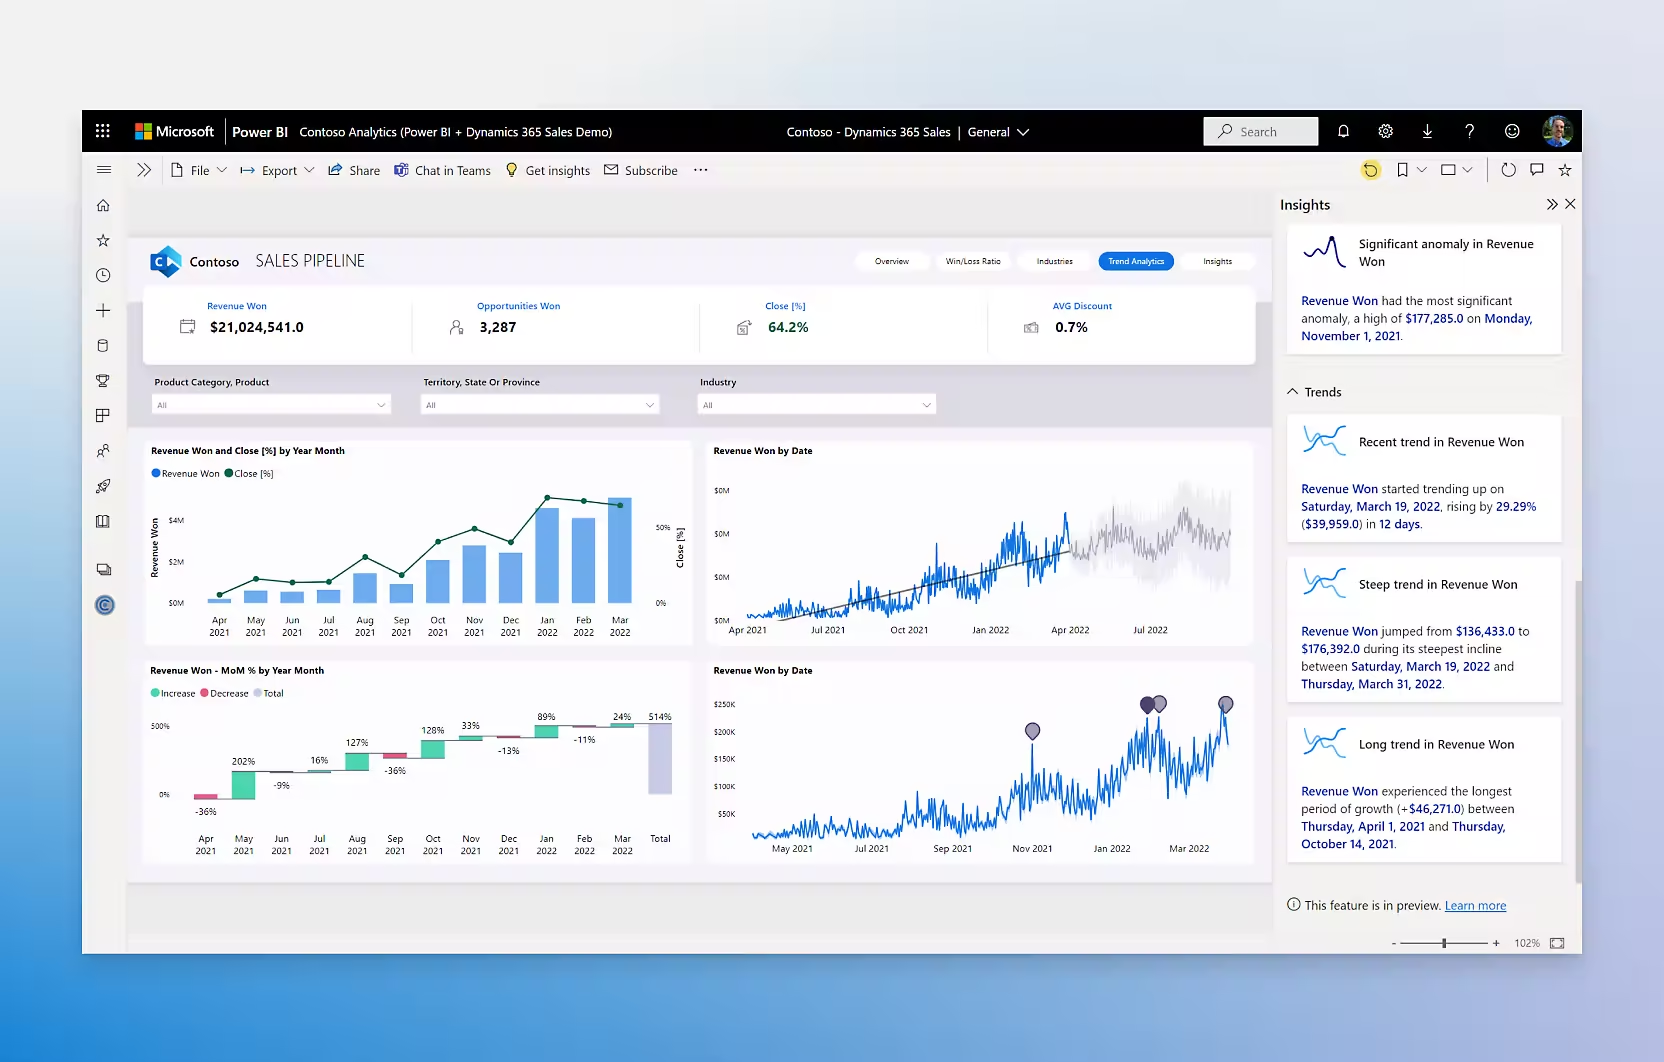
Image source: microsoft.com
Features:
- Interactive dashboards with real-time data visualization
- Integration with a wide range of data sources, including CRM and ERP systems
- AI-driven insights and predictive analytics
- Customizable reports and data modeling capabilities
- Role-based access and collaboration for teams
Pros:
- Powerful analytics suitable for large, complex organizations
- Real-time dashboards and reporting for accurate decision-making
- Advanced AI and predictive analytics for deeper insights
- Flexible data modeling and visualization options
Cons:
- Steeper learning curve for new users
- Licensing and setup costs can be high for smaller teams
Pricing:
- Free plan: Free
- Pro plan: US$9.99/user/month
- Premium plan: US$20/user/month
- Capacity-based plan: From US$4,995/month
9. Tableau: Interactive sales data exploration
Tableau is a leading platform for sales analytics that emphasizes interactive, visually compelling data exploration. It allows teams to connect to multiple data sources, create detailed dashboards, and uncover patterns that drive smarter business decisions. With its drag-and-drop interface and advanced visualization options, Tableau turns complex datasets into stories that are easy to understand and share. This makes it ideal for teams that want to present insights clearly to stakeholders and drive action across the organization.
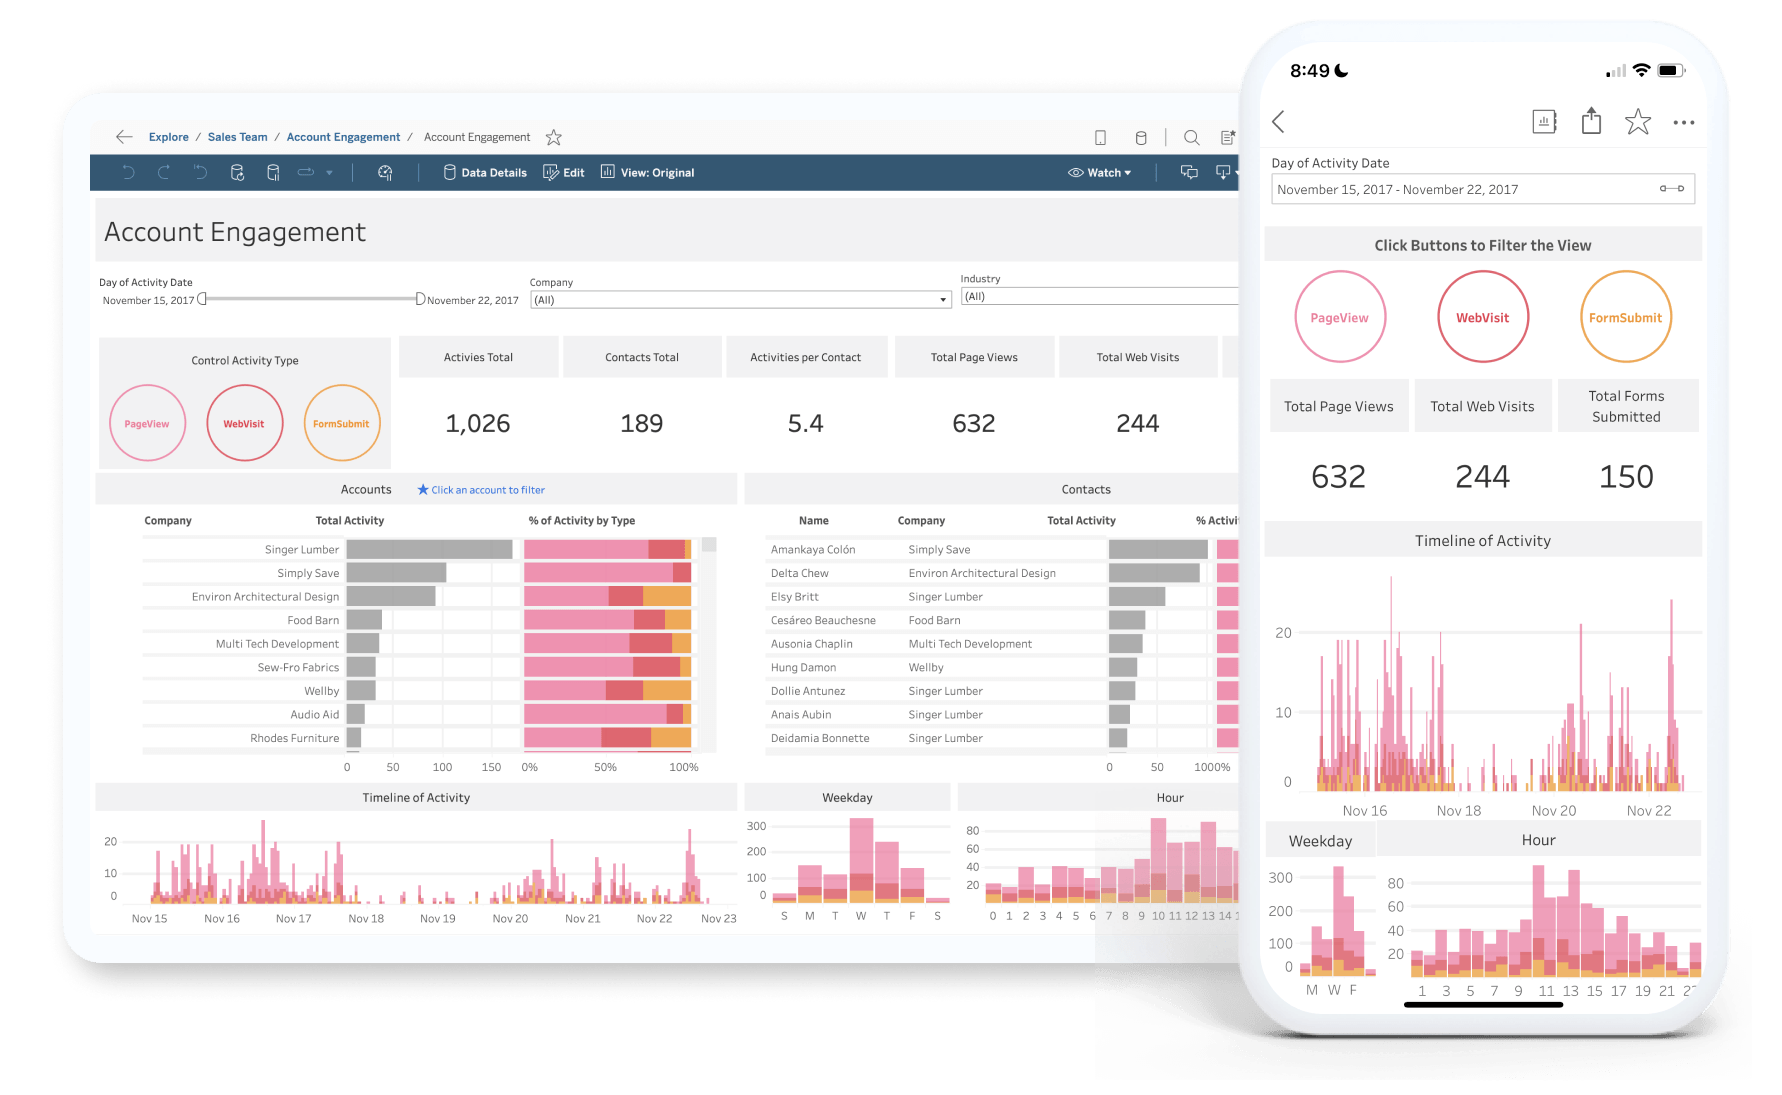
Image source: tableau.com
Features:
- Interactive dashboards with drag-and-drop visualizations
- Integration with multiple data sources, including CRM and spreadsheets
- Advanced analytics with trend lines, forecasts, and statistical modeling
- Collaborative sharing and commenting within dashboards
- Pre-built templates for quick deployment
Pros:
- Powerful visualization tools for clear data storytelling
- Handles large datasets with complex relationships
- Real-time insights and interactive exploration
- Supports cross-team collaboration on analytics
Cons:
- Can be expensive for small teams or businesses
- Requires training to leverage advanced features effectively
Pricing:
- Viewer plan: US$15/user/month (billed annually)
- Explorer plan: US$42/user/month
- Creator plan: US$75/user/month
- Enterprise plan: Custom
10. Insightly analytics: CRM reporting for SMBs
Insightly analytics offers SMBs a straightforward way to track sales analytics directly within their CRM. It provides real-time dashboards, customizable reports, and pipeline insights, helping teams monitor performance and identify opportunities without juggling multiple tools. Its integration with CRM data ensures that every report reflects up-to-date customer interactions, making it easier for small businesses to make informed, data-driven decisions.
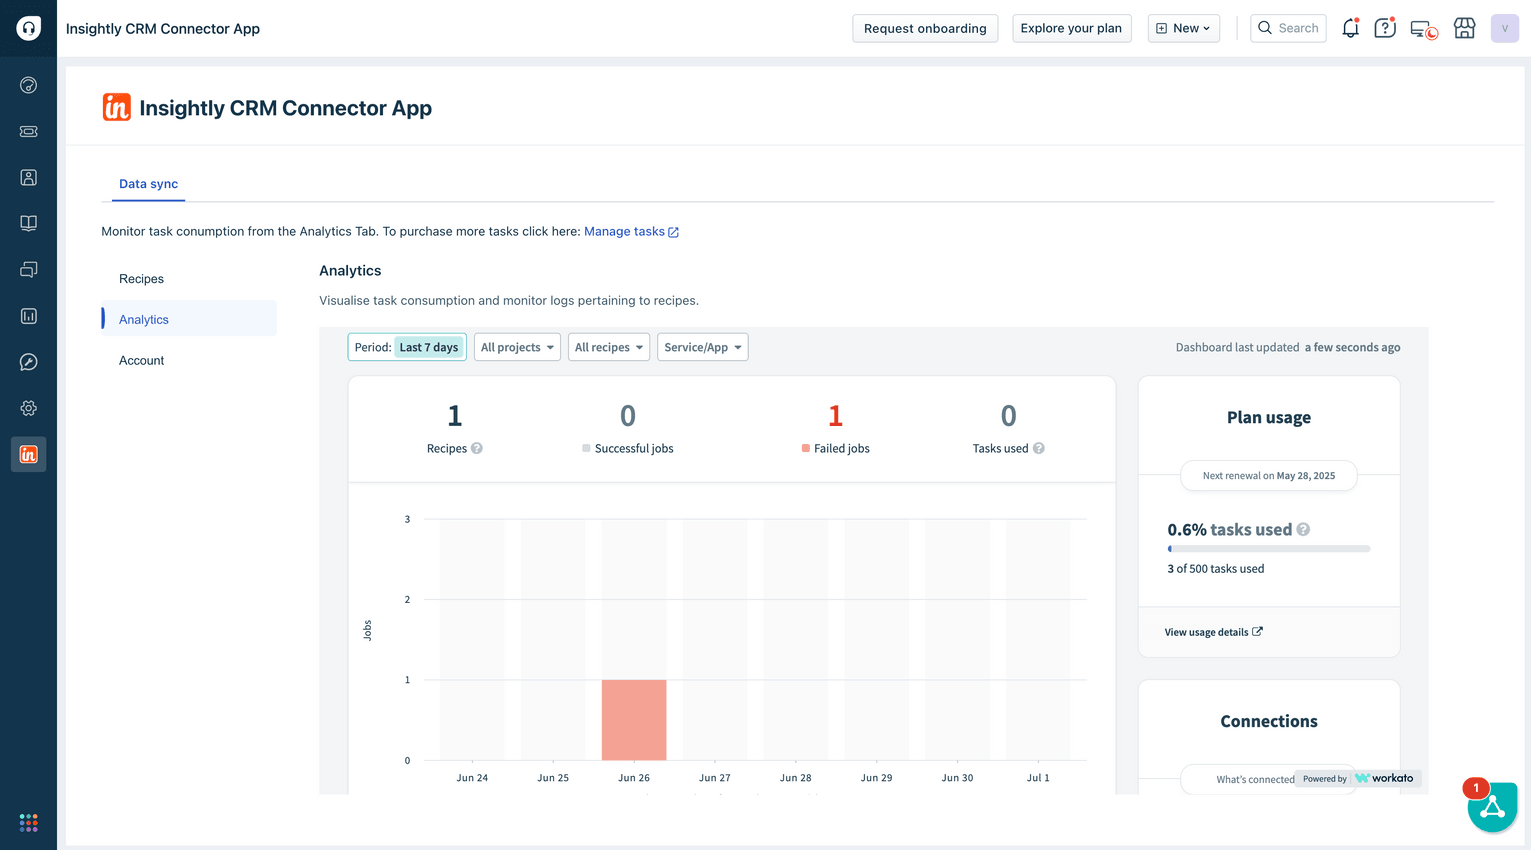
Image source: insightly.com
Features:
- Customizable dashboards for sales performance and pipeline tracking
- Real-time reporting from CRM data
- Pre-built templates for deals, leads, and customer activity
- Goal tracking and performance comparison
- Integration with email, marketing, and project management tools
Pros:
- Easy to use and set up for small teams
- Real-time insights from CRM for accurate reporting
- Simple, actionable dashboards with pre-built templates
- Integrates well with email and marketing tools
Cons:
- Limited advanced analytics compared to enterprise BI tools
- Less suitable for large organizations with complex reporting needs
Pricing:
- Free plan: Not available
- Paid plan: Custom (Contact Sales)
Common roadblocks teams face with sales analytics
Many teams struggle to derive full value from sales analytics due to a few common obstacles.
- Data is scattered across tools: Sales data often lives in different places—spreadsheets, CRMs, and email inboxes. This fragmentation makes it difficult to see the complete picture or trust the accuracy of reports.
- No single source of truth: When marketing, sales, and operations each track data separately, numbers rarely match. This creates confusion, slows decision-making, and leads to misaligned goals across departments.
- Reports lag behind reality: In fast-moving sales environments, waiting a week for updated reports is too long. By the time the data arrives, the situation may have already changed.
Tools like Lark solve these challenges by centralizing data, syncing updates in real time, and keeping everyone aligned. The result is faster insights, fewer errors, and more intelligent, more confident decisions.
Best practices to get the most from your sales analytics
Having the right tools is only half the battle—knowing how to use them effectively is what drives real results. Here are some best practices to ensure your sales analytics efforts turn raw data into actionable insights:
- Keep dashboards simple—clarity beats complexity.
- Automate repetitive tracking tasks.
- Manual data entry is not just tedious—it's error-prone. Automate routine processes like data imports, pipeline updates, and performance tracking. Automation frees your team to focus on interpreting insights and closing deals instead of maintaining spreadsheets.
- Combine quantitative data with qualitative insights.
- Numbers show what's happening, but not always why. Blend your metrics (like close rates or sales cycle length) with qualitative data such as call notes, customer feedback, or CRM activity logs. This combination helps uncover the story behind your numbers and guides smarter decisions.
- Review metrics weekly with your team in one workspace.
- Sales analytics are most effective when they drive meaningful conversations. Schedule a weekly review to look at performance trends, discuss blockers, and identify opportunities. Keeping everyone in one workspace—rather than scattered across multiple reports—ensures alignment and clarity.
- Share dashboards—not files—to avoid version issues.
- Emailing Excel sheets or PDFs around quickly creates confusion. Instead, share live dashboards through your analytics tool. Real-time access keeps everyone on the same page and ensures that decisions are made based on the latest data.
Conclusion
Sales analytics isn't just about collecting data—it's about turning that data into smarter decisions, stronger strategies, and better results. By keeping dashboards clear, automating routine tracking, blending numbers with real-world insights, and fostering team-wide visibility, your sales analytics can become a true growth engine.
If you're ready to take your analytics to the next level, Lark brings everything together in one powerful workspace. From real-time dashboards to collaborative reports and automated workflows, Lark helps sales teams stay aligned, make faster decisions, and close more deals—all without switching between tools.
FAQs
What is sales analytics and how does it work?
Sales analytics is the process of collecting, analyzing, and interpreting sales data to improve performance. It works by turning raw numbers—like revenue, deal size, and win rate—into insights that reveal patterns, trends, and opportunities. Modern sales analytics tools automate data collection, visualize key metrics in dashboards, and help teams make data-driven decisions faster.
Which metrics matter most in sales analytics?
The most valuable sales metrics depend on your goals, but common ones include:
- Conversion rate: How many leads turn into paying customers.
- Sales cycle length: The average time to close a deal.
- Average deal size: The typical revenue per sale.
- Pipeline velocity: How quickly opportunities move through your funnel.
- Customer acquisition cost (CAC): How much you spend to acquire each new customer.
What are the best sales analytics tools for small teams?
For small teams, the best tools combine simplicity, automation, and collaboration. Popular options include Lark, HubSpot, Pipedrive, and Zoho Analytics. Lark stands out because it integrates analytics, team chat, docs, and automation in one platform—so teams can track performance and take action without juggling multiple tools.
How can predictive analytics improve sales forecasting?
Predictive analytics uses historical sales data, market trends, and AI to forecast future outcomes. It can help estimate revenue, identify which leads are most likely to convert, and optimize resource allocation. By anticipating changes before they happen, sales teams can plan more effectively and stay ahead of targets.
How does Lark help teams analyze and act on sales data?
Lark centralizes your sales data in a single workspace. You can build real-time dashboards, automate data collection, and collaborate directly on insights with your team. Instead of switching between analytics tools, chat apps, and spreadsheets, Lark connects everything—helping you analyze, discuss, and decide all in one place.
Related reading
Table of contents
Start using Lark today

Manage all your work in one place
Boost team efficiency by 10x
Save up to 70% on software costs
Table of contents
Start using Lark today
Manage all your work in one place
Boost team efficiency by 10x
Save up to 70% on software costs
Keep reading









2026 Lark Technologies Pte. Ltd.
Headquartered in Singapore with offices worldwide.






Explore: