














Visualize Your Path to More Wins: The Ultimate Guide to Creating a Sales Process Flowchart

Cecilia Lane
Go-to-Market Associate
Sep 18, 2026
Cecilia Lane
Sep 18, 2026

14 min read


Does your sales team feel inconsistent? Do promising deals stall for unknown reasons while others close in record time? This lack of predictability is a common challenge, but the solution is often simpler than you think: creating a clear, visual roadmap for success. A sales process flowchart provides this clarity, transforming a collection of individual sales tactics into a single, cohesive strategy that your entire team can follow. The best teams take this a step further, building their flowcharts into dynamic, collaborative platforms where each step is linked to specific tasks, documents, and approvals. This guide will provide a comprehensive look at what a sales process flowchart is, why it's a critical asset, and how you can build one to drive efficiency and win more deals.
What is a sales process flowchart?
A sales process flowchart is a visual, step-by-step diagram that maps out the entire journey your sales team follows to move a prospect from an initial lead to a closed deal. Its primary purpose is to standardize your sales activities, define key decision points, and provide an unambiguous guide for every member of the team. Using standard symbols—like rectangles for actions and diamonds for decisions—it illustrates the flow of work and clarifies what needs to happen at every stage. While often confused with a sales funnel, which measures conversion rates, a sales process flowchart is fundamentally different. It doesn't just measure the "what"; it meticulously documents the "how," providing an actionable playbook for your team to execute consistently.

Why you need a sales process flowchart
Drive consistency and standardization
A flowchart ensures that every salesperson, from a seasoned veteran to a new hire, is following the same proven set of steps. This creates uniform and professional customer experience, reinforces best practices, and makes performance much easier to measure and manage. Everyone knows the playbook because it's clearly mapped out for them.
Accelerate onboarding and training
Imagine a new hire being able to see your entire sales motion on a single, easy-to-understand diagram. A sales process flowchart is an incredibly powerful training tool that dramatically reduces ramp-up time. By providing a clear visual guide, it helps new team members quickly grasp the workflow, key milestones, and their specific responsibilities at each stage.
Pinpoint bottlenecks and inefficiencies
When deals get stuck, a flowchart makes it easy to diagnose the problem. The visual nature of the diagram allows you to see exactly where processes are slowing down or where handoffs are failing. This clarity enables you to make targeted improvements, whether it's providing more training on discovery calls or simplifying your proposal-sending step.
Improve sales forecasting accuracy
Inconsistency kills forecasts. When every rep follows a different process, it's nearly impossible to predict deal velocity or close rates accurately. A standardized sales process flowchart creates more predictable sales cycles, which in turn provides the reliable data needed for more accurate and confident revenue forecasting.
Boost sales team productivity
A clear process eliminates guesswork and empowers your reps to focus on what they do best: selling. When the next step is always clear, they spend less time wondering what to do and more time on high-impact activities. You can even link flowchart steps to automated task creation, ensuring follow-ups never fall through the cracks.
Key elements of a sales process flowchart
To build a truly effective sales process flowchart, you need to include a few fundamental components. These elements provide the structure, detail, and clarity that transforms a simple diagram into a powerful tool for your sales team. Think of them as the essential building blocks for your visual sales playbook.
- Standard flowchart symbols: Using a consistent set of symbols is key to making your flowchart easy to read and understand at a glance. The most common symbols you'll need are:
- Ovals: These signify the start and end points of your process. For example, "New Lead Acquired" would be a starting oval, while "Deal Won" and "Deal Lost" would be ending ovals.
- Rectangles: Each rectangle represents a specific action or task that a salesperson performs. Examples include "Conduct Discovery Call," "Send Proposal," or "Update CRM."
- Diamonds: These represent questions that create a fork in the road, requiring a "yes" or "no" answer that directs the flow down different paths. Common decisions are "Is the prospect qualified?" or "Did they accept the proposal?"
- Arrows: These lines connect the other symbols, showing the direction and sequence of the workflow from one step to the next.
- Defined sales stages: These are the major phases of your sales cycle. Clearly labeling these stages on your flowchart (e.g., Prospecting, Qualification, Presentation, Negotiation, Closing) helps organize individual tasks and provides a high-level overview of the deal's progression.
- Key sales activities: These are the specific, granular tasks and interactions that occur within each stage. A good sales process flowchart details these activities, such as "Send initial outreach email," "Schedule a demo," or "Send follow-up #1," leaving no room for ambiguity.
- Roles and responsibilities: For teams where multiple roles are involved in the sales cycle (like SDRs and Account Executives), a "swimlane" flowchart is invaluable. This format divides the chart into horizontal or vertical lanes, with each lane assigned to a specific role, clearly showing who is responsible for each action and where handoffs occur.
- Entry and exit criteria: This is the logic that governs movement between stages. For each stage in your flowchart, you should define the specific conditions that must be met before a deal can officially move to the next one. For example, the exit criteria for the "Qualification" stage might be "Budget, Authority, Need, and Timeline (BANT) confirmed."
Step-by-step guide to mapping your sales process flowchart
Step 1: Assemble your team
Your sales process shouldn't be defined in a silo. Gather input from your key stakeholders, including top-performing sales reps who know what works, sales leadership for strategic oversight, and even a representative from marketing to ensure alignment on lead handoffs. Capturing these initial thoughts in a shared online document or on a digital whiteboard ensures everyone's ideas are heard.
Step 2: Define your start and end points
Every process needs a clear beginning and end. Determine the specific event that officially kicks off your sales process. Is it when a lead fills out a form on your website? Or when an SDR adds a new prospect to a sequence? Equally important, define all possible outcomes, which are typically "Deal Won," "Deal Lost," or perhaps "Nurture for Future."
Step 3: List every action and decision
This is the brainstorming phase. Working with your team, list every single task, conversation, email, and decision point that happens during your current sales cycle. Don't worry about order at this point—just focus on capturing a comprehensive inventory of all activities, from the first touchpoint to the final signature.
Step 4: Sequence the stages and activities
With your complete list of activities, begin organizing them chronologically. Group related tasks into the logical sales stages you defined earlier (e.g., Qualification, Proposal). This step starts to bring structure to your brainstormed list and forms the backbone of your sales process flowchart.
Step 5: Draw the flowchart
Using the standard symbols, visually map out the sequence you've just created. You can start with a physical whiteboard to allow for easy adjustments, or use a digital flowcharting tool. Connect each step with arrows to show the flow, and use diamond shapes for any point where a decision must be made that alters the path forward.
Step 6: Incorporate alternate paths and loops
A successful sales process flowchart accounts for reality. Not every deal moves smoothly from one step to the next. Map out what happens when a prospect says "no" at a decision point. What is the process for re-engaging a prospect who has gone cold? These alternate paths and follow-up loops are what make the flowchart a truly practical and valuable tool for your reps.
Step 7: Review, refine, and distribute
Share the first draft of your sales process flowchart with the entire sales team and solicit feedback. Does it accurately reflect how they work? Are there any missing steps or inefficiencies it highlights? After refining it based on this feedback, finalize the flowchart and distribute it, making sure it's stored in a central, easily accessible knowledge base for everyone to use as their guide.
How to use Lark to create a successful sales flowchart template
A sales process flowchart is most effective when it's a living, accessible, and actionable document—not a static image saved in a forgotten folder. A comprehensive platform like Lark provides the perfect environment to not only build your flowchart but to integrate it directly into your team's daily operations. Here's how you can leverage its unique features to create a truly successful template.
Built-in flowcharts in Lark Docs
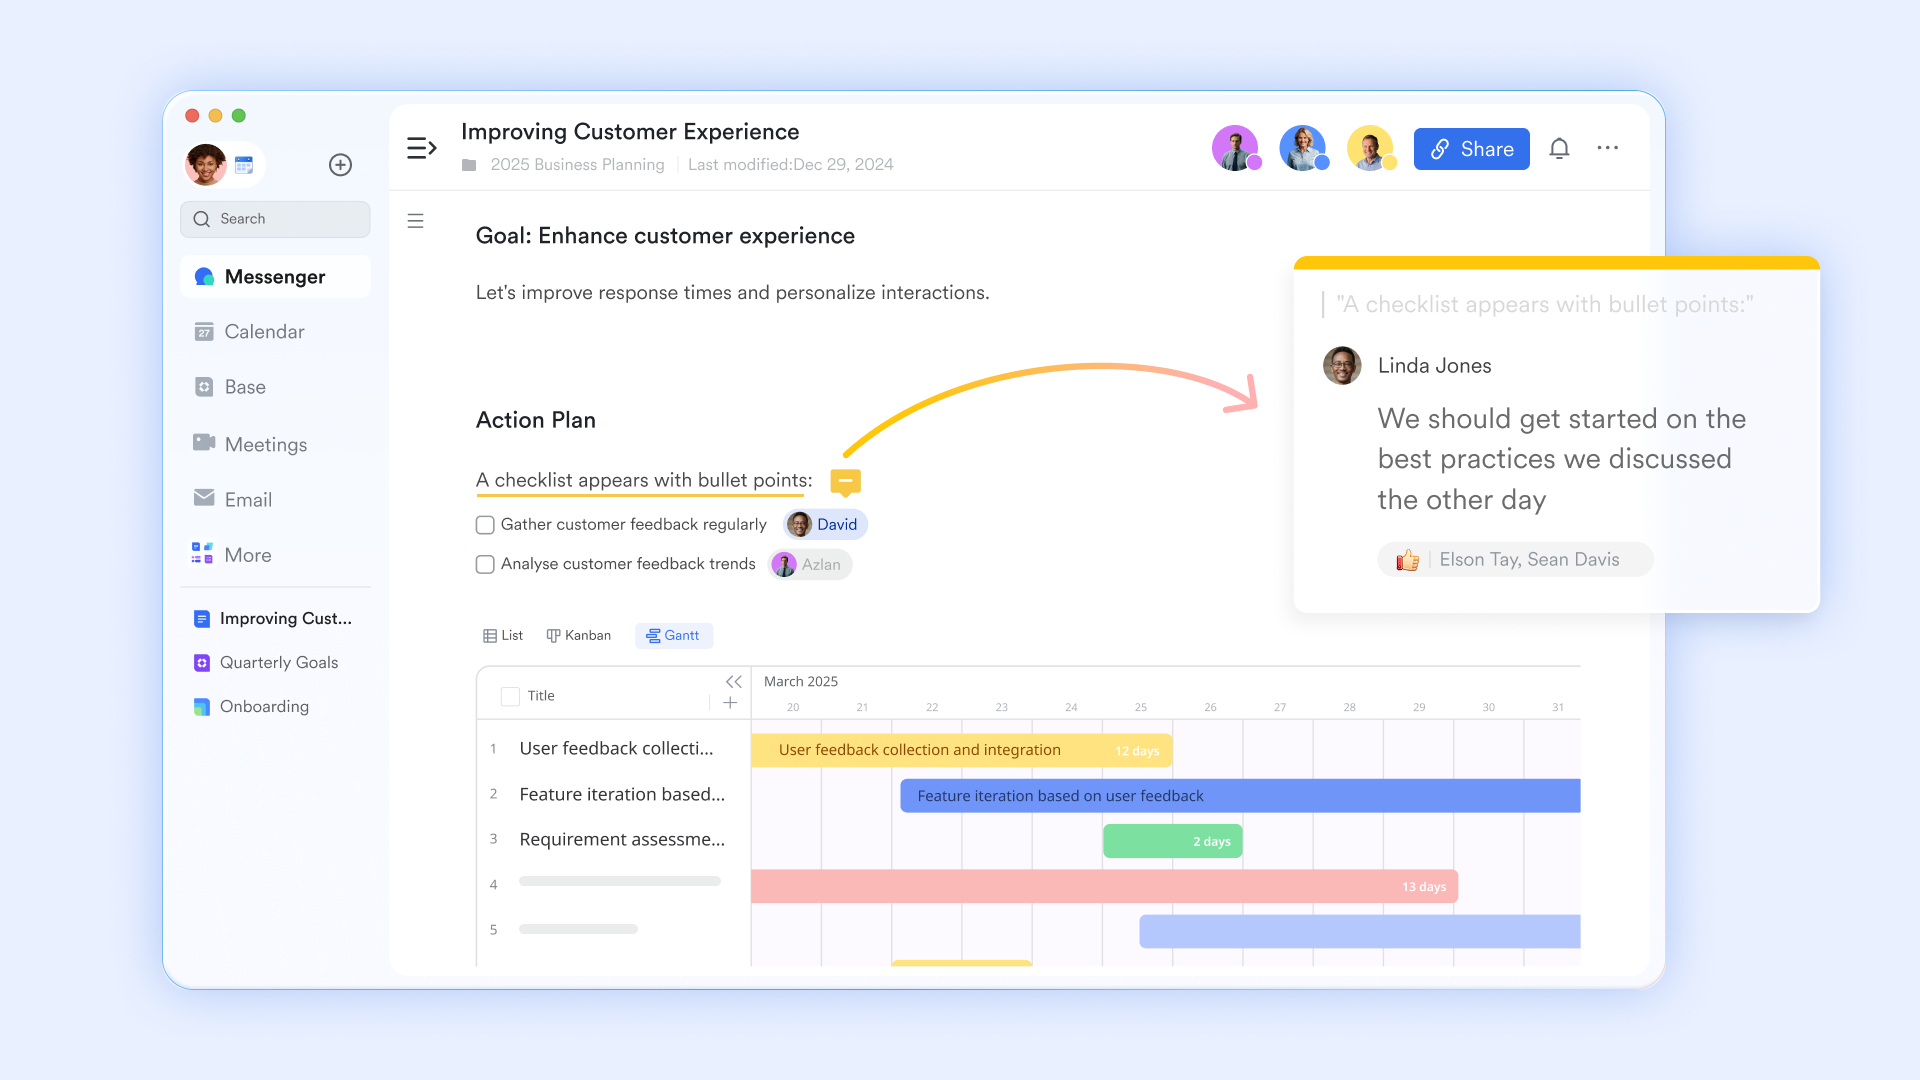
The first step to making your sales process flowchart useful is ensuring your team can actually find it. With Lark Docs, you can build your flowchart directly within your central sales playbook, team wiki, or onboarding materials. Instead of attaching a separate file, the flowchart becomes an embedded, native part of your documentation. This guarantees that everyone is always referencing the most current version, eliminating confusion and ensuring your standardized process is always front and center.
Rich collaborative environment
Creating the perfect sales process flowchart is a team effort, and Lark is built for real-time collaboration. You can share a single document with your entire sales team and build the flowchart together. Team members can drop comments directly onto specific steps, @-mention a sales manager for approval on a new stage, or suggest changes that can be discussed and resolved in the same interface. This collaborative creation process ensures the final flowchart is practical, accurate, and has buy-in from the people who will be using it every day.
Diverse elements for creation
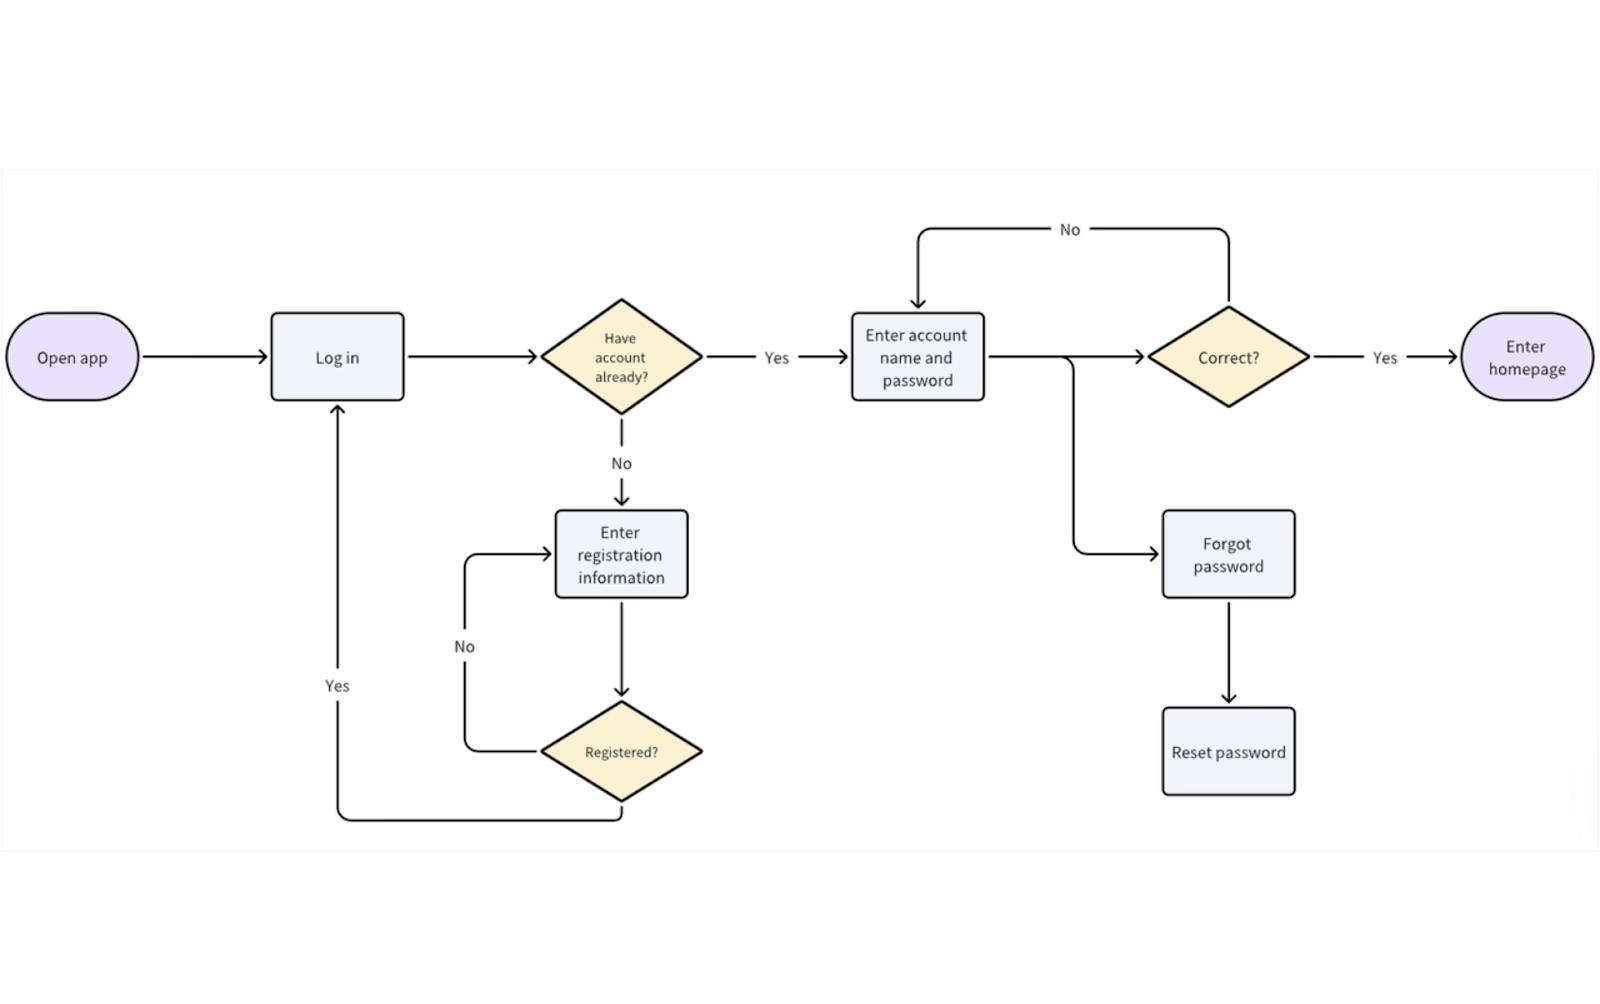
You don't need a separate, specialized diagramming tool to create a professional-looking flowchart. Lark Docs provides a rich set of built-in elements that make the process simple and intuitive. You can easily add and customize standard flowchart shapes (like rectangles for process steps and diamonds for decisions), connect them with arrows, and add text boxes for detailed descriptions. This allows you to design a clear, color-coded, and easy-to-read sales process flowchart without ever leaving your primary workspace.
Pre-built templates
To accelerate your work, you can start with a template. A flowchart is a visual representation of a process or workflow, breaking down each step into a series of shapes and arrows. This format is crucial for clarifying any process important for workflows or decision-making. Lark offers a rich library of templates that allow you to create a flowchart for any specific need, from a complex B2B sales cycle to a simple lead qualification path. By visually mapping out each step using a template, you can more easily identify bottlenecks, streamline processes, and improve overall efficiency. For instance, the Flowchart Template provides a perfect foundational structure, allowing you to simply customize the pre-defined stages to fit your unique sales motion.
Lark Base for workflow management
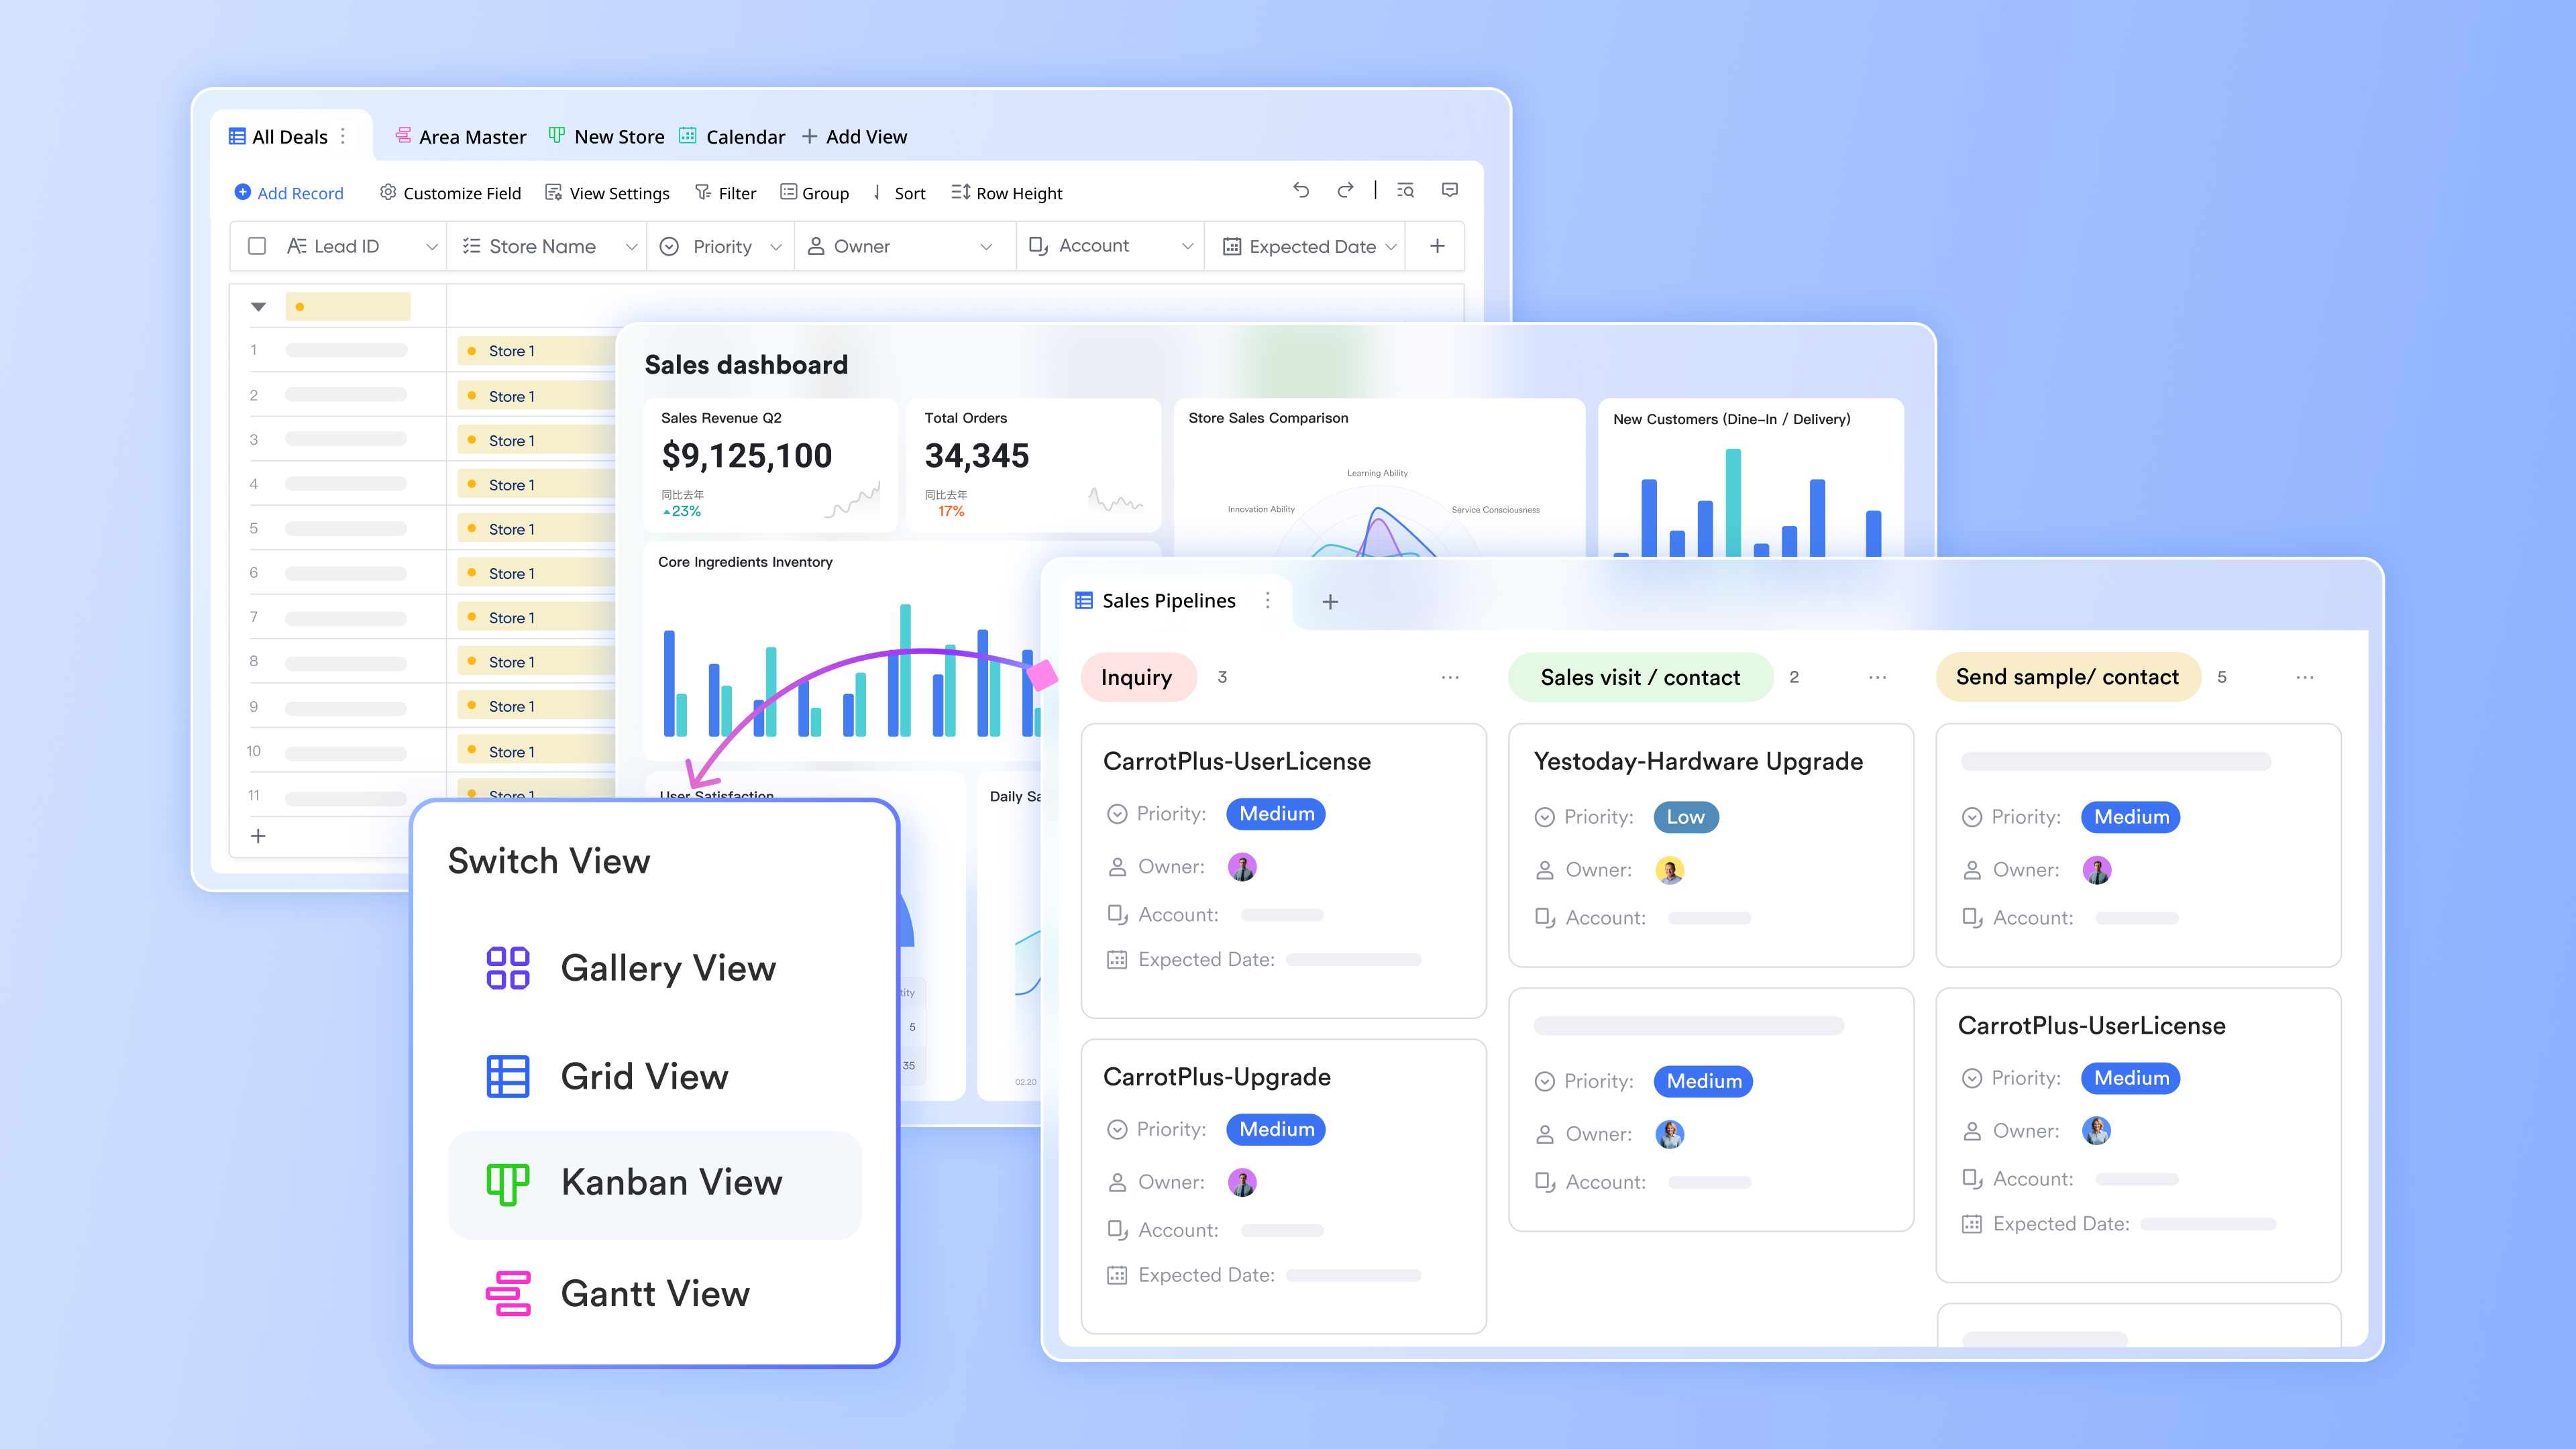
This is where your flowchart transforms from a static diagram into a dynamic, actionable tool. You can use Lark Base, a powerful and flexible database tool, to manage your entire sales pipeline. Each step in your visual flowchart can correspond to a stage or field in a table. When a salesperson updates a deal's status in the Base—for example, from "Qualification" to "Proposal Sent"—it can automatically trigger a workflow, create a new task for follow-up, and notify the sales manager. By connecting your flowchart's logic to Lark Base, you turn your process map into a living, automated engine that drives your sales team forward.
Pricing advantage
One of the most compelling aspects of using Lark is its incredible value. Instead of paying for separate subscriptions for a diagramming tool, a document collaboration platform, a task manager, and a database solution, you get all of this functionality within a single, cost-effective platform. The robust free tier allows even small teams to build a sophisticated sales process flowchart and workflow management system without any initial investment, making it an accessible and scalable solution for businesses of any size.
Conclusion
A sales process flowchart is far more than just a diagram; it's a strategic blueprint for consistency, efficiency, and scalable growth. By visually mapping out every step, decision, and action from lead to close, you empower your team with the clarity and confidence needed to perform at their best. This visual guide ensures that best practices are followed, new hires are onboard faster, and your entire sales motion becomes more predictable. Remember that your flowchart should be a living document, revisited and refined as your team discovers new, better ways to win. To truly bring this process to life, consider building it within a collaborative platform like Lark, where your flowchart can connect directly to your team's tasks, documents, and workflows.
FAQs
What are the 7 steps of the sales process?
The classic 7-step sales process is a widely recognized framework that includes: 1. Prospecting, 2. Preparation, 3. Approach, 4. Presentation, 5. Handling Objections, 6. Closing the Deal, and 7. Follow-up. A sales process flowchart is the perfect tool to visually map out the specific actions your team should take within each of these stages.
What is the 5 steps sales process?
A 5-step sales process is a more condensed but equally valid model that simplifies the sales cycle. It typically consists of: 1. Prospecting & Lead Generation, 2. Qualification, 3. Presentation or Demo, 4. Closing, and 5. Nurturing & Retention. This streamlined approach is often used for sales cycles that are less complex.
What is the 7 touch process in sales?
The "7 touch process" refers to a prospecting and follow-up strategy, not the entire sales process itself. It's based on the marketing principle that it takes an average of seven interactions (or "touches") with a prospect before they are ready to buy. These touches can include emails, phone calls, and social media engagement, and they should be mapped as specific tasks within your larger sales process flowchart.
What is the basic sale workflow?
The basic sale workflow is the fundamental sequence of activities that moves a potential customer from awareness to a closed deal. It can be simplified to four core phases: 1. Identify potential customers, 2. Qualify their needs and fit, 3. Present your solution, and 4. Close the sale. Using a collaborative platform like Lark allows you to not only create a flowchart of this workflow but also manage it with connected tools like a CRM database and automated task assignments.
Related reading
Table of contents
Start using Lark today

Manage all your work in one place
Boost team efficiency by 10x
Save up to 70% on software costs
Table of contents
Start using Lark today
Manage all your work in one place
Boost team efficiency by 10x
Save up to 70% on software costs
Keep reading









2026 Lark Technologies Pte. Ltd.
Headquartered in Singapore with offices worldwide.






Explore: