Every project manager has experienced the frustration of watching a deadline slip because of one overlooked dependency. A task that seemed minor suddenly blocks the entire timeline, pushing delivery further out than expected. In most cases, the issue is not effort or intent, but visibility into how work is truly connected.
The Gantt chart critical path exists to solve this problem by showing which tasks directly control the project finish date. It helps teams focus on work that cannot afford to move, while allowing flexibility elsewhere. As projects grow more complex and more collaborative, many teams begin looking for ways to keep this logic visible and up to date. Platforms like Lark support this shift by connecting schedules, tasks, and communication, so critical path awareness stays part of everyday work rather than a static planning exercise.
What is the critical path in a Gantt chart?
The critical path in a Gantt chart—one of the most widely used features in —represents the longest chain of dependent tasks that determines the shortest possible project duration. Every task on this path must be completed on time for the project to meet its final deadline. Even a one-day delay in any of these tasks will push the entire schedule forward.
In a visual Gantt chart, critical tasks are connected through dependency lines that show how work flows from start to finish. Some tasks have flexibility and can move without affecting delivery, but tasks on the critical path have no slack at all. They form the structural backbone of the. If this backbone is disrupted, the whole schedule is affected.
Gantt chart vs critical path method: How they work together
It's common to hear "Gantt chart" and "Critical Path Method" (CPM) used interchangeably, but they are actually two different tools that work best when paired together.
- The Critical Path Method (CPM): CPM calculates the earliest start, the latest finish, and the task floats using dependency logic. It determines the shortest project duration mathematically. Without CPM, Gantt charts are only timelines without intelligence.
- The Gantt Chart: This is the of that logic. It plots the tasks against a calendar, so you can see the critical path of Gantt chart data in a way that's easy for humans to digest.
When you combine critical path analysis and Gantt chart visuals, you get a roadmap that tells you not just what needs to be done, but which tasks are the most dangerous to ignore.
Discover how critical paths stay visible
How to identify the critical path in a Gantt chart
Finding the critical path in Gantt chart views doesn't require a PhD in mathematics. It just requires a disciplined look at how your tasks interact.
Step 1: List all activities
Before you can find the path, you need the map. List every single task required to complete the project. Use a project task list to ensure nothing from high-level coding to minor administrative sign-offs is left out. Every project task must be accounted for to ensure the math stays accurate.
Step 2: Establish dependencies
This is the most crucial part of critical path analysis: creating a Gantt chart. Identify which tasks are "Finish-to-Start." For example, you cannot "Install the Roof" until you have "Built the Walls." By linking these dependencies, you create the chain that the critical path will follow.
Step 3: Calculate duration
Estimate the time required for each individual task. Be realistic. If you underestimate the duration of a task on the critical path of the Gantt chart, your entire project will be doomed to run late before it even starts.
Step 4: Determine the "Longest Path"
Trace the sequences of dependent tasks from the start date to the end date. The sequence with the longest total duration is your Gantt chart critical path. Most modern will highlight this path in red automatically once you've set up your dependencies.
Limits of traditional Gantt charts for critical path tracking
While the critical path method Gantt chart approach is powerful, traditional tools like Excel or static PDF charts have major limitations:
- Stale data: If a task takes two days longer than expected, a static chart won't update the rest of the timeline automatically.
- Invisible dependencies: In complex projects, it's easy to miss a link, leading to a "broken" critical path that gives you a false sense of security.
- : When the critical path on a Gantt chart changes, the team often doesn't find out until the weekly meeting, which is usually too late.
Overcome limits in critical path tracking with experts
New option: Try Lark to turn the critical path live and visible
Traditional project management often fails because it treats the critical path as a static drawing rather than a living, breathing workflow. bridges this gap by unifying your project data directly into the communication tools your team uses every day. Instead of toggling between disconnected apps, you get a unified environment where schedules, tasks, and chats live in perfect sync. By transforming rigid diagrams into dynamic systems, Lark ensures that every shift in your is immediately visible and actionable.
Manage tasks and critical paths in a Gantt chart
Lark Task allows users to map and automatically calculate the Critical Path. In the Gantt view settings, you can enable "Highlight critical path" to highlight the longest sequence of essential tasks, marking the project's most time-sensitive bottlenecks. The tool also features active dependency management ("Maintain buffer" or "Consume buffer"), which can automatically adjust the schedules of linked tasks to maintain or consume time buffers as project dates shift. This ensures that the overall project deadline remains realistic and visible as individual tasks are updated. 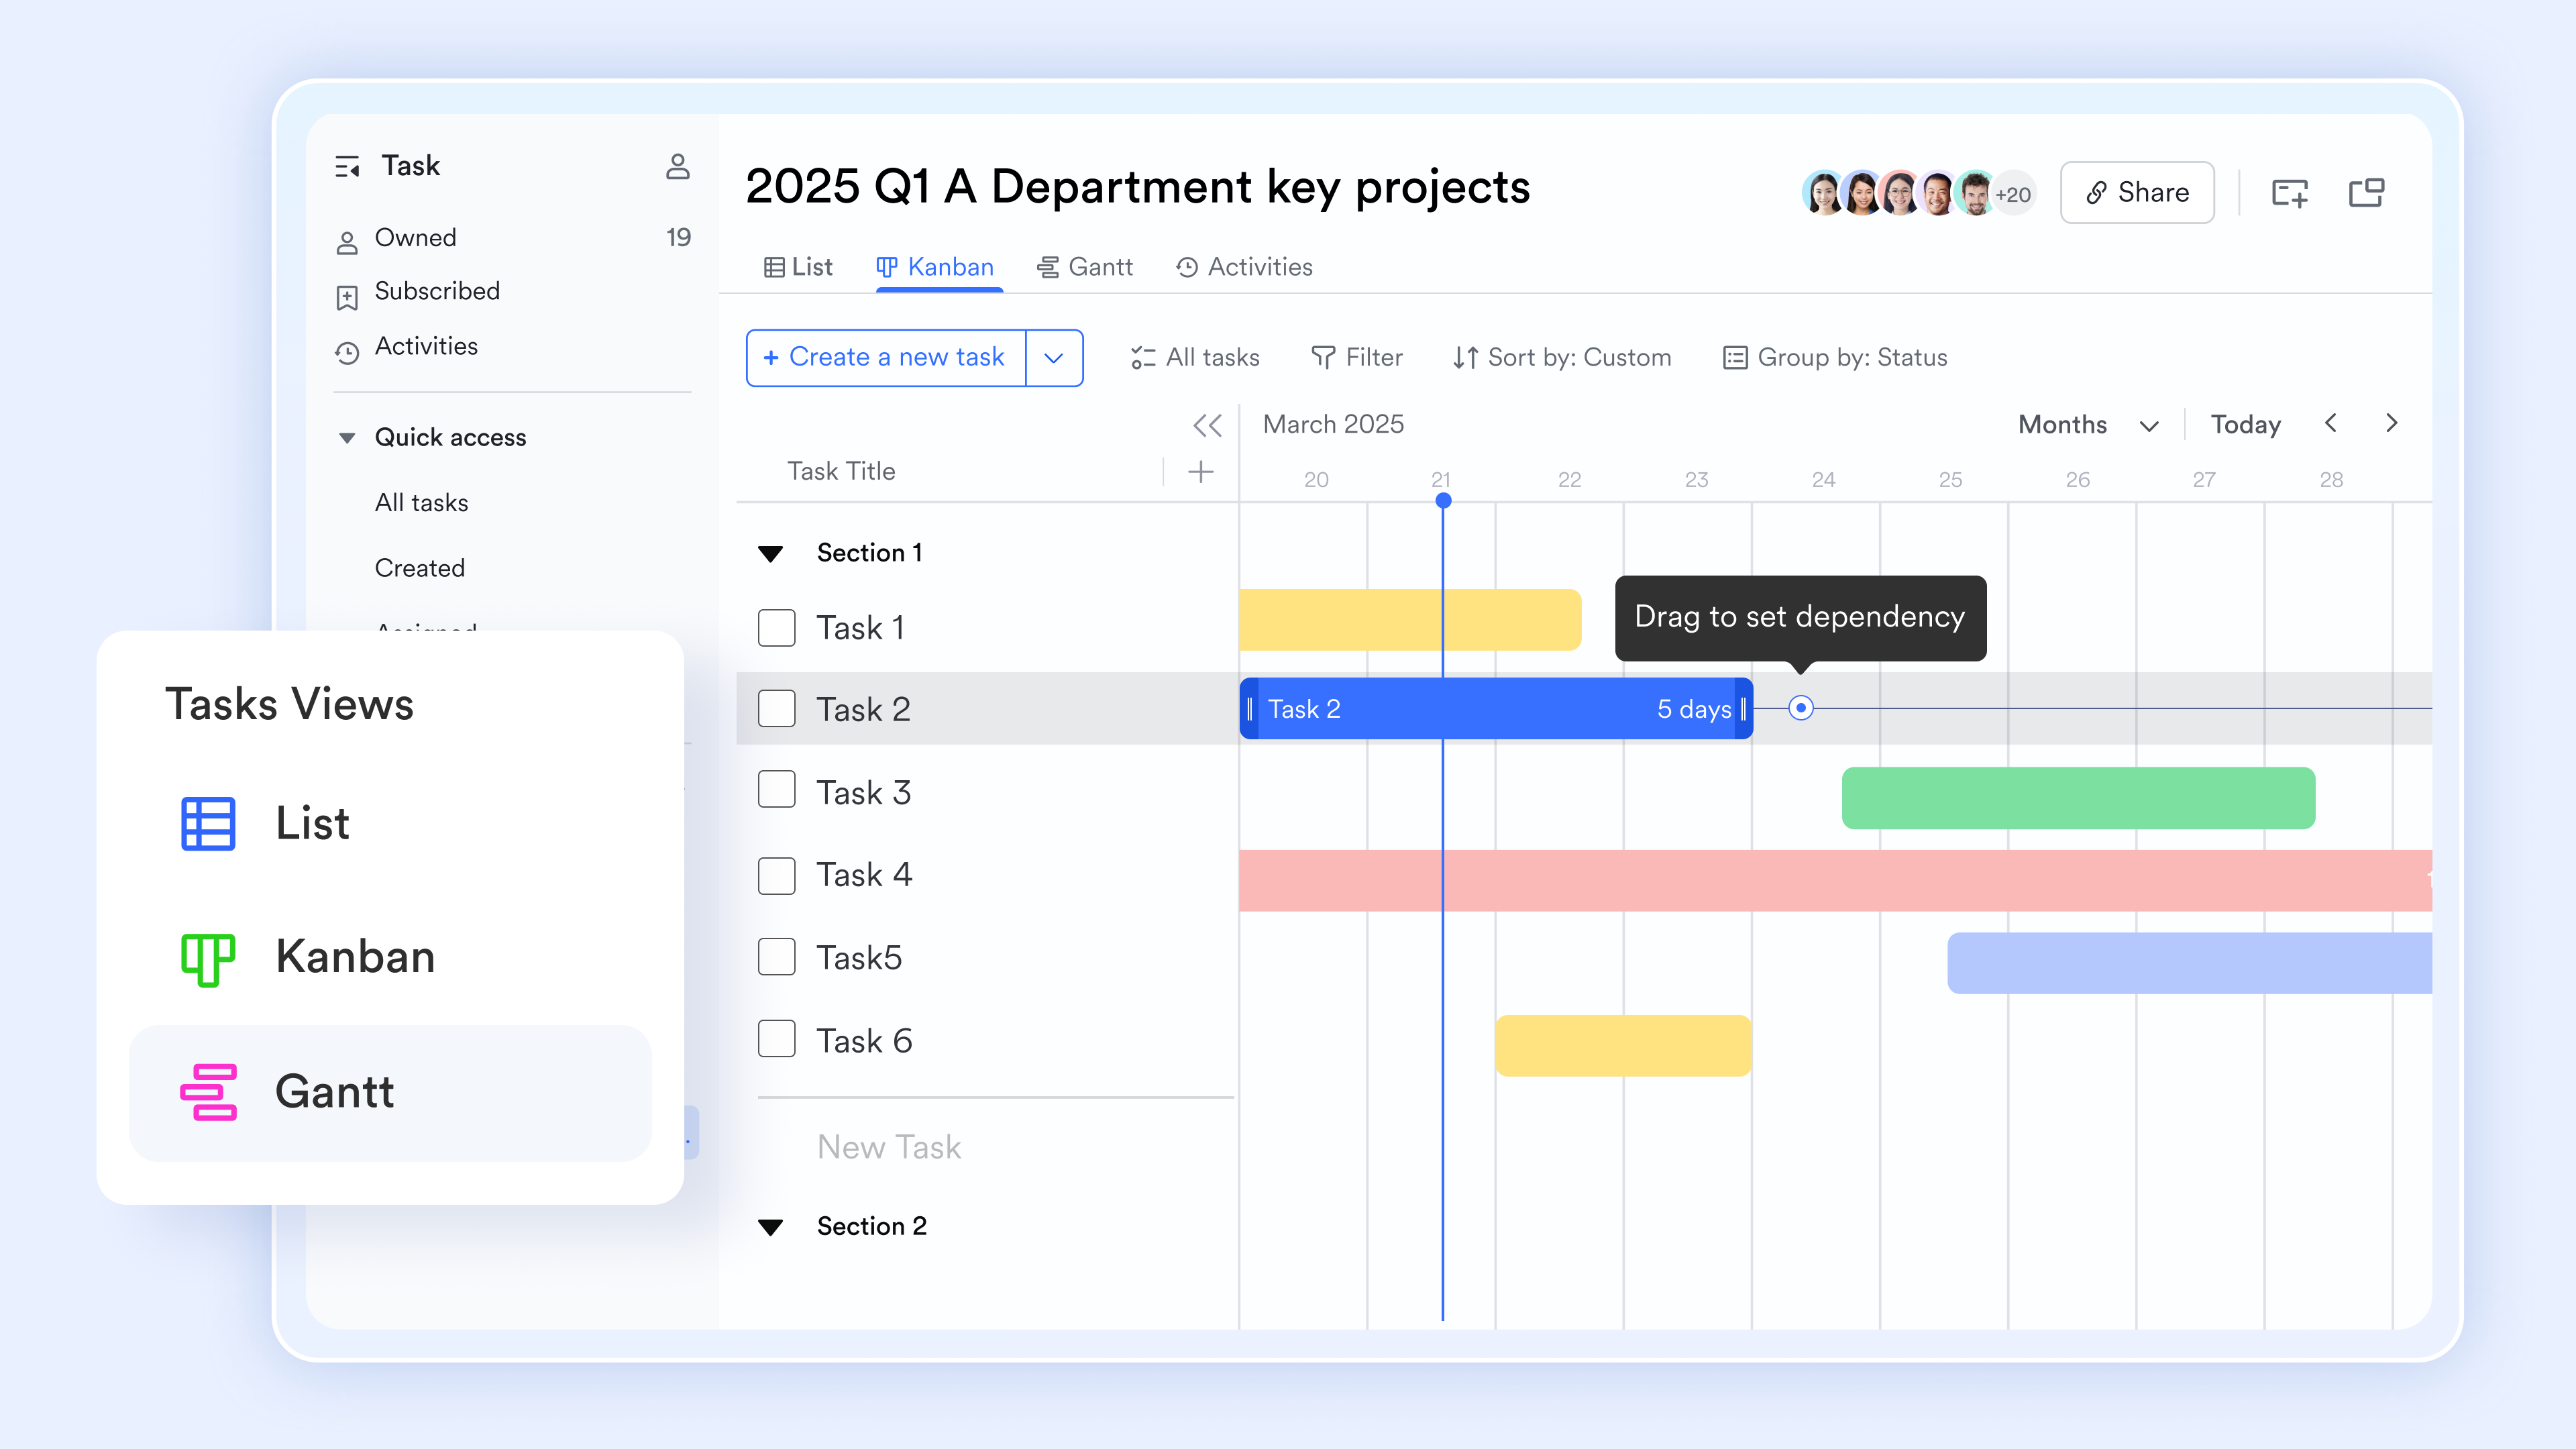
Map out your projects within a Gantt view
Lark Base's Gantt view helps map out projects by automatically transforming date fields into a visual timeline, allowing schedules to be managed via intuitive drag-and-drop editing. enhances project clarity through customizable color-coding and , allowing teams to highlight key deadlines and categorize tasks by status or owner. By configuring custom working days, you can ensure the project map accurately reflects realistic timelines by excluding non-working days. 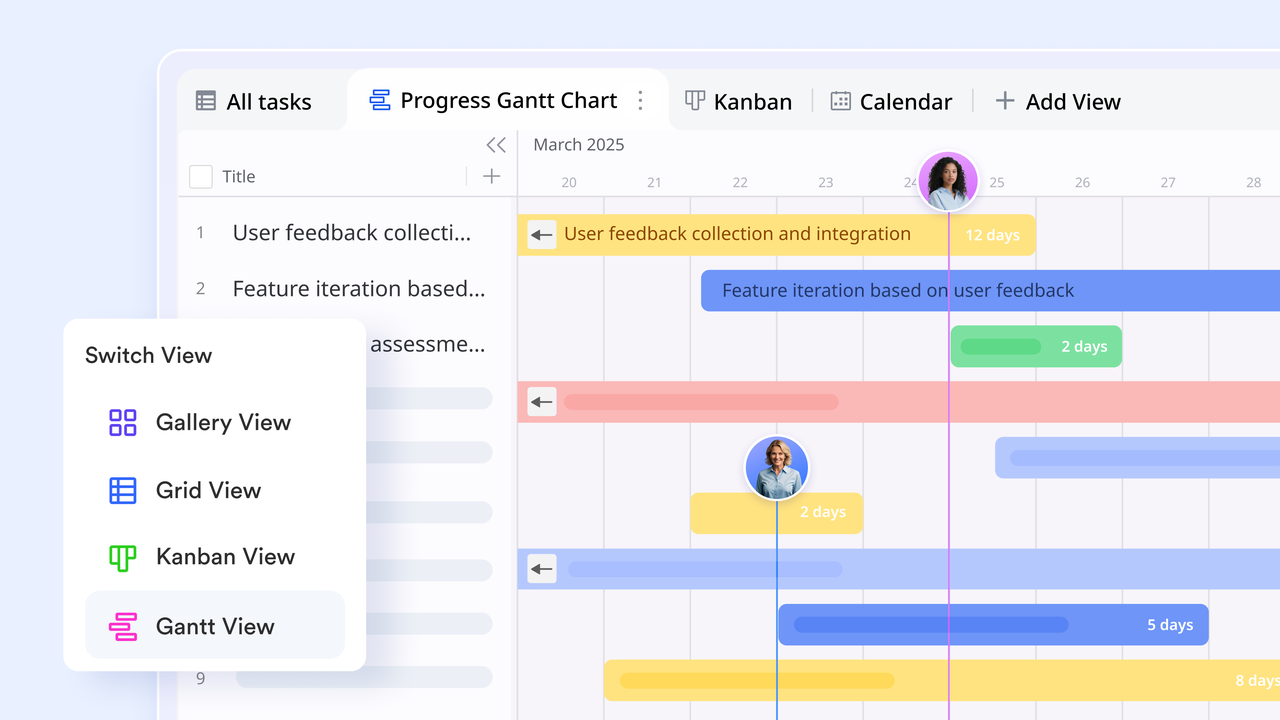
Visualize your project timelines with collaboration
streamlines project management with the timeline add-on and real-time co-editing. You can easily insert Gantt charts from Lark Base or Lark Tasks or chronological timelines using the "+" icon or slash commands and track progress. Simultaneously, team members can collaborate in the same document through live editing, @mentions, and threaded comments to ensure everyone stays aligned. This centralized approach allows your team to manage schedules and documentation side-by-side without switching apps. 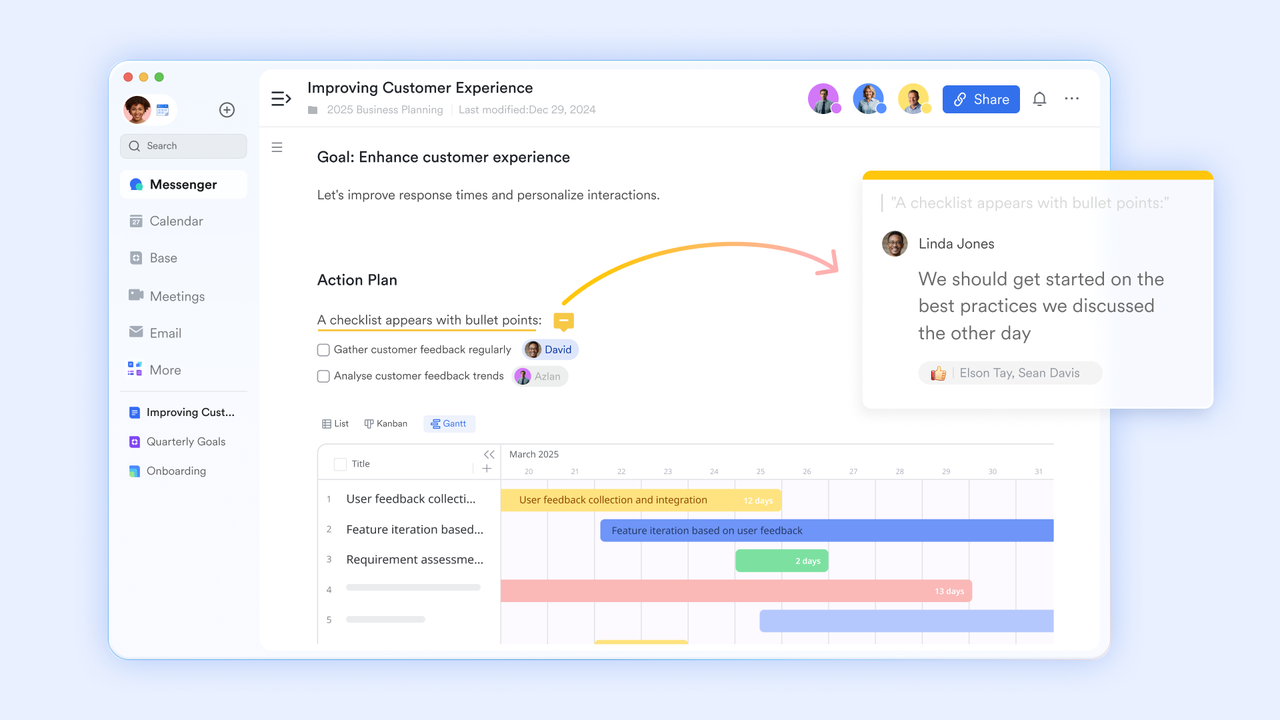
Momentum building: Automated successor notifications
To ensure your project's most time-sensitive tasks stay on schedule, you can set up Lark Base automation for seamless task completion. Try out a trigger, like "when a record updates" or "when a new or updated record matches conditions," specifically targeting the "Status" or "Progress" field of a critical task. For example, once a predecessor task is marked as "Completed," you can automate a notification to the owner of the next task in the sequence via . 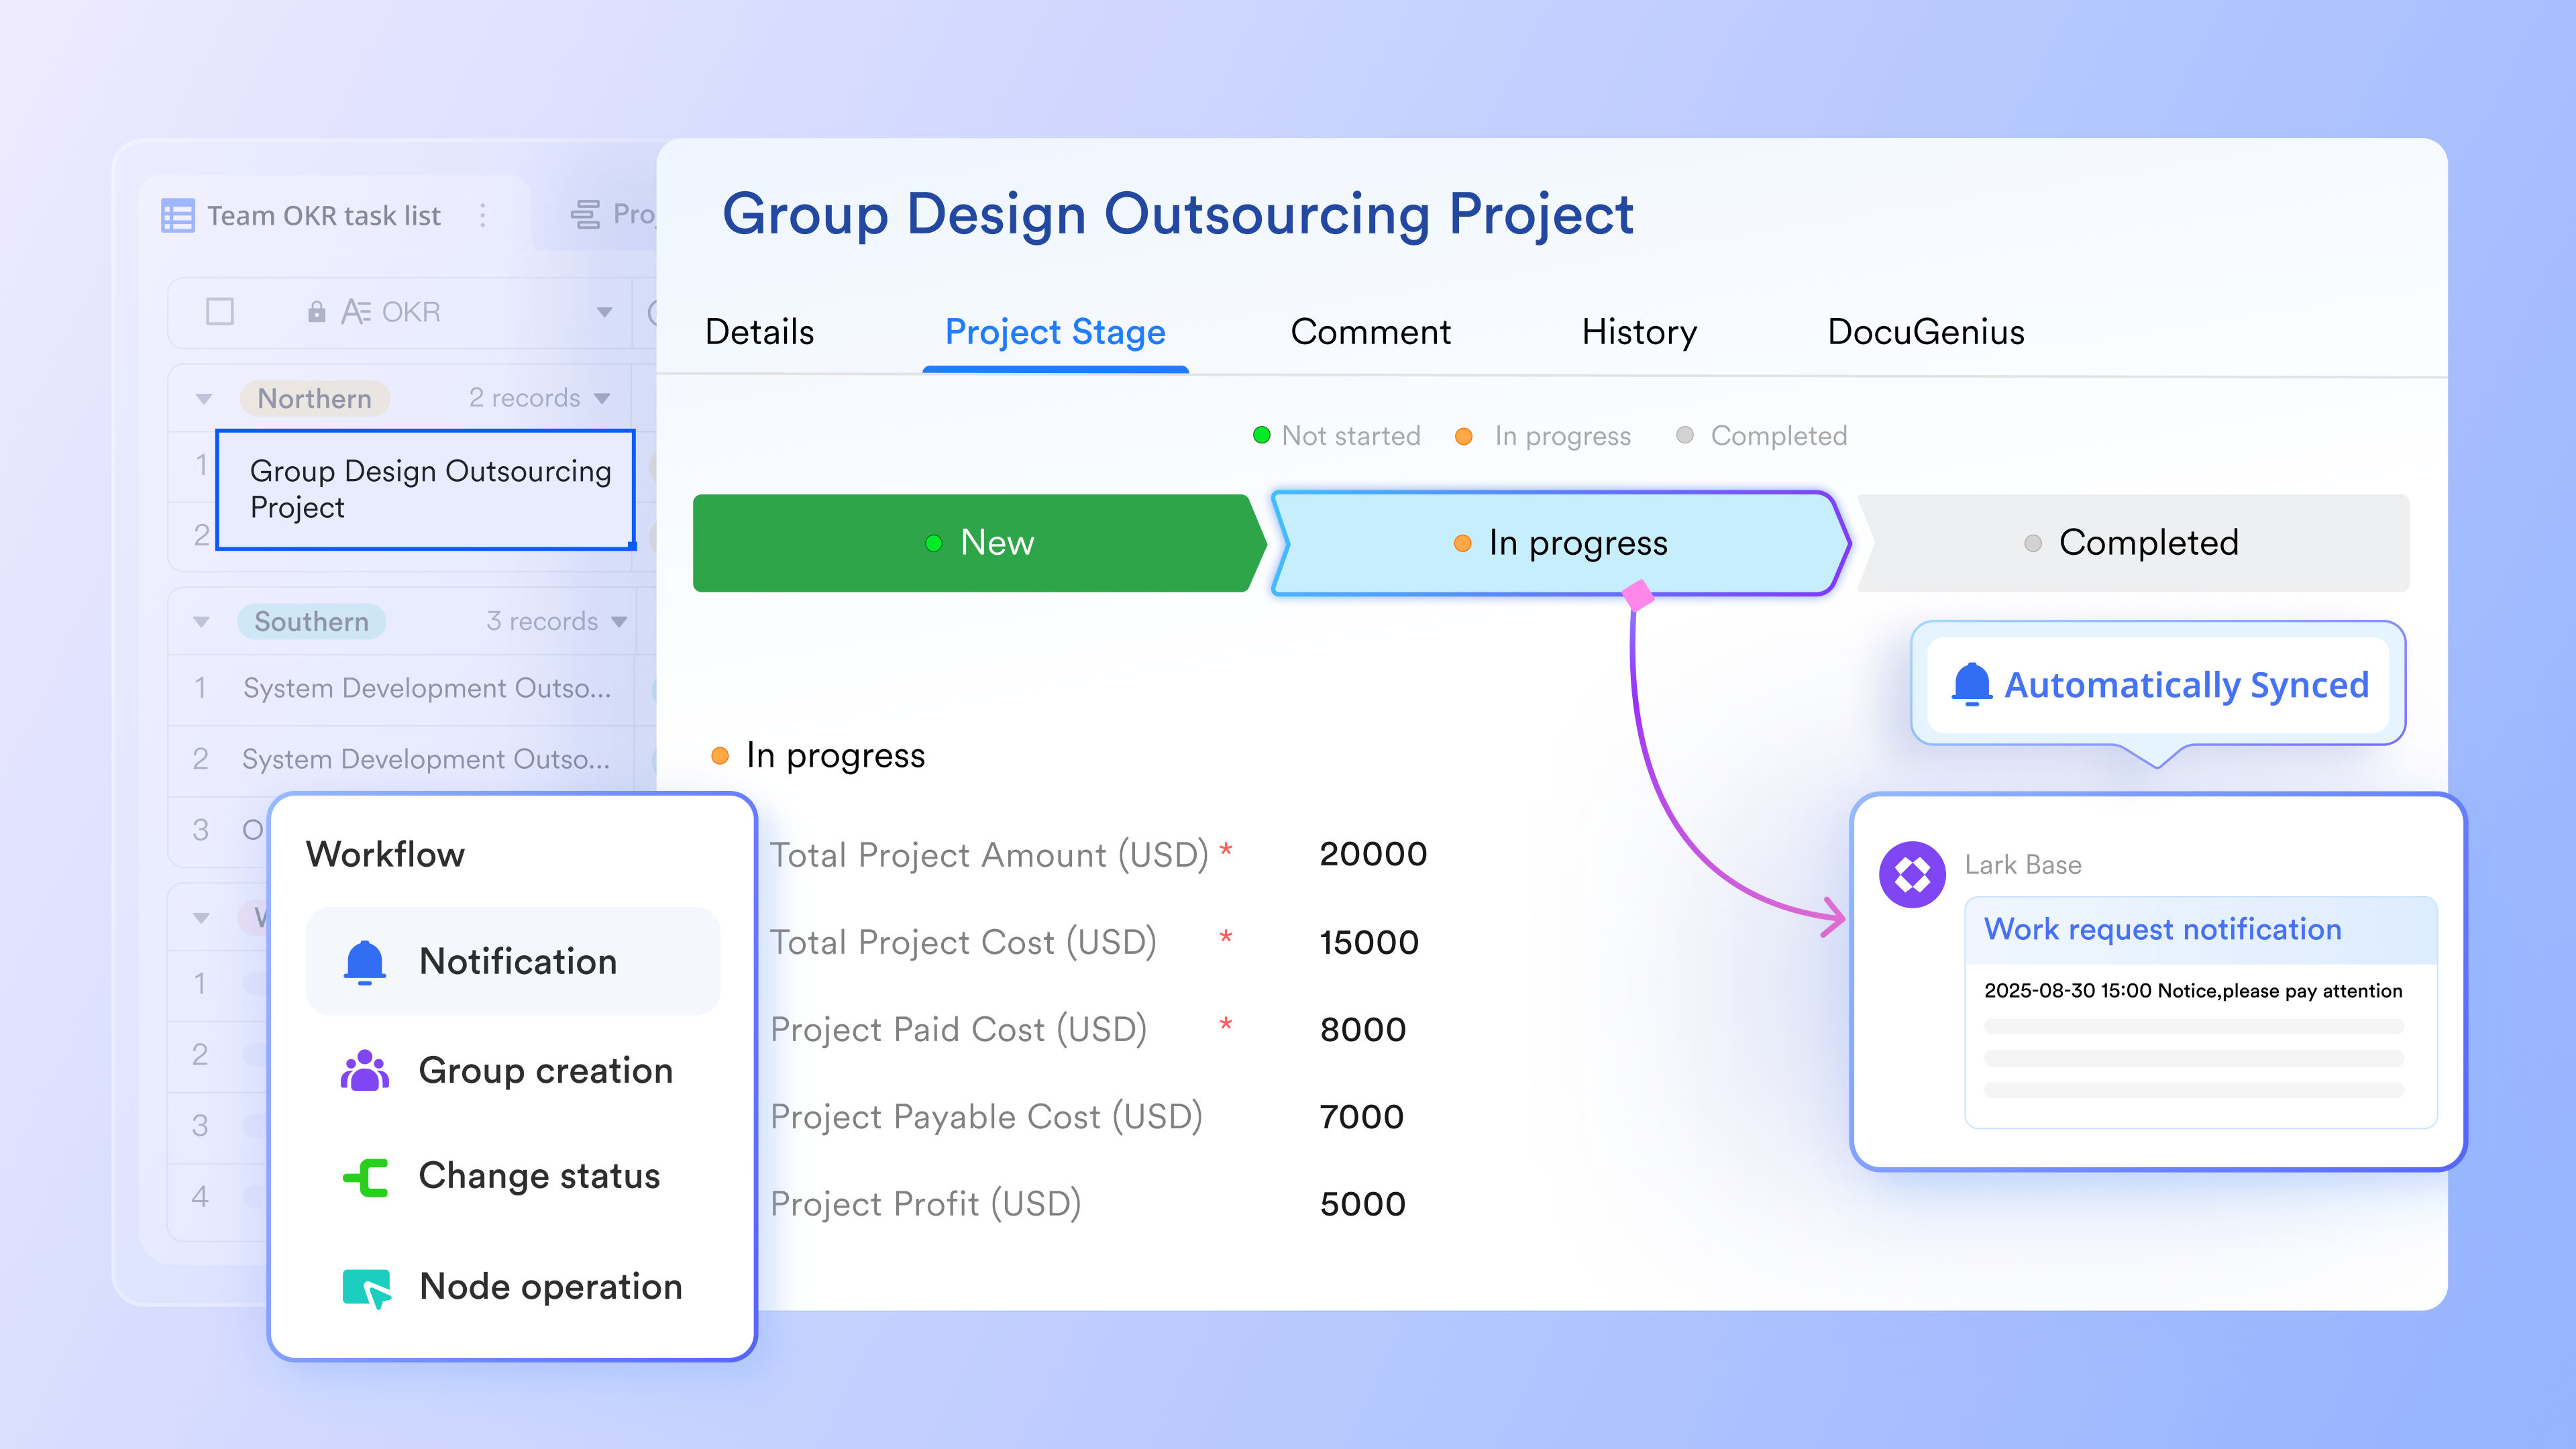
:
- Starter plan: Free forever plan that includes 11 powerful tools for up to 20 users. It also comes with 100GB of storage, 1000 automation runs, AI translations, and more.
- Pro plan: $12/user/month (billed annually) for up to 500 users. It includes everything in Starter plus group calling for up to 500 attendees, 15TB of storage, 50,000 automation runs, and more.
- Enterprise plan: for custom pricing. Supports unlimited users and includes even more automation runs and advanced security, compliance, and management features.
For small teams with simple communication needs

18 months message history
1000 Base automation runs/month
2000 rows per table in Base
Most POPULAR
For companies with comprehensive collaboration and management needs
Unlimited message history
500-participant video meetings
50k Base automation runs/month
20k rows per table in Base
For large companies with advanced security and organizational management needs
Get a personalized demo and pricing
Unlimited message history
500-participant video meetings
15 TB storage + 30 GB storage/user
500k Base automation runs/month
50k Base automation runs/month
Most POPULAR
For companies with comprehensive collaboration and management needs
Unlimited message history
500-participant video meetings
50k Base automation runs/month
20k rows per table in Base
Ready-to-use templates that turn plans into action in Lark
Choosing the right template reduces setup time and improves schedule accuracy from the start. Well-structured templates help teams apply Gantt charts and critical path analysis without building everything from scratch. Each template below supports a different stage of planning, execution, or tracking while keeping dependencies clear and manageable.
Gantt chart project management template
This template helps teams build a clear with dependencies already structured. Tasks, durations, and relationships are easy to define without manual formulas. The critical path on a Gantt chart is highlighted automatically once dependencies are set. Teams can quickly see which tasks affect the final delivery date. This makes Gantt chart critical path analysis easier to maintain as plans evolve.
Project portfolio management template
Managing multiple projects often introduces hidden dependency risks. This template allows teams to track several Gantt charts in one view while monitoring shared resources. It helps identify where the critical path of Gantt chart schedules overlaps across projects. Managers gain visibility into cross-project risks early. This supports better prioritization and workload balancing.
Product development progress management template
Product development timelines change frequently as requirements evolve. This template supports flexible updates while preserving dependency logic. Teams can adjust task durations and immediately see how the critical path in Gantt chart views shifts. It helps product managers balance speed and stability. This makes critical path analysis and Gantt chart planning more reliable for iterative work.
Project tracker template
This template focuses on visibility and status tracking. It highlights progress against planned dates and flags deviations quickly. Teams can monitor how delays affect the critical path of Gantt chart schedules. Stakeholders get a clear snapshot without reviewing the full plan. This supports faster decision-making during execution.
Risk assessment template
Risks often materialize directly on the critical path. This template helps teams document and monitor risks tied to key tasks. It supports better critical path analysis Gantt chart outcomes by linking risks to dependencies. Teams can plan mitigations before delays occur. This reduces last-minute schedule shocks.
Common mistakes teams make with Gantt chart critical paths
Understanding the theory of the critical path is one thing, but maintaining it during a live project is where most teams stumble. Avoiding these common pitfalls ensures your timeline remains a reliable tool rather than a source of confusion for your business planning.
- Treating the critical path as fixed: The Gantt chart critical path is a living thing. If a non-critical task (one with slack) gets delayed long enough, it can become part of the critical path. You must re-evaluate your path weekly.
- Overloading the schedule with false precision: Adding too many tiny tasks (like "Check email") into your critical path analysis and Gantt chart makes the path hard to read. Stick to "milestone-moving" tasks to keep your clear.
- Ignoring communication and ownership: Knowing the critical path of Gantt chart data is useless if the person owning the critical task doesn't realize how important they are. Use Lark's @mentions to ensure "Path Owners" stay aligned within your space.
- Neglecting resource constraints: A common error is assuming that a task can be completed simply because the "logic" allows it, without checking if the person assigned is already at 100% capacity. This is known as "resource contention." If two tasks on the critical path in the Gantt chart views require the same specialist simultaneously, your path is technically impossible. You must balance the schedule against actual human availability to keep the path realistic.
- Failing to document external dependencies: Teams often only include tasks they control, forgetting that external factors like a client's 48-hour approval window or a vendor's shipping time are also part of the Gantt chart and critical path analysis. If these external "wait states" aren't explicitly linked in your Gantt chart, your critical path will consistently show an earlier (and incorrect) completion date than what is actually possible.
Conclusion
Mastering Gantt chart critical path analysis changes how teams think about delivery. Instead of reacting to missed deadlines, teams understand exactly which tasks determine success and why. The critical path of the Gantt chart schedule becomes a decision-making tool rather than a reporting artifact.
Modern execution requires more than static diagrams. Teams need live visibility, enforced , and immediate communication. supports this shift by connecting the Gantt chart and critical path analysis directly to daily work. Schedules stay accurate, risks surface early, and momentum is preserved. When teams treat the critical path as a living system, on-time delivery becomes predictable rather than hopeful.
Schedule your projects and turn action into results
FAQs
Does the Gantt chart show critical path?
Yes, most modern project management software can highlight the critical path directly on a Gantt chart. While a basic Gantt chart only shows task durations and schedules, enabling the "Critical Path" view typically changes the color of specific bars (often to red). This visual distinction allows project managers to see exactly which sequence of dependent tasks determines the earliest possible completion date for the entire project.
How to make a Gantt chart with critical path?
To create one, first list all project tasks, their durations, and their logical dependencies (which tasks must finish before others start). Use a tool like Microsoft Project, Smartsheet, or Excel to plot these tasks onto a timeline. Once the dependencies are linked, toggle the "Critical Path" or "Network Diagram" setting in your software; the system will then automatically calculate the longest chain of events and highlight it on your chart.
How do you identify the critical path?
The critical path is identified by finding the longest continuous sequence of tasks from the start to the end of a project. You can do this manually using the Precedence Diagramming Method, where you calculate the "float" or "slack" for each task—which is the amount of time a task can be delayed without affecting the deadline. Tasks with zero float are on the critical path, meaning any delay in these specific items will immediately push back the project's finish date.
Does every Gantt chart have a critical path?
A Gantt chart only has a critical path when tasks are dependent and tied to a fixed end date. If tasks can be completed in any order, the concept does not apply. In real projects, most work includes dependencies. Using a system like Lark helps teams clearly define these links, so the critical path in views reflects actual execution logic.
How often should teams review the critical path?
At a minimum, teams should review the critical path once a week. In fast-moving projects, daily reviews provide better control and reduce surprises. Frequent checks help teams react before delays compound. With Lark, changes to tasks and dependencies are visible in real time, making regular critical path reviews easier to maintain.
Related reading





























