














How to Calculate ROI for a Project: Measure True Impact

Ryan Tanner
Product Marketing Specialist
Sep 18, 2026
Ryan Tanner
Sep 18, 2026

16 min read


Calculating ROI for a project is one of the most effective ways to determine whether your efforts are truly delivering value. Understanding how to calculate ROI for a project helps teams evaluate financial impact, justify investments, and make informed, data-driven decisions for the future. Whether you're launching a new software system, running a marketing campaign, or improving internal processes, ROI offers a clear lens to measure performance and efficiency.
In this guide, you'll learn the step-by-step formula for ROI calculation, explore real-world examples, and uncover common pitfalls to avoid. And for teams looking to streamline analysis, connected tools like Lark make tracking ROI and financial outcomes faster, more accurate, and fully collaborative.

What is ROI in project management?
Return on Investment (ROI) in project management is a key metric used to assess how effectively a project generates value compared to its costs. It measures the financial return or benefit achieved from the resources invested in a project. Understanding how to calculate ROI for a project helps teams determine whether their initiatives contribute positively to work goals, improve efficiency, or deliver measurable outcomes. ROI is typically expressed as a percentage and calculated using the formula: (Total Benefits − Total Costs) ÷ Total Costs × 100. Learning how to measure ROI accurately ensures that project managers can evaluate performance, justify investments, and make data-driven decisions, often with the help of project management tools that track costs, benefits, and progress in one place.
In project management, ROI goes beyond profit—it reflects time savings, reduced risks, and enhanced productivity. When applied consistently, ROI becomes a vital decision-making tool that helps organizations prioritize high-impact projects and optimize overall resource allocation.
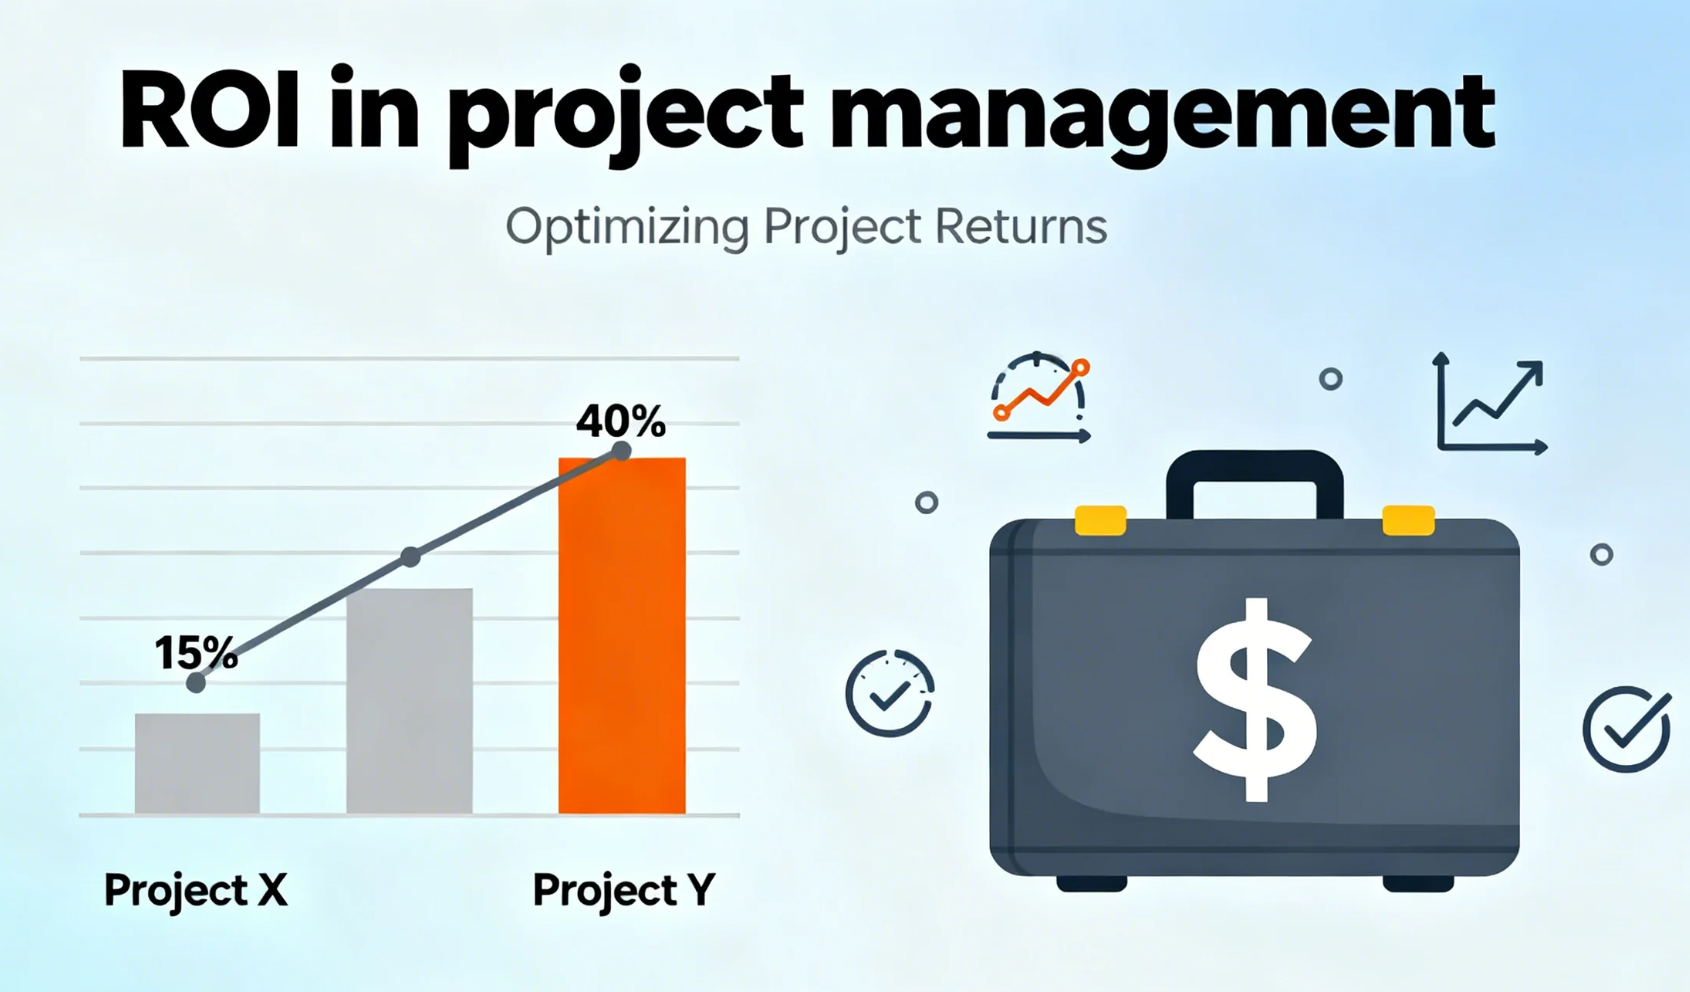
Image source: unsplash.com
Examples of ROI calculation by project type
ROI can vary widely depending on the type of project, its objectives, and how outcomes are measured. Understanding how to calculate ROI for a project across different categories helps teams tailor their approach and set realistic benchmarks. Each project type—whether operational, technological, or strategic—has unique cost and benefit dynamics. Below are practical examples that illustrate how ROI is applied in various contexts.
- Marketing campaign: For marketing initiatives, ROI compares advertising spend with the revenue generated from new customer acquisition. It highlights how effectively a campaign converts budget into measurable growth.
- Software development project: In software projects, ROI measures development costs against efficiency gains or new client acquisitions. It evaluates how well technology investments translate into productivity or revenue improvements.
- Process improvement: Process-focused ROI analyzes automation costs compared to time saved, error reduction, or increased throughput. It reflects the tangible impact of operational optimization.
- Training porogram: For training initiatives, ROI compares program costs with productivity improvements or reduced employee turnover. It shows whether skill development efforts deliver measurable organizational value.
How to calculate ROI for a project
Calculating ROI for a project follows a structured, data-driven process that helps teams understand financial performance and overall impact. By breaking the analysis into clear steps, you can identify where value is created and how efficiently resources are used. Whether it's a marketing campaign, IT upgrade, or process improvement, learning how to calculate ROI for a project ensures consistency and transparency. Below is a step-by-step guide to make your ROI calculations accurate and actionable.
Step 1: Identify project costs
- Begin by listing all expenses associated with the project. This includes direct costs such as labour, tools, and materials, as well as indirect costs like training, overhead, or maintenance. Capturing both ensures your ROI is realistic and comprehensive.
- Example: A software rollout project includes costs for development time, software licenses, and ongoing support fees, giving a full picture of total investment.
Step 2: Estimate project benefits
- Next, identify and quantify the measurable gains resulting from the project. These can include revenue growth, cost savings, time efficiencies, or reduced operational risks. Converting these outcomes into monetary values makes comparisons straightforward.
- Example: A process automation project saves 200 labor hours per month at $40 per hour, equating to an $8,000 monthly benefit or $96,000 annually.
Step 3: Apply the ROI formula
- Once you have total costs and benefits, use the formula:
- ROI = (Total Benefits − Total Costs) ÷ Total Costs × 100.
- This calculation expresses the project's return as a percentage, showing how much value was gained relative to the investment.
- Example: A $96,000 yearly benefit from a $60,000 investment yields a 60% ROI, demonstrating solid financial performance.
Step 4: Analyze time factor (optional)
- ROI alone doesn't account for how long returns take to materialize. To understand timing, consider additional metrics like Payback Period (how fast returns offset costs) or Net Present Value (NPV) for multi-year projects.
- Example: A project with a 60% ROI but a three-year payback might be less attractive than one with 40% ROI and a one-year payback.
Step 5: Communicate results clearly
- Finally, present your ROI findings in a clear, visual format. Use charts, dashboards, or reports that highlight benefits, costs, and ROI percentage for transparency. Visual representation makes it easier for stakeholders to grasp project impact.
- Example: A dashboard comparing ROI across multiple initiatives helps management see which projects deliver the strongest returns and where to reinvest resources.
Modern solution: Use Lark to measure and track project ROI with ease
When ROI measurement moves beyond static spreadsheets, Lark offers a dynamic workspace that connects data, discussions, and decisions. It helps teams calculate, review, and present ROI results in real-time time — ensuring accuracy, visibility, and collaboration throughout the project lifecycle.
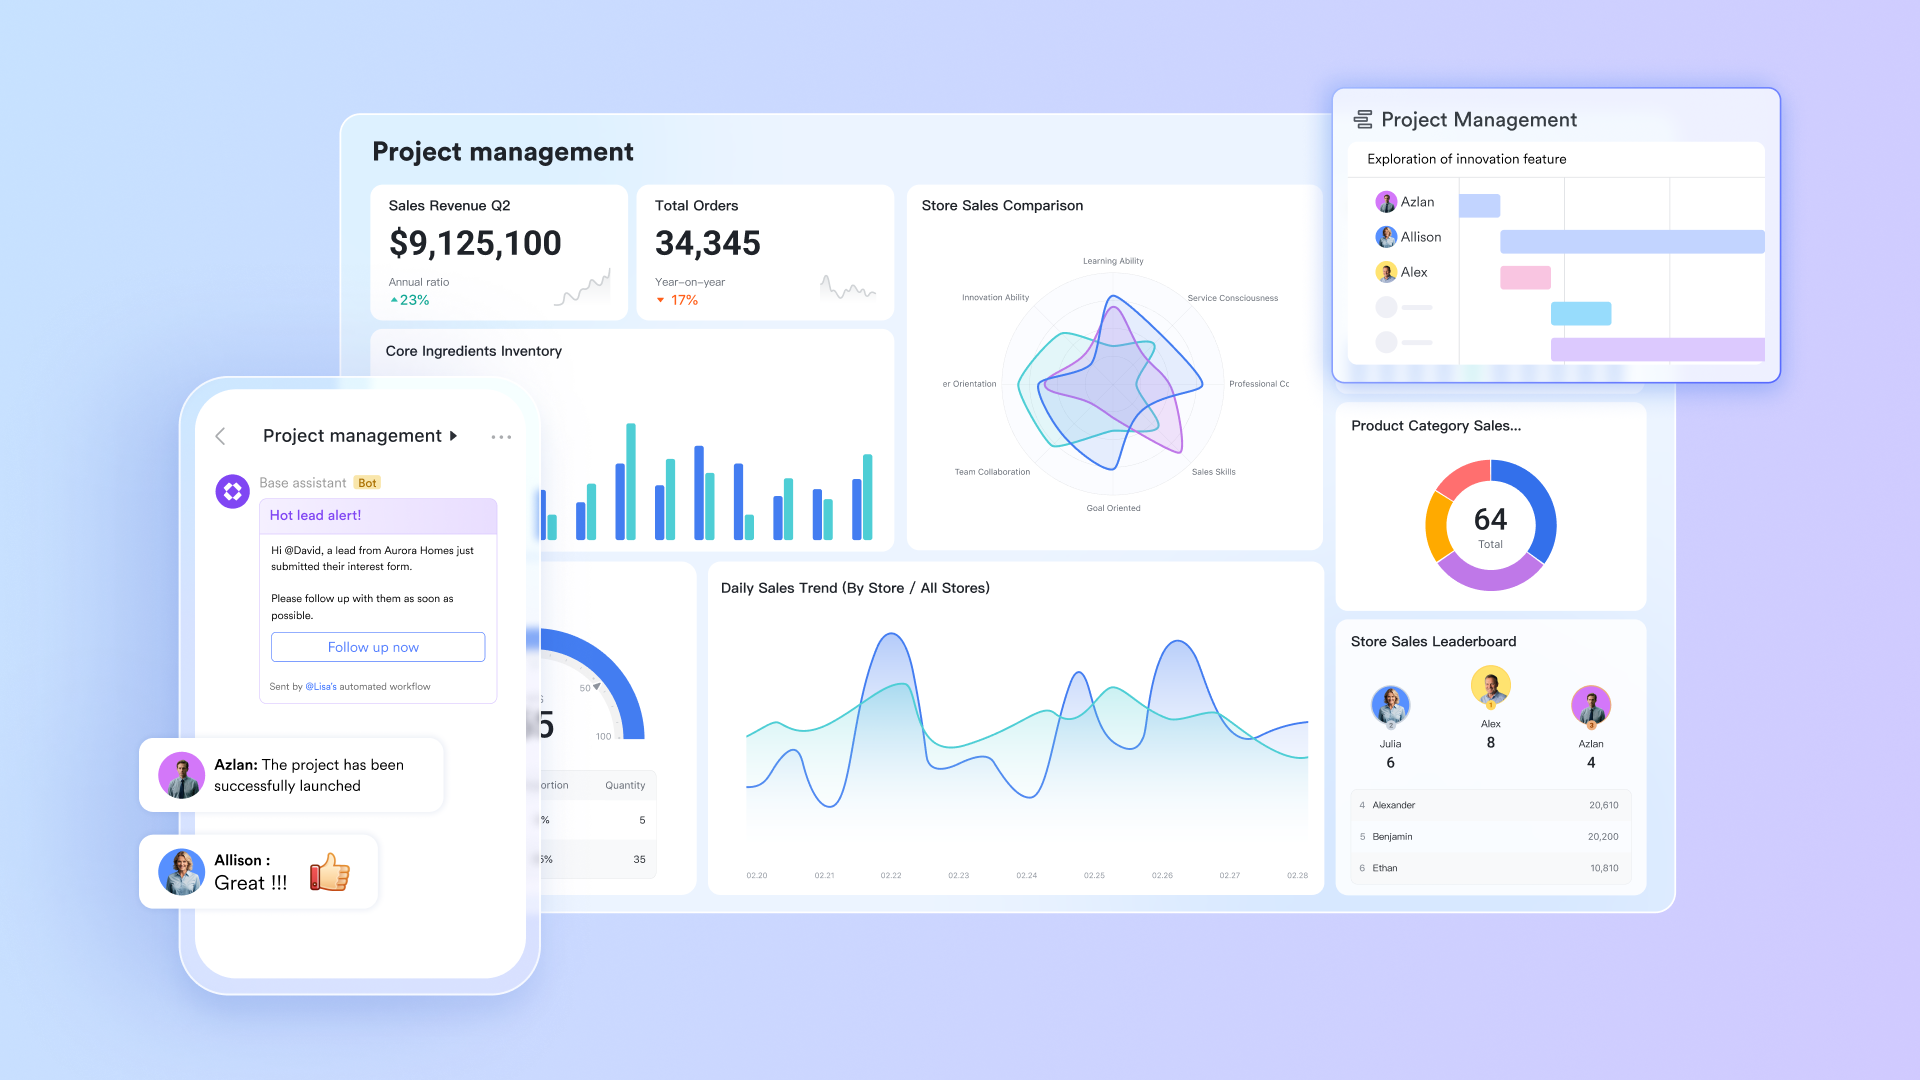
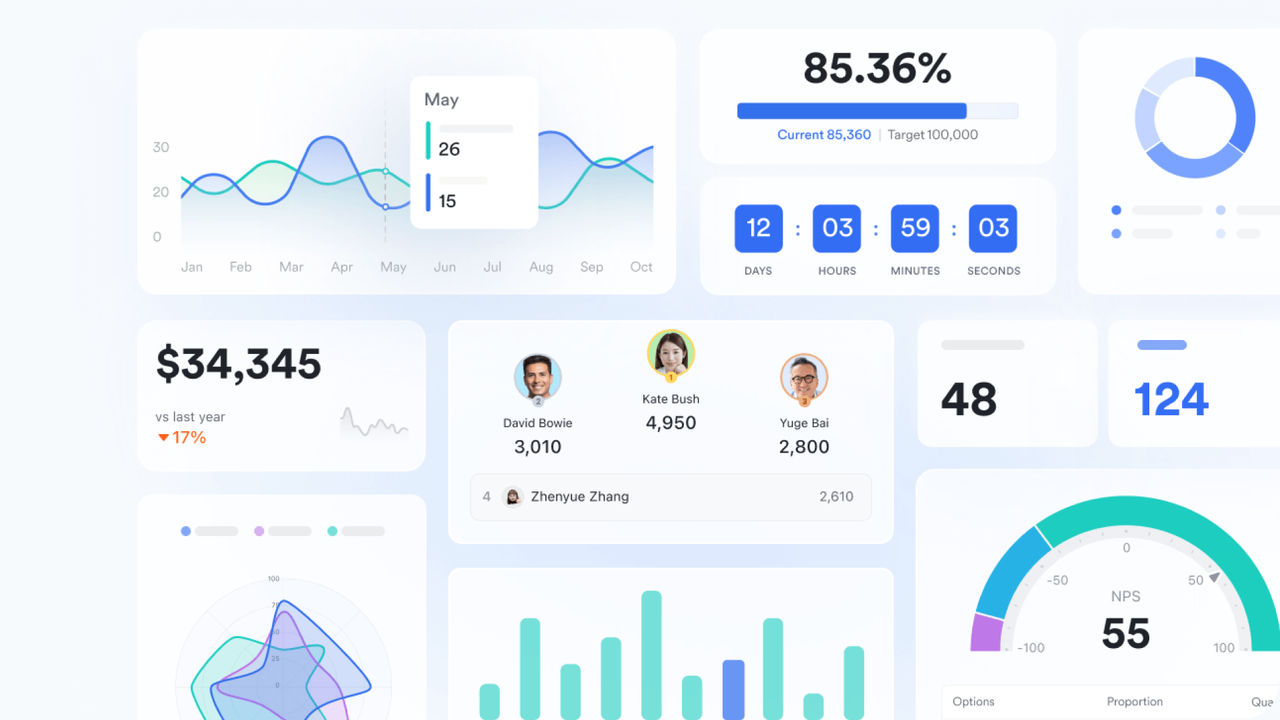
Lark Base: Centralized ROI tracker and live dashboards
Lark Base creates dashboards with tables for projects, costs, benefits, and assumptions. You can enter typical fields, including project owner, department, start/end dates, cost type (CapEx/Opex), amount, benefit driver (revenue, time saved, error reduction), frequency (monthly/quarterly), and confidence level. Also, use automated workflow rules to flag projects whose ROI falls below a threshold (e.g., < 25%) or whose payback date slips, then assign an owner for remediation.
Example: A marketing project spends ₹600k across 3 months; attributed revenue reaches ₹1.2M within 6 months. Base shows ROI = (1.2M − 0.6M) / 0.6M = 100%, Payback in month 3, and keeps the chart updated as new revenue posts.
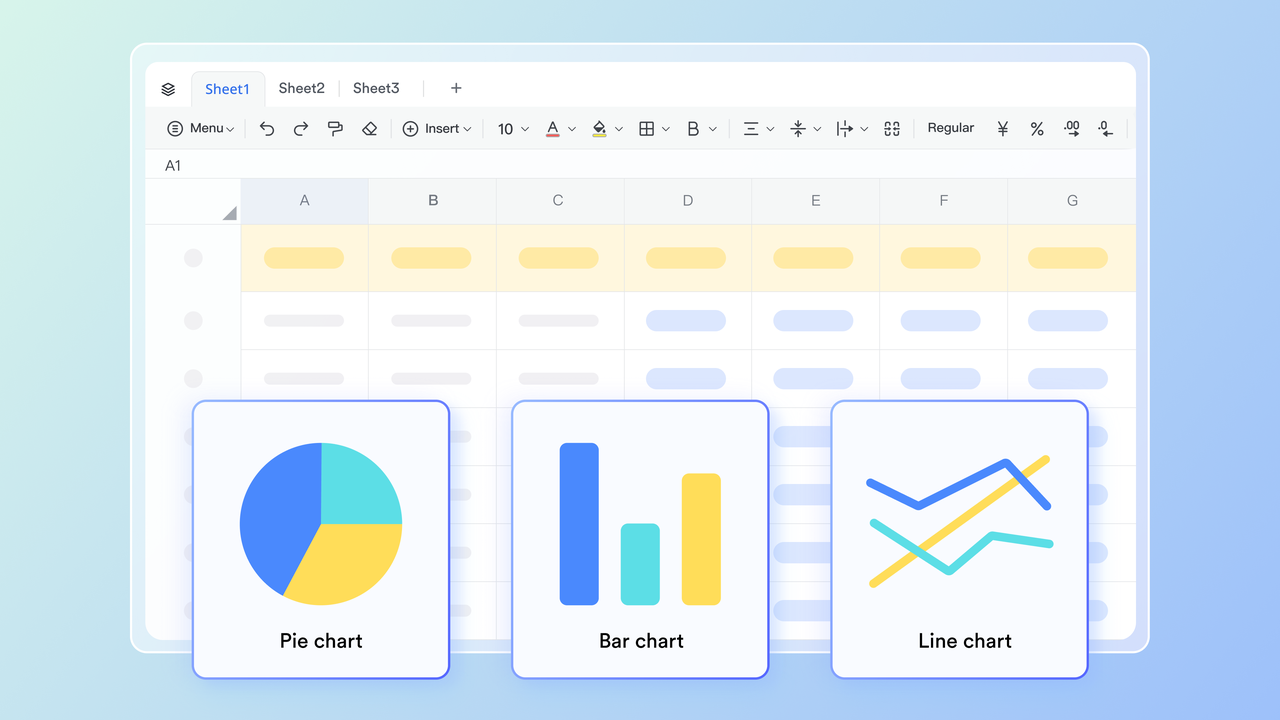
Lark Sheets: Calculations, scenarios, and model logic
Lark Sheets allows you to input your financial data—such as costs, revenue, or investment figures—directly into a familiar spreadsheet interface. You can then apply formulas to automatically calculate ROI, eliminating manual calculations and reducing errors. Once calculated, the data can be synced to Lark Base, where you can track results, apply automation, and use spreadsheets to solve the question of how to measure ROI.
Example: Run three scenarios—Conservative ($500k benefit), Likely ($800k), Stretch ($1.1M)—and compare ROI and payback side by side. If hiring costs increase by 10%, one cell change updates every dependent metric across the workbook.
Lark Docs: Business cases, ROI narratives, and audit trails
Lark Docs helps you in ROI calculation by providing a collaborative space to document your business case, outline key assumptions—like pricing, adoption rate, and conversion—and record related decisions. You can insert tables to structure financial inputs and ROI formulas clearly, ensuring everyone sees how calculations are derived.
Example: A process-improvement project breaches its payback target. The cross-functional team opens the linked Doc, logs the Root Cause (slower onboarding than forecast), records corrective actions (extra enablement), and tags owners with due dates. The Doc remains the single source for "why our ROI is what it is."

Lark Meetings: Live reviews, action items, and traceability
Lark Meetings enables teams to discuss and analyze ROI collaboratively by sharing and editing Lark Docs in real time. Teams can work within a single document to consolidate materials, summarize insights, and assign action items. The comment review mode supports focused discussions on specific points, ensuring alignment across participants. If the meeting is recorded or AI Meeting Notes is enabled, automatically generated Minutes and group chats facilitate continued communication and analysis, ensuring follow-up.
Example: Quarterly portfolio review: three projects exceed 50% ROI—approved for scale; one project at 8% ROI gets a 30-day turnaround plan. Action items are created during the call and appear in each project's record afterward.

- Starter plan: Free forever plan that includes 11 powerful tools for up to 20 users. It also comes with 100GB of storage, 1000 automation runs, AI translations, and more.
- Basic plan: $6/user/month (billed annually) for up to 500 users. Includes everything in Starter plus unlimited message history, 5TB storage, 1,000 automation runs, and more. Some users may need to contact sales to purchase.
- Pro plan: $12/user/month (billed annually) for up to 500 users. It includes everything in Starter plus group calling for up to 500 attendees, 15TB of storage, 50,000 automation runs, and more.
- Enterprise plan: Contact sales for custom pricing. Supports unlimited users and includes even more automation runs and advanced security, compliance, and management features.
Kick off your plan: Ready-to-use templates in Lark
To simplify the process of calculating ROI and tracking project performance, using ready-made templates can save significant time and ensure accuracy. Lark offers a range of customizable ROI templates that help teams capture project costs, estimate benefits, and visualize outcomes in real time:
Return On Investment Calculator For Investment Analysts
The return on investment calculator for investment analysts template is designed to simplify financial evaluation and performance tracking across multiple projects or portfolios. It allows analysts to input investment costs, expected returns, and time horizons while automatically calculating ROI percentages and payback periods. With built-in formulas and visual dashboards, it minimizes manual errors and delivers instant insights. This template is ideal for professionals who need to measure ROI quickly and make data-driven investment decisions with confidence.
ROI analysis template for TV shows
The ROI analysis template for TV shows helps production teams, studios, and media planners evaluate the financial success of television projects. It captures key data such as production costs, sponsorship revenue, ad sales, and viewer engagement metrics to calculate ROI accurately. The template visualizes profitability trends over time, enabling better budgeting and future content planning. It's ideal for understanding how creative investments translate into measurable financial returns.
Media campaign ROI analysis
The media campaign ROI analysis template enables marketers to measure the financial performance of advertising and media initiatives with precision. It tracks campaign spend, leads conversions, and revenue impact to calculate ROI and identify high-performing channels. With real-time data visualization, teams can spot trends and optimize campaigns for better returns. This template is perfect for ensuring every marketing dollar contributes directly to measurable business growth.
ROI analysis for tech advertising
The ROI analysis for tech advertising template is tailored for technology marketers aiming to evaluate the impact of digital ad campaigns. It tracks ad spend, impressions, conversions, and resulting revenue to calculate accurate ROI across platforms. The template helps identify which campaigns drive the highest returns and where optimization is needed. It's an essential tool for tech brands focused on maximizing ad efficiency and data-driven marketing performance.
Marketing campaign ROI calculator for marketing departments
The marketing campaign ROI calculator for marketing departments template helps teams measure the effectiveness of their campaigns across multiple channels. It allows users to input costs, leads generated, conversion rates, and resulting revenue to automatically compute ROI. With visual summaries and comparison dashboards, marketing leaders can identify which initiatives deliver the strongest returns. This template is ideal for optimizing budgets, refining strategies, and showcasing the true value of marketing efforts.
Why calculating project ROI matters
Calculating project ROI matters because it connects every initiative to measurable business value. It enables teams to understand the true impact of their efforts, ensuring that resources are directed toward projects that drive meaningful results. By learning how to calculate ROI for a project and how to measure ROI effectively, organizations gain a clearer view of performance management and profitability. Beyond financial returns, ROI also reflects efficiency, productivity, and strategic alignment.
- Aligns project goals with business outcomes: ROI ensures that project objectives are tied to larger organizational goals. It helps leaders verify that each initiative supports revenue growth, cost efficiency, or strategic priorities. This alignment keeps teams focused on outcomes that matter most to the business.
- Helps justify resource allocation and funding: By quantifying expected returns, ROI makes it easier to secure executive approval and stakeholder buy-in. It provides a clear rationale for where funds, time, and personnel should be invested. Projects with stronger ROI projections naturally receive higher priority.
- Measures long-term value of process or tech improvements: ROI captures ongoing benefits beyond initial implementation, such as time savings or improved performance. It helps track whether new systems, processes, or technologies continue delivering value over time. This long-term visibility supports better planning and continuous improvement.
- Encourages data-driven decision-making: When teams know how to measure ROI, decisions become grounded in evidence rather than assumptions. ROI analysis provides quantifiable insights into what works, enabling leaders to make informed adjustments and scale high-performing initiatives.
- Demonstrates accountability and efficiency to stakeholders: ROI reporting shows stakeholders that projects are managed responsibly and deliver measurable results. It builds trust by making outcomes transparent, ensuring that every investment can be tracked and justified through clear data.
Common challenges in ROI calculation
While learning how to calculate ROI for a project offers valuable insights, it also comes with several practical challenges. Many teams struggle with incomplete data, inconsistent tracking, or the inability to measure non-financial outcomes. Understanding these barriers helps organizations refine their approach and learn how to measure ROI more accurately. Addressing these common pitfalls ensures your ROI analysis remains credible, consistent, and actionable.
- Difficulty quantifying intangible benefits (brand value, customer satisfaction): Some project outcomes—like improved reputation, user satisfaction, or brand awareness—don't translate easily into monetary terms. This makes it harder to capture the project's full value. Using proxy metrics or qualitative assessments can help estimate these benefits for more balanced ROI measurement.
- Ignoring opportunity costs or risk factors: Projects often consume resources that could have been used elsewhere, and failing to account for this limits ROI accuracy. Risk factors such as delays, adoption issues, or market shifts can also skew results. Including opportunity costs and risk adjustments ensures a realistic view of project returns.
- Inconsistent cost tracking across departments: When teams use different methods or tools to log expenses, ROI calculations become fragmented and unreliable. Standardizing cost categories and centralizing data collection improves accuracy. Consistent reporting is crucial for comparing how ROI varies across multiple projects or departments.
- Static spreadsheets leading to outdated data: Manual tracking through spreadsheets makes it difficult to maintain real-time accuracy in ROI analysis. Data can quickly become obsolete, leading to misinformed decisions. Automated ROI dashboards or integrated tools help teams stay up to date and monitor ongoing performance.
- Lack of visibility on real-time progress vs expected returns: Without real-time monitoring, teams can't easily tell if a project is on track to deliver its projected ROI. This limits the ability to make timely adjustments. Using connected platforms enables teams to compare live results with forecasted outcomes for continuous performance optimization.
Conclusion
Calculating ROI for a project is more than a financial exercise—it's a strategic approach to understanding value, guiding investments, and driving organizational growth. From identifying project costs and estimating measurable benefits to applying the ROI formula and analyzing real-world outcomes, every step provides insights into performance and efficiency. However, traditional tools like spreadsheets can limit visibility and accuracy.
Modern platforms such as Lark simplify this process by integrating data, automation, and collaboration in one workspace, allowing teams to calculate, monitor, and communicate ROI seamlessly. With built-in templates, live dashboards, and automated workflows, Lark empowers teams to make smarter, data-driven decisions backed by real-time financial insights. Whether you're managing a marketing campaign, software rollout, or process improvement initiative, tracking ROI through Lark ensures your efforts deliver measurable impact. Start using Lark today to measure your project ROI with confidence and achieve better results, faster.
FAQs
How do you ensure ROI calculations stay accurate over time?
Lark ensures ROI accuracy by keeping project data updated in real time across connected tools. When costs, benefits, or assumptions change, all linked records and dashboards adjust automatically. This eliminates manual recalculations and reduces errors. Regular reviews further enhance precision and transparency in ROI tracking.
Can ROI be applied to non-financial projects?
Yes, ROI can be applied to projects that don't generate direct revenue, such as employee training or process optimization. In these cases, returns are measured through qualitative or indirect benefits like time savings, improved morale, or reduced errors. Assigning measurable values to these outcomes provides a balanced view of project success.
How does Lark improve collaboration in ROI tracking?
Lark integrates ROI calculations, communication, and documentation into one platform. Teams can update data, comment on assumptions, and discuss results in real time. This unified approach reduces silos and promotes transparency. As a result, ROI analysis becomes faster, more reliable, and team-driven.
What's the difference between ROI and NPV in project evaluation?
ROI measures the percentage return compared to total project costs, giving a straightforward view of profitability. NPV, or Net Present Value, factors in time and discount rates to evaluate long-term financial value. While ROI highlights immediate efficiency, NPV helps assess sustainability over time. Both are essential for informed project evaluation.
How does Lark help automate ROI reporting?
Lark automates ROI reporting by linking project data with built-in workflows and notifications. It updates dashboards instantly when new figures are entered, ensuring reports remain current. Automated alerts flag low-performing projects or delays. This streamlines financial tracking and enables proactive management decisions.
Related reading
Table of contents
Start using Lark today

Manage all your work in one place
Boost team efficiency by 10x
Save up to 70% on software costs
Table of contents
Start using Lark today
Manage all your work in one place
Boost team efficiency by 10x
Save up to 70% on software costs
Keep reading







2026 Lark Technologies Pte. Ltd.
Headquartered in Singapore with offices worldwide.






Explore: