














How to Create A Gantt Chart That Your Team Will Actually Use

Fecilia Clarke
Solutions Marketing Specialist
Sep 18, 2026
Fecilia Clarke
Sep 18, 2026

16 min read


We've all been there. A new project kicks off, full of energy and exciting ideas. But soon, that initial clarity gives way to a tangled web of questions. Who's handling what? When is that critical date? Are we on track, or are we drifting toward a last-minute scramble? This chaos can derail even the most promising ventures. Managing project schedules can often feel more complicated than the project itself. For decades, the answer to this challenge has been the Gantt chart—a powerful tool for bringing order to the beautiful mess of project management.
But let's be honest. The thought of creating Gantt charts can be intimidating. Many of us have spent hours wrestling with Excel, trying to turn data into a coherent visual timeline. You might try to format a stacked bar chart, only to end up with something that doesn't quite work. It doesn't have to be this way. We believe in a better approach, one where your Gantt chart is not just a static image, but a living, collaborative hub. This guide will show you how to create a Gantt chart that your team will not only understand but will actually use to drive your project to success.

What exactly is a Gantt chart?
At its core, a Gantt chart is a type of bar chart that illustrates a project schedule over time. It provides a crystal-clear visual representation of what needs to get done, who is responsible for doing it, and when it needs to happen. Think of it as a roadmap for your project, transforming a long list of tasks into an intuitive and actionable plan. It answers the fundamental questions of project management—the "what," "when," and "who"—in a single, easy-to-understand view, making it an indispensable asset for any project team.
The concept isn't new. Briefly touching on its origins helps us appreciate its relevance. Developed by Henry Gantt, the chart was a revolutionary way to visualize planned and actual work, helping supervisors see if production was on schedule or falling behind. This simple yet profound innovation in visual planning has endured, adapting from paper to the sophisticated, integrated software we use today. It's a testament to a good idea that it can remain so efficient for over a century, helping teams of all kinds to stay organized and focused on their goals.
To truly understand its power, we need to define its core components. The primary element is the project tasks list, a vertical column on the left side outlining all activities. Alongside this is the timeline, a horizontal axis showing the duration of the project. Each task is represented by a stacked bar whose length corresponds to the task duration, stretching from its start date to its end date. These visual bars make it incredibly easy to see the overall shape and flow of the schedule and plan your work accordingly.
Beyond these basics, the real magic lies in its more dynamic components. Task dependencies are visual connectors that show the relationships between tasks, indicating that one task cannot begin until another is completed. This helps create a logical workflow and identify potential bottlenecks. Key milestones are represented as single points on the timeline, marking significant deadlines or deliverables. Finally, modern Gantt charts often show progress, usually as a colored fill within a task bar, providing an at-a-glance status update on how much work has been done.
Why a Gantt chart is still essential for modern teams
It brings clarity and aligns the entire team
With remote teams and complex projects, the need for clarity has never been greater. A Gantt chart helps everyone see the big picture, ensuring all stakeholders are aligned on the overall plan and a shared vision of success. Its ability to distill vast amounts of data into a single, digestible format is perhaps its greatest strength. It makes it easy for anyone, from an executive to a new team member, to understand the project scope and timelines of the work ahead, which ultimately saves time in meetings and status updates.
It optimizes your team's workload and resources
This visual clarity is also fundamental to improving resource allocation. A Gantt chart allows you to see who is working on what and when. By visualizing the entire team's workload across the project timelines, you can prevent individuals from becoming overloaded while others are underutilized. This foresight enables better management of your resources, ensures a more balanced workload, and helps maintain a healthy, sustainable pace. It moves planning from a guessing game to a strategic, data-informed process, boosting efficiency and team morale.
It builds accountability and keeps everyone motivated
Furthermore, a well-maintained Gantt chart fosters a culture of accountability and transparency. When tasks, owners, and deadlines are clearly laid out for everyone to see, it creates a shared sense of responsibility. There is no ambiguity about who is accountable for each part of the project. This transparency empowers team members to take ownership of their work and understand how their individual contributions fit into the big picture. It also makes progress visible, which can be a powerful motivator and helps build momentum until the project is completed.
It helps you spot roadblocks before they happen
Perhaps one of the most strategic benefits is its ability to help you proactively manage the critical path. The task dependencies are more than just lines on a chart; they represent the sequence of tasks that directly impacts the project's finish date. By visualizing these connections, you can easily see how unexpected delays in one task will impact the overall deadline. This allows you to identify potential bottlenecks and risks before they become major problems, giving you time to adjust the plan or communicate with stakeholders about potential delays.
Gantt chart template recommendations
Project Gantt chart template
This template provides a powerful and user-friendly way to create a dynamic Gantt chart, giving you a clear visual overview of your project schedule. It is designed to help you effortlessly track task progress, manage critical deadlines, and ensure your entire project moves forward on time. As your project evolves, the chart can be updated with ease, making it an essential tool for keeping your team aligned and organized.
Best for:
This template is ideal for project managers, team leaders, and any professional responsible for planning and executing projects. It is especially valuable for managing complex timelines and multiple deadlines in industries such as:
- Software Development
- Marketing & Advertising
- Construction & Engineering
- Event Planning
- Product Development
- Research & Development
Employee task tracker template
This is a comprehensive tool for managing your team's workload, combining visual dashboards like Gantt charts and Kanban boards with powerful tracking features. It offers a clear, real-time view of all task descriptions, deadlines, and statuses in one place. With fully customizable fields, you can adapt the tracker to your team's specific needs, making it the central hub for task allocation, progress monitoring, and seamless collaboration.
Best for:
This template is a perfect fit for HR managers, team leaders, and project managers who oversee team tasks. It is especially effective for:
- Managers handling multiple complex projects at once.
- Leaders who need a clear, visual way to track progress and accountability.
- Remote teams that require a centralized platform for real-time updates and collaboration.
R&D personnel Gantt chart template
This template is a comprehensive tool specifically designed for managing tasks and projects within research and development teams. It provides a clear, visual Gantt chart timeline that maps out the start and end dates, priority, status, and assigned personnel for every task. With customizable fields and views, it simplifies project tracking, enhances visibility, and streamlines the entire R&D project management process.
Best for:
This template is designed for project managers, team leaders, and supervisors in the R&D sector. It is also highly effective for:
- Managers overseeing multiple complex research projects simultaneously.
- Teams that need a clear, shared overview of progress, deadlines, and responsibilities.
- Freelance R&D consultants managing tasks across various projects.
Project roadmap Gantt chart template
This template serves as a dynamic visual roadmap for planning, executing, and tracking your projects. It provides a clear Gantt chart view that displays the entire project timeline, individual tasks, and responsible team members, allowing you to monitor progress against deadlines at a glance. With multiple views (by task, project, priority, or status) and customizable settings, it helps organize complex projects into a simple, actionable plan.
Best for:
This template is essential for anyone involved in project planning and execution. It is specifically designed for:
- Project managers to plan, coordinate, and track all project phases and ensure timely completion.
- Team leaders to assign tasks, monitor team workload, and quickly identify and resolve bottlenecks.
- Team members to clearly understand their responsibilities, track their own progress, and manage their deadlines effectively.
How to create a Gantt chart: A step-by-step guide
Now for the practical part of creating Gantt charts. Many guides detail the manual process: creating a stacked bar chart, formatting the first data series to have no fill, and adjusting the vertical axis to reverse order the tasks. You'd have to tweak the axis position so the dates align correctly and spend time in the Chart Design tab to get it right. It's a cumbersome process. We'll focus on a more intuitive and efficient approach using Lark Base to build a dynamic chart that you can create in minutes.
Step 1: Build a solid foundation with a project outline
Every great plan starts with a solid outline. Instead of scattering information across documents and spreadsheets, we'll create a single source of truth in Lark Base. You can think of a "base" as a supercharged spreadsheet. To begin, you can use one of Lark's free project management templates or start from a blank file. This gives you a ready-made structure with pre-configured columns that you can immediately customize to fit your specific project scope.
Next, it's time to define the essential fields that will power your Gantt chart. These fields act as the columns in your data table. You'll want fields for Task Name, Owner (allowing you to assign tasks to team members), Start and End Dates, and Status (with options like "To Do," "In Progress," and "Completed"). You can also add a field for Dependencies. This structured data is the engine that will automatically generate your visual timeline, saving you from manual chart creation. Your first task is simply to populate this list.
Step 2: Instantly visualize your timeline with the Gantt view
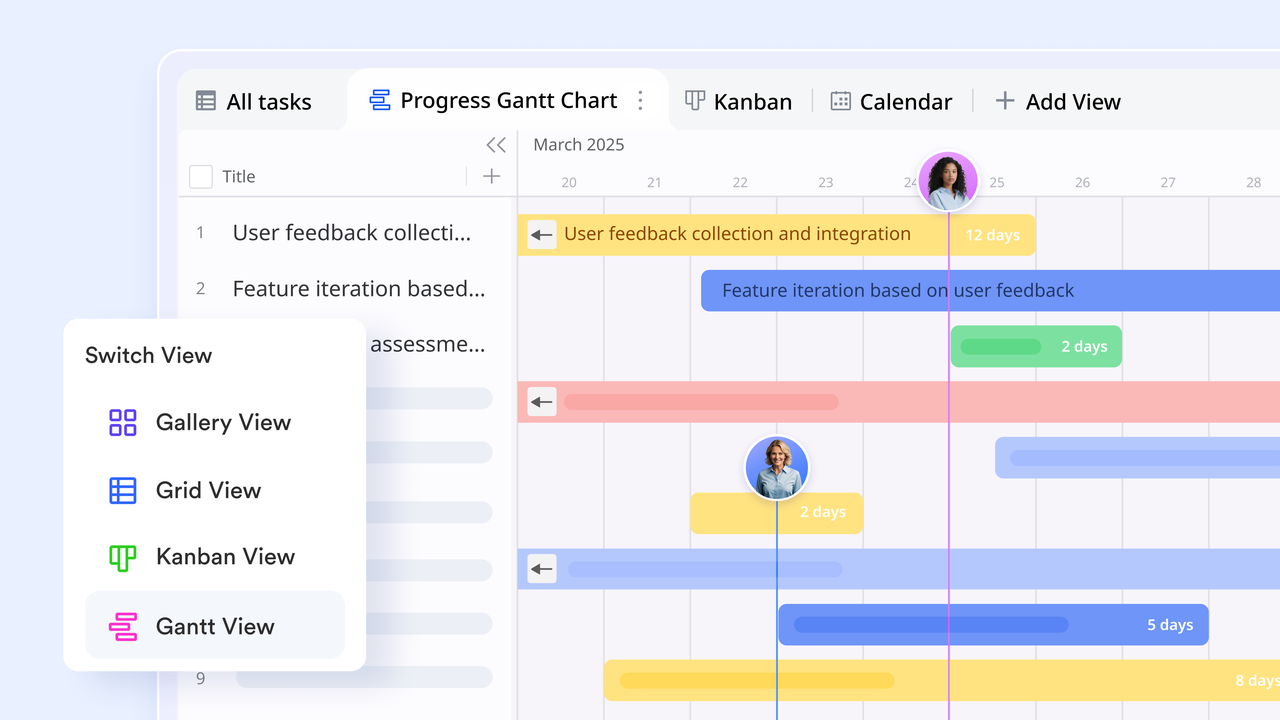
This is where the magic happens. With your task data organized, you are one click away from a complete visual timeline. There are no formulas to write or charts to build manually. Simply navigate to the view menu, click "Add view," and select "Gantt." Lark automatically uses your start date and end date fields to generate the chart. The tasks are listed on the left side along the vertical axis, and the plot area displays the corresponding bars. It's a seamless transformation from a data table into a clear project schedule.
After creating the Gantt view, you can quickly customize it. A settings panel allows you to confirm your date fields and change how tasks are labeled. You can even adjust colors and how much information is displayed. Within moments, you have a fully functional Gantt chart where each task is a bar on the timeline. You can zoom in to see a daily view or zoom out for a quarterly overview. If you need to reorder things, you don't have to worry about complex settings; the interface is simple and intuitive.
Step 3: Define dependencies to map your critical path
A project is more than a list of tasks; it's a sequence of interconnected activities. This is where task dependencies come in, forming the critical path of your project planning. Setting these relationships is crucial for a realistic plan, and in Lark, it's an incredibly intuitive process. In the Gantt view, you can visually link tasks by simply dragging and dropping connectors between task bars. This creates a clear line indicating that one task cannot start until the previous one is completed.
This visual method of setting dependencies makes it easy to map out even complex workflows. As you link tasks, you build the project's critical path, instantly seeing how a delay in one area could ripple through the entire schedule. If a preceding task's end date is shifted, any dependent tasks can be automatically rescheduled, helping you maintain a logical and up-to-date plan. This powerful feature turns a simple list of timelines into a strategic tool for risk management, helping you to identify potential issues early.
Step 4: Monitor progress with real-time collaboration
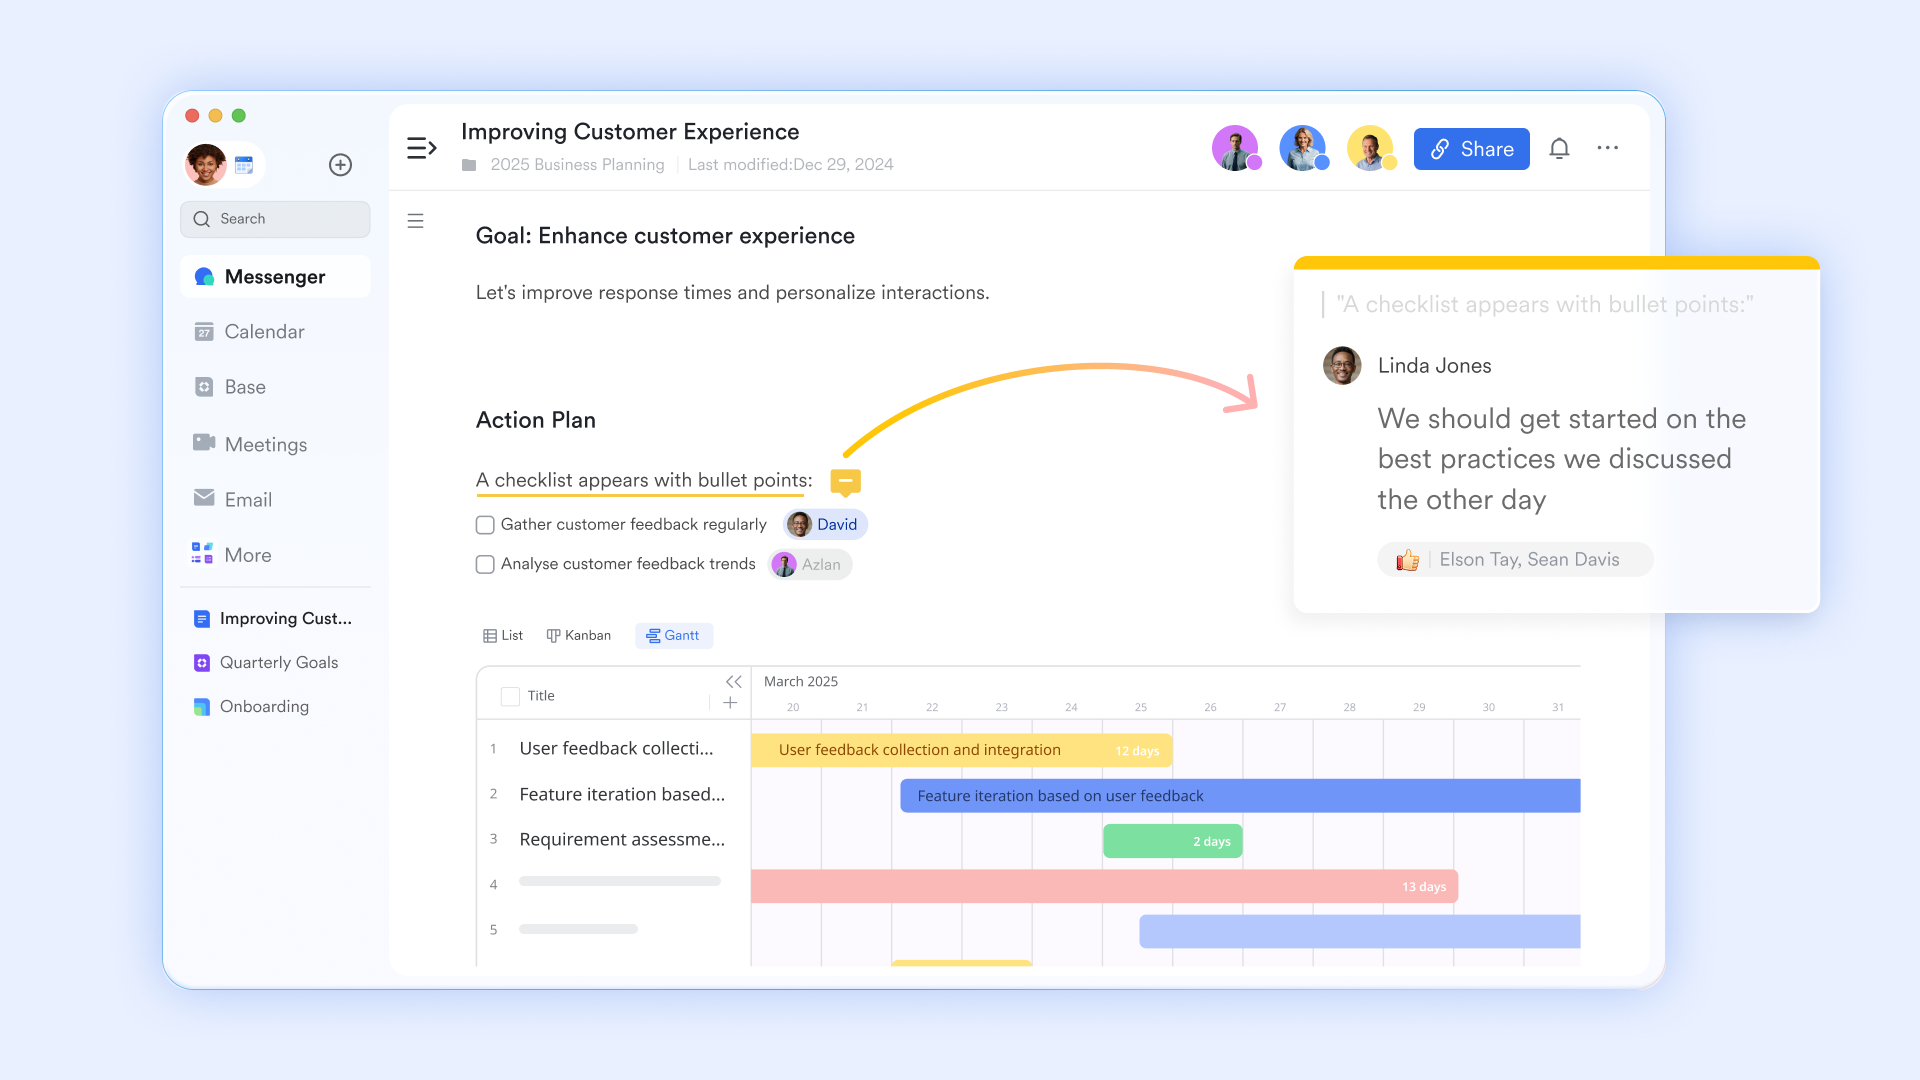
A Gantt chart's true value is unlocked when you can track progress in the moment. This is where an unified tool like Lark truly excels. Your Gantt chart is a shared, living view that everyone on the team can interact with. You can @-mention a team member directly in a task's comment field, ensuring all communication is tied to the work. This ability to seamlessly collaborate and monitor progress is a core component of efficient project management.
Because the Gantt chart and the underlying data table are two views of the same information, any status update made in one place is instantly reflected in the other. When a team member marks a task as "Completed," the task bar on the Gantt chart immediately updates. These real time updates eliminate the need for manual check-ins and ensure that everyone is always looking at the most current version of the project plan. You have full control and visibility at all times, making it easy to manage the workflow. Shortcuts like the command key combined with other keys can even speed up these updates.
The unique advantages of using an all-in-one tool like Lark
Using a standalone Gantt chart tool often creates a disconnected experience, forcing teams to jump between spreadsheets, documents, and messaging apps to manage a project. An all-in-one platform like Lark eliminates this fragmentation by building a connected ecosystem around your project plan. This integrated approach ensures that your Gantt chart is not just a static image but a dynamic, collaborative hub where communication, planning, and execution happen in one place, keeping your team aligned and focused.
- Centralized planning with Lark Base: Build your project on a powerful foundation that combines automation and customization. Lark Base allows you to design automated, custom workflows tailored to your project's needs while eliminating the need for external software with its built-in Gantt view, consolidating your entire planning process.
- Real-time collaboration and communication: Work together without version conflicts. Multiple team members can co-edit task owners, deadlines, and statuses simultaneously. Field-level permissions ensure everyone sees only what they need to, while conversations attached directly to tasks with @-mentions keep communication clear, contextual, and immediate.
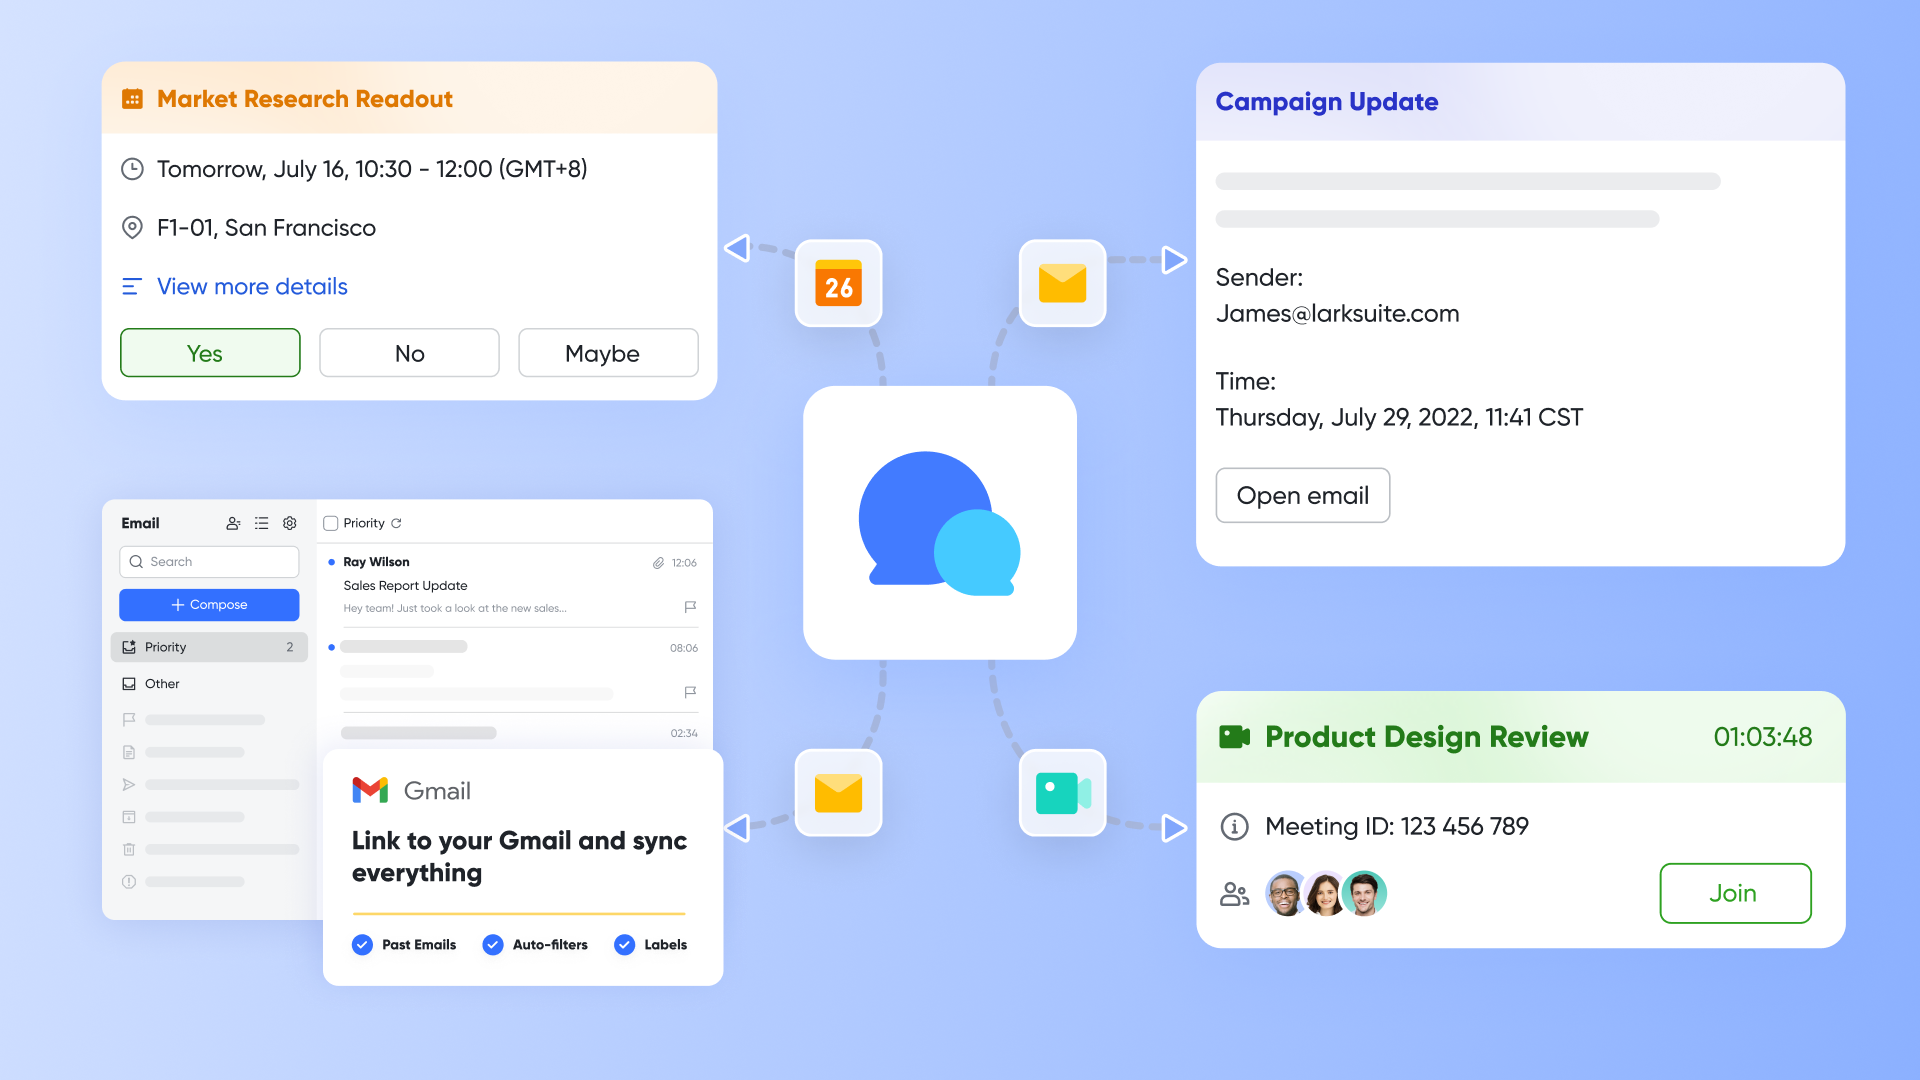
- Seamless calendar and meeting sync: Close the loop between discussion, decision, and action. Key dates from your Gantt chart sync to personal calendars for automatic reminders, while Lark Meetings allows your team to review the schedule and use AI to capture action items that are pushed directly back into your project plan, ensuring no decision gets lost.
- Enhanced security and traceability: Maintain control over sensitive project information. Lark provides granular sharing permissions and a complete audit trail, so you can safely share progress with external stakeholders and track every change. This offers a secure, live view of trusted data, which is far more reliable than emailing fragile, outdated spreadsheets.
- Clear and flexible pricing plans: Lark offers a generous free plan for beginners, and organizations can change their pricing plans flexibly according to their custom needs.
Conclusion
In the end, a great Gantt chart does more than just track dates; it creates a shared understanding, fosters collaboration, and empowers a team to navigate the complexities of a project with confidence and clarity. We've seen that the goal is not merely to create a chart, but to cultivate a dynamic and integrated tool that becomes the heartbeat of your project. By moving away from static, isolated files and embracing a collaborative, living timeline, you can transform your project planning from a chore into a strategic advantage.
The power to bring this level of clarity and alignment to your team's work is at your fingertips. With the right approach and the right tools, you can leave the chaos of disorganized timelines behind and step into a more streamlined, transparent, and effective way of managing projects.
Ready to transform your project planning? Get started with Lark and build your first dynamic Gantt chart for free.
FAQs
How do you create a Gantt chart in Excel?
Creating a Gantt chart in Excel is a manual process. First, you list your tasks with start and end dates. Then, you insert a stacked bar chart and format the first data series (the start date portion) to have no color, making it invisible. Finally, you must reverse the task order on the vertical axis to display it correctly. While possible, it is time-consuming, difficult to update, and lacks collaborative features.
How can I create a free Gantt chart?
You can create a free Gantt chart using a dedicated project management template. Platforms like Lark offer free, ready-made templates that automatically generate a dynamic Gantt chart from your task list. Unlike static spreadsheets, these tools provide real-time collaboration, allowing team members to update progress, assign tasks, and set dependencies in one place. This approach is far more efficient and easier to manage than building a chart from scratch.
Is there a Gantt chart template in Word?
Microsoft Word does not have a built-in Gantt chart template because it is designed for writing documents, not for data visualization or project management. While you could technically create a basic table or import a chart image, it would be static and impractical to update. For creating a functional and dynamic project timeline, you should use spreadsheet software or, better yet, dedicated project management tools designed for this purpose.
Is Excel good for Gantt charts?
Excel can be a useful tool for creating simple, static Gantt charts for small projects with few dependencies. However, it quickly becomes a liability for complex or collaborative work. Excel lacks real-time updates, automated scheduling for dependencies, and integrated communication features. For any project involving a team, a dedicated tool is more effective, as it keeps everyone aligned and provides a single source of truth without manual version control.
Related reading
Table of contents
Start using Lark today

Manage all your work in one place
Boost team efficiency by 10x
Save up to 70% on software costs
Table of contents
Start using Lark today
Manage all your work in one place
Boost team efficiency by 10x
Save up to 70% on software costs
Keep reading








2026 Lark Technologies Pte. Ltd.
Headquartered in Singapore with offices worldwide.






Explore: