














Best Gantt Chart Examples for Teams and Productivity

Ryan Tanner
Product Marketing Specialist
Sep 18, 2026
Ryan Tanner
Sep 18, 2026

18 min read


A well-structured Gantt chart helps teams visualize project timelines, track progress, and manage dependencies with ease. Using a free Gantt chart Excel template, you can quickly organize tasks, deadlines, and milestones all within a familiar spreadsheet format. Excel works well for simple projects, offering accessibility and flexibility without added cost. Yet as collaboration needs grow, manual updates and version issues can become challenging.
Modern tools enhance this process with real-time collaboration, automation, and collaborated communication. This guide explores how to use Excel for Gantt charts, top free templates, and when to consider smarter, scalable project management solutions.

What is a Gantt chart in Excel?
A Gantt chart is one of the visual project management tools that displays tasks along a timeline, showing start and end dates, task duration, and dependencies. It helps teams understand project progress and identify potential delays at a glance. In Excel, you can create a simple Gantt chart using a stacked bar chart by listing tasks, start dates, and durations, then formatting the chart to represent each task visually. This method is ideal for small projects or teams who prefer working in spreadsheets.
However, while Excel Gantt charts are easy to set up and customize, they require manual updates, lack real-time collaboration, and become cumbersome for large or complex projects. For growing teams, combined tools like Lark offer a more dynamic and automated approach to project visualization.
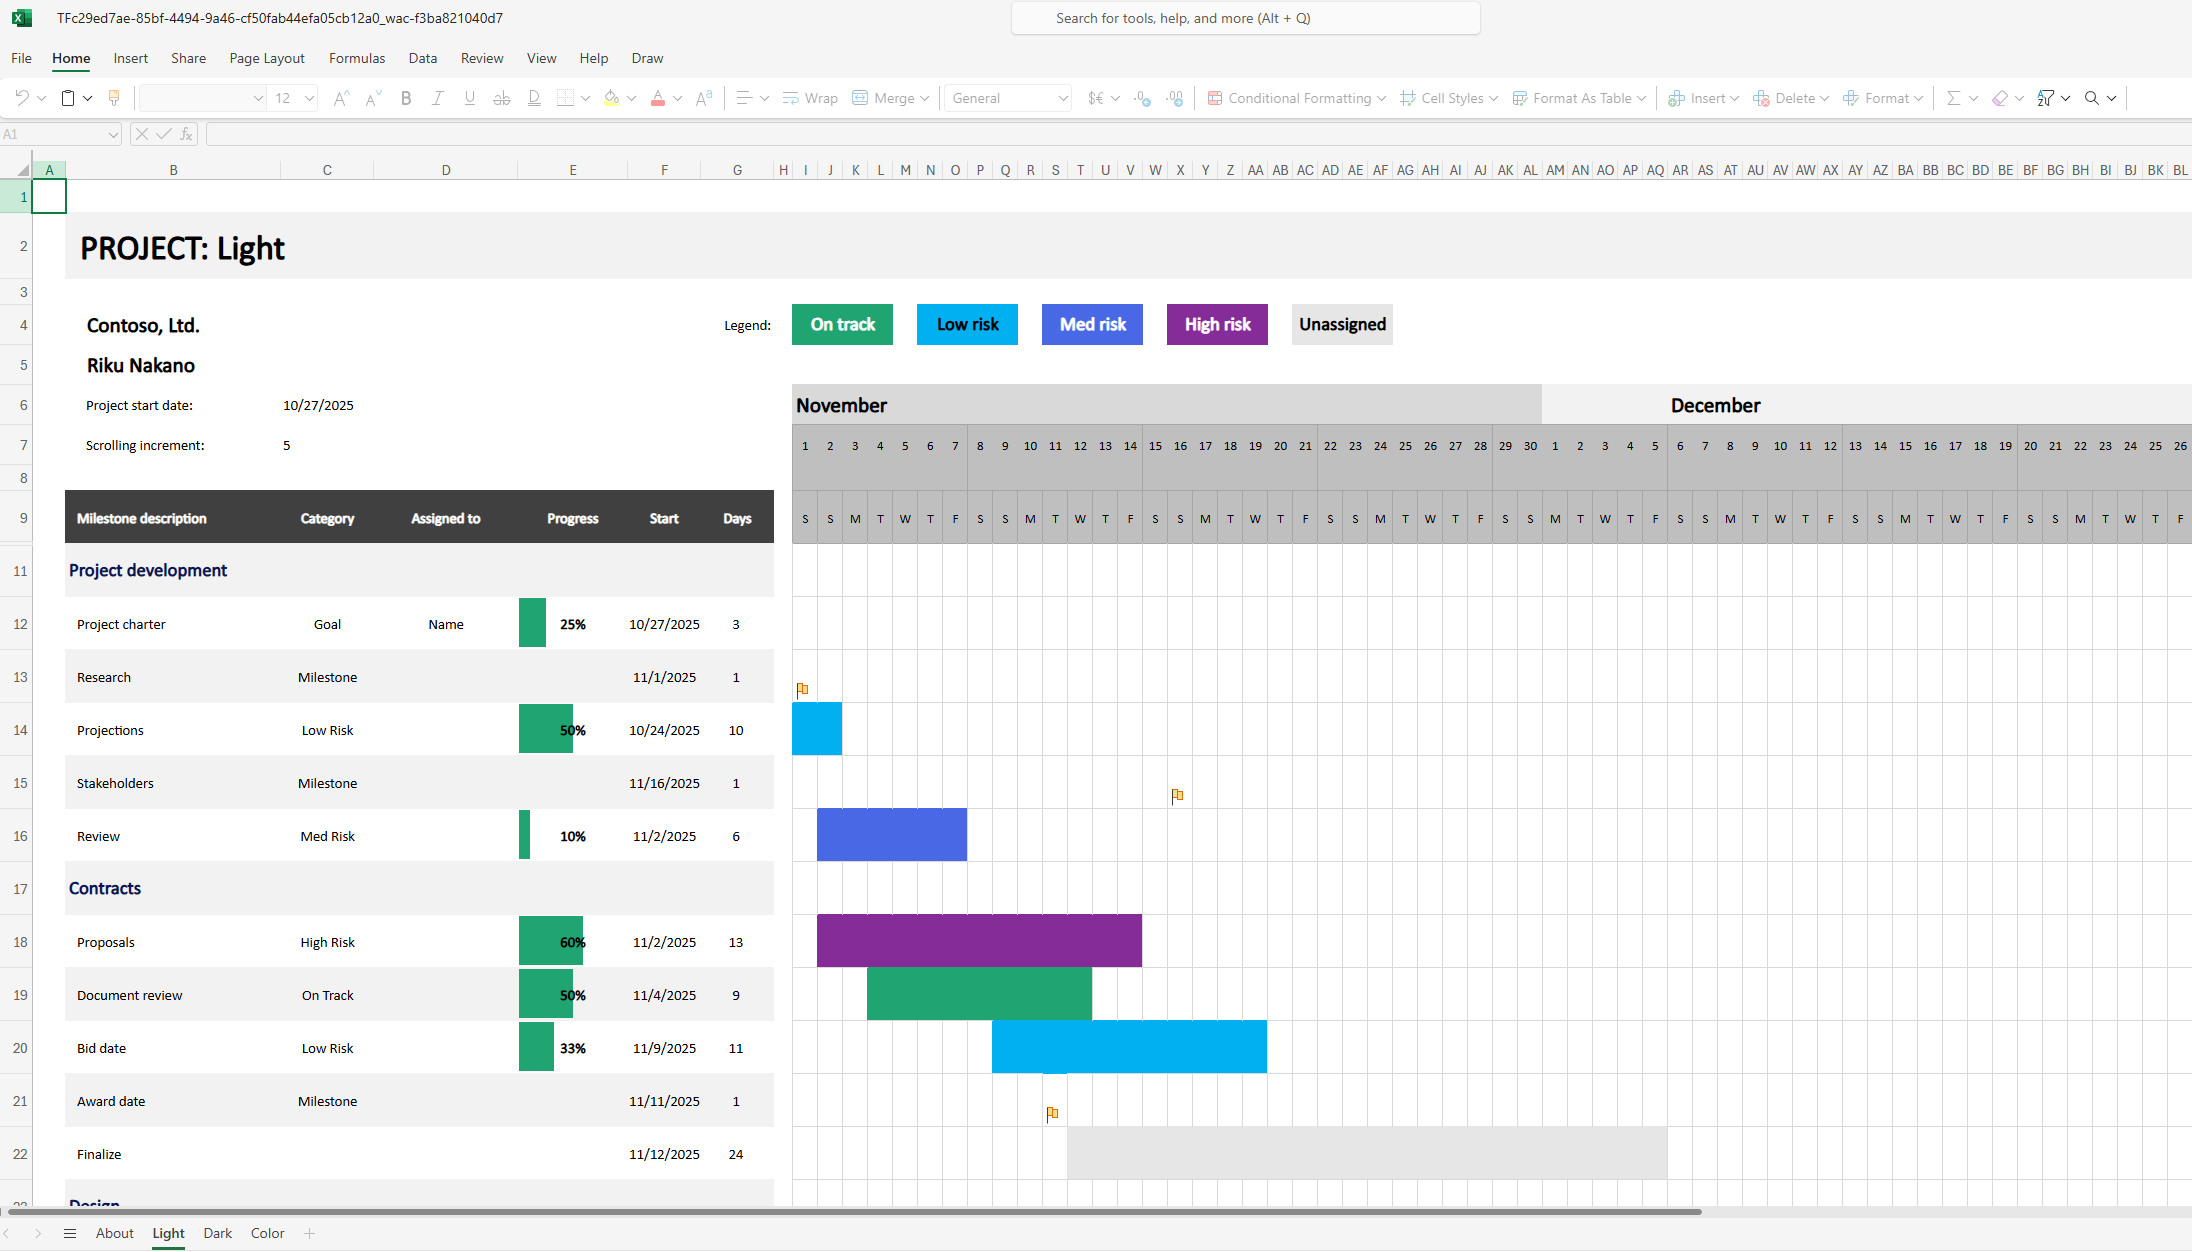
Image source: cloud.microsoft
Why use an Excel Gantt chart template?
A Gantt chart Excel template provides an easy and efficient way to plan, schedule, and visualize your projects without starting from scratch. It comes pre-formatted with task lists, timelines, and duration fields, allowing users to focus on execution rather than setup.
Benefits: These templates offer a quick, no-code setup process, making them accessible to anyone comfortable with Excel. They simplify project tracking and timeline management while keeping everything in one place.
Use cases: Perfect for freelancers, small business owners, and teams without dedicated project management software. Whether you're managing a short-term campaign, event plan, or product launch, a Gantt chart Excel template helps you stay organized, meet deadlines, and communicate progress clearly across your team.
How to create a Gantt chart in Excel
Creating a Gantt chart in Excel is easier than it looks. With just a few steps, you can transform your task list into a clear, visual project timeline that highlights start dates, durations, and progress. Below are two simple methods—using a stacked bar chart or conditional formatting, to help you build your own Gantt chart quickly and efficiently.
Method 1: Using a stacked bar chart
Step 1: Create a simple table with columns for Task name, Start date, End date, and Duration (calculated as End date minus Start date). Make sure each task has clear start and end dates, and the duration column is correctly calculated for accurate timeline plotting.
Step 2: Highlight the Task name, Start date, and Duration columns, then go to the Excel ribbon → Insert → select Bar Chart → choose Stacked Bar. This will create a basic visual where each task is represented as a horizontal bar, showing the timeline from start to finish.
Step 3: Customize the chart to resemble a Gantt chart: make the Start date series invisible by selecting it → right-click → Format Data Series → choose No fill; reverse the task order by right-clicking the vertical axis → Format Axis → check Categories in reverse order; adjust the horizontal date axis to match your project timeline; use colors to represent progress or status; optionally add milestone markers or labels. Finally, save the chart as an Excel template so it can be reused for future projects.
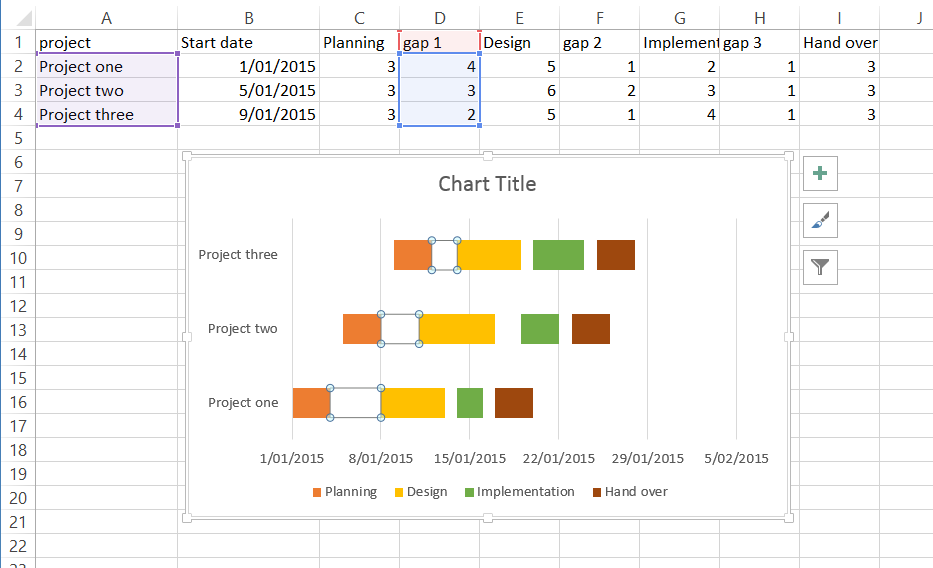
Image source: microsoft.com
Method 2: Using conditional formatting
Step 1: Create a table with the task name in column A and project dates across the top row (one column per day or week). Include columns for start date and end date for each task, so the formatting can accurately track the task duration.
Step 2: Select the grid area where you want the timeline to appear, then go to Conditional Formatting → New Rule → Use a formula to determine which cells to format. Enter the formula =AND(B$1>=$C2, B$1<=$D2) where B$1 is the column date header, $C2 is the task Start date, and $D2 is the task end date. Choose a fill color for the visual Gantt bars, ensuring each task is clearly represented along its timeline.
Step 3: Refine the visual timeline: adjust column widths so the bars appear continuous, hide unnecessary gridlines, and optionally add rules to highlight today's date or mark completed tasks. This will create a dynamic, easy-to-read project schedule that can be updated automatically as dates change.
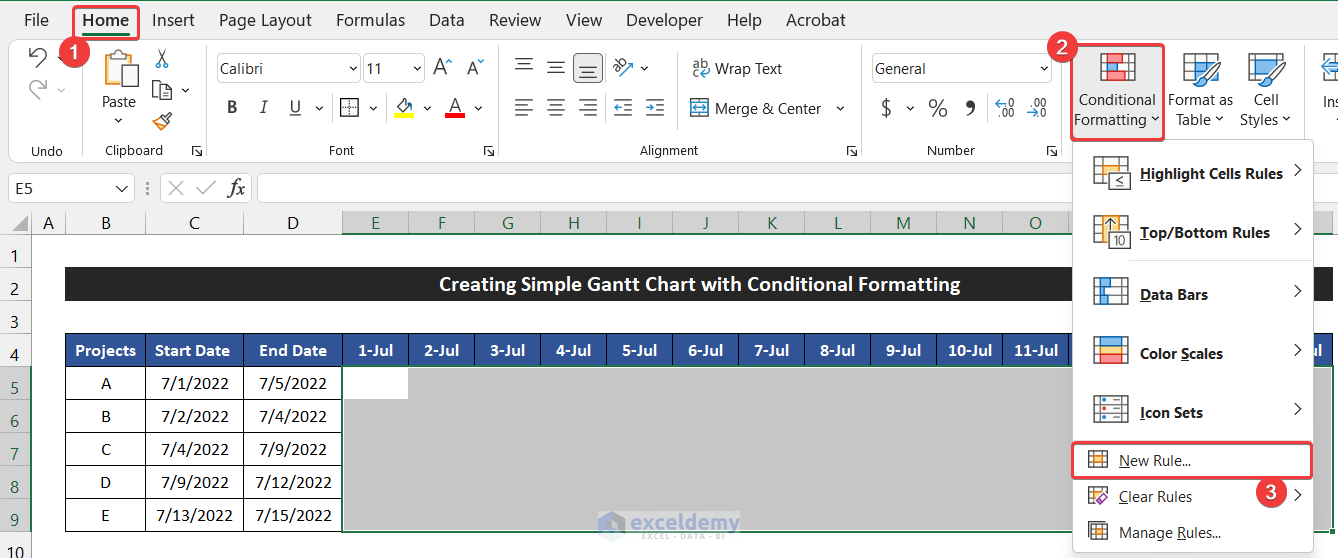
Image source: exceldemy.com
5 Best free Gantt chart Excel templates
Finding the right Gantt chart Excel template can save you hours of setup and help visualize project timelines instantly. The following free templates are reliable, easy to use, and suitable for different types of projects, from personal planning to team coordination. Here's a quick look at the best options available online.
1. TeamGantt Excel template
The TeamGantt Excel template is perfect for beginners and small teams who need a quick way to visualize project timelines. It offers a clean layout with task lists, start and end dates, and progress bars. Color-coded task bars make it easy to track progress at a glance. The template also includes a simple setup that doesn't require advanced Excel knowledge. It's ideal for freelancers, students, or managers who want a basic but effective project overview.
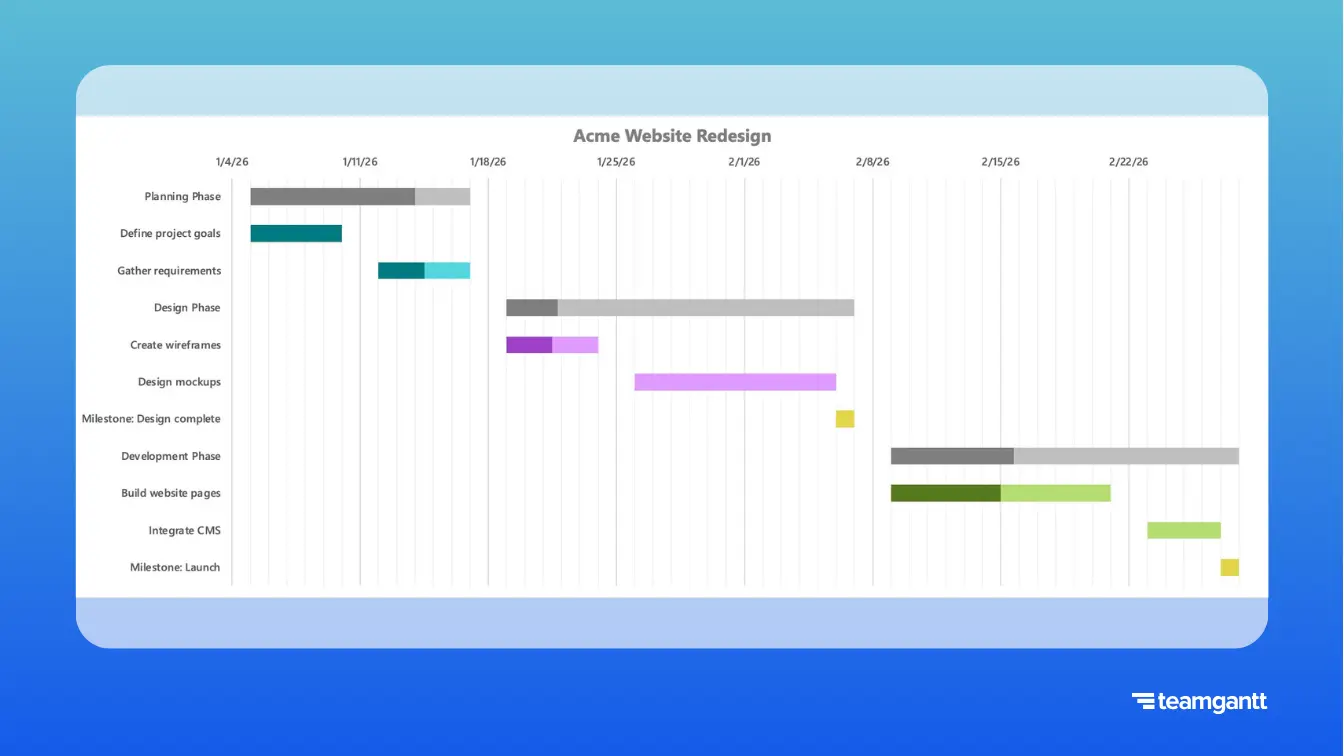
Image source: teamgantt.com
2. Vertex42 Excel Gantt template
The Vertex42 template is one of the most popular and versatile free Gantt chart templates available. It supports task dependencies, milestones, and customizable date ranges for flexible planning. Users can modify colors, gridlines, and chart scales to suit any project type. The built-in formulas automatically adjust bars when you change dates. It's highly recommended for users who want a detailed, professional-looking Gantt chart without needing specialized software.
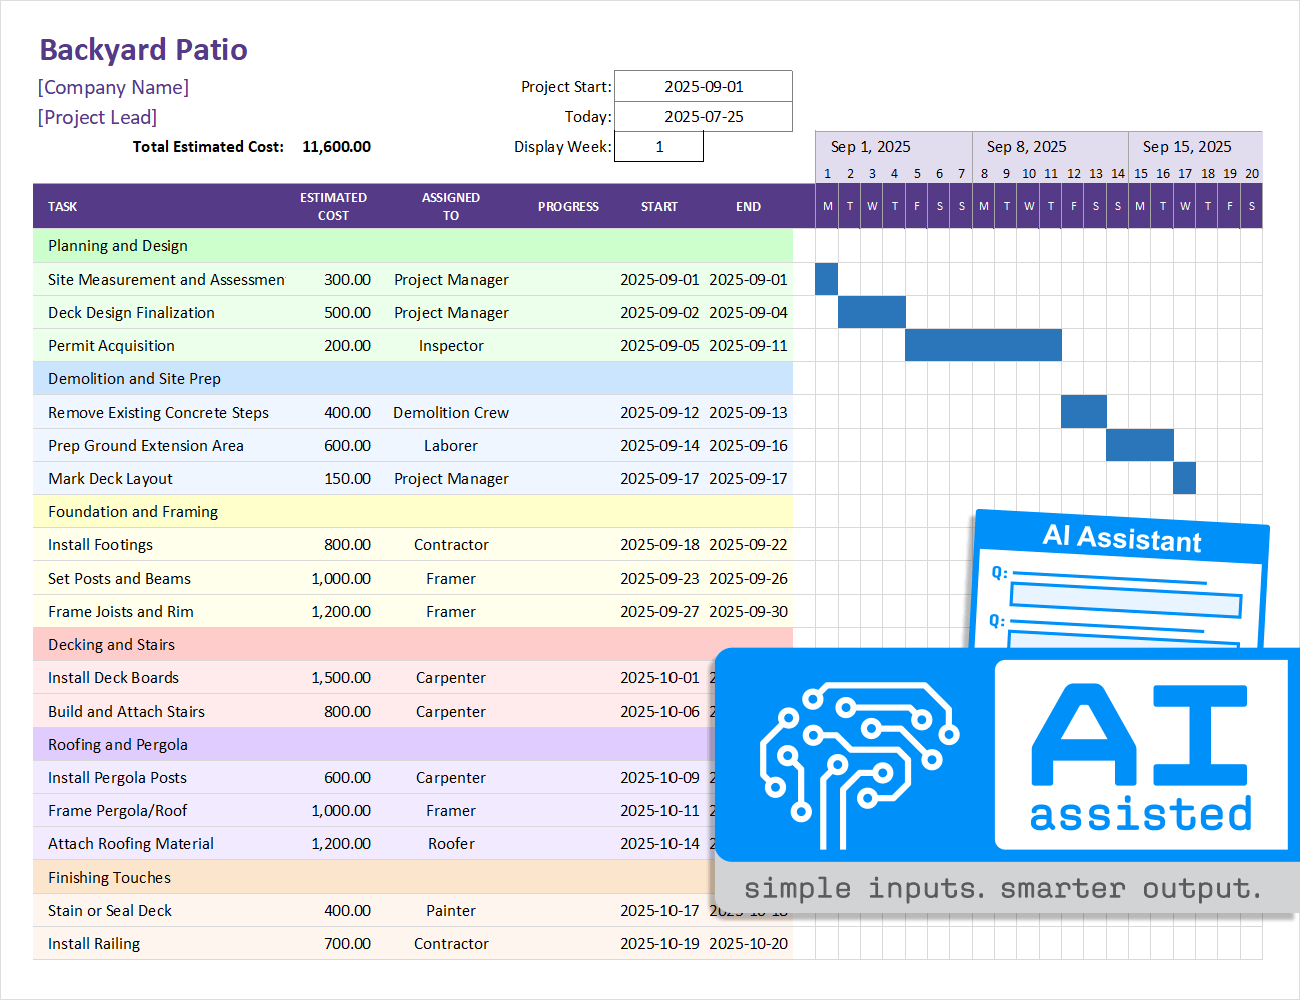
Image source: vertex42.com
3. ProjectManager Excel template
The ProjectManager Excel template provides a ready-to-use project plan complete with dependencies, task tracking, and resource allocation. It's designed for teams managing multiple projects or complex schedules. You can easily add team members, define roles, and visualize project progress on the timeline. The dynamic Gantt chart automatically updates as dates or durations change. This makes it great for mid-sized teams that need more control than a basic template offers.
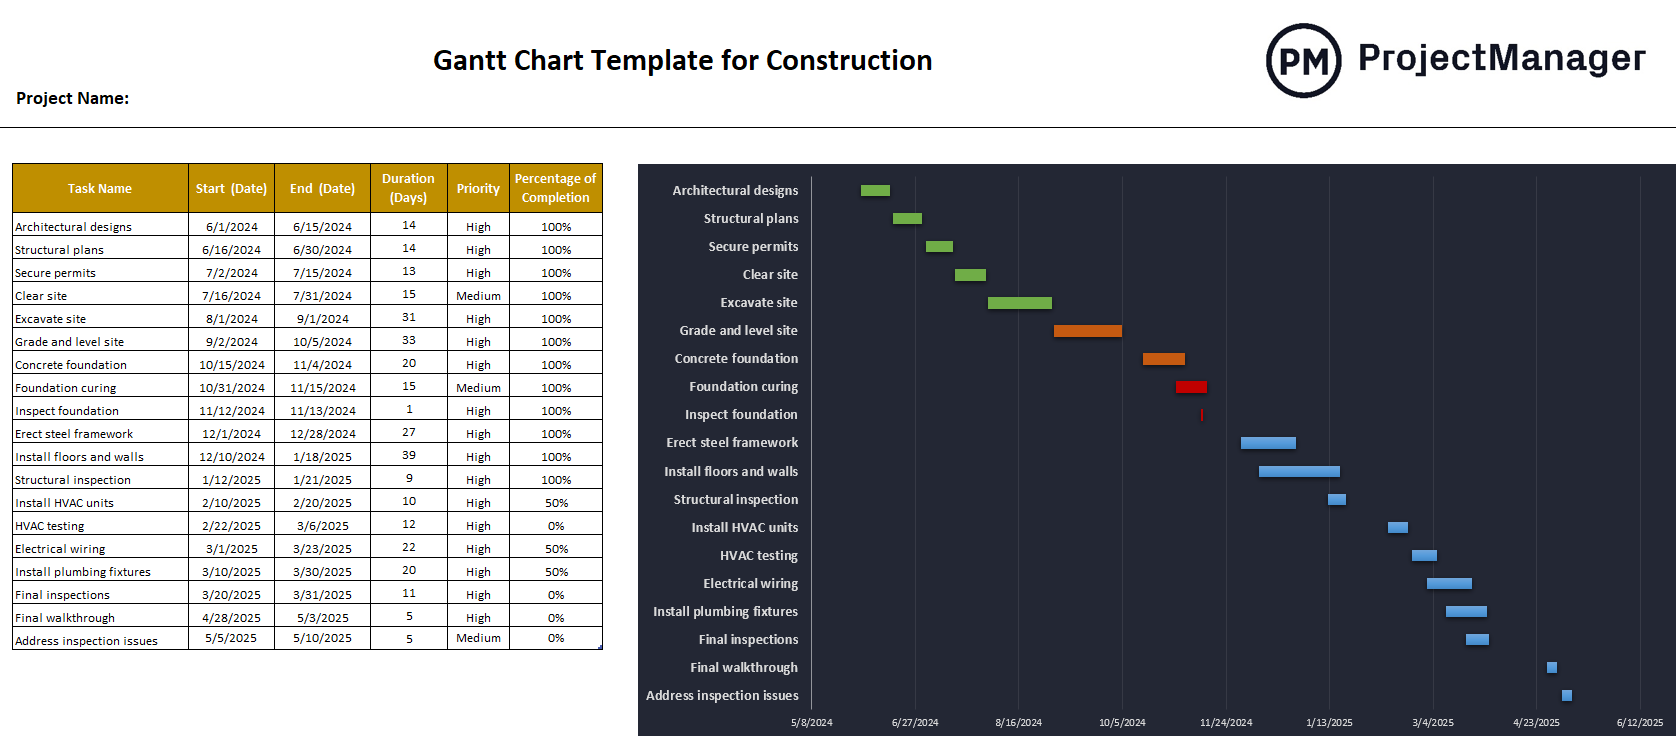
Image source: projectmanager.com
4. Office Timeline free Excel Gantt
The Office Timeline template focuses on visual presentation, making it ideal for reports, stakeholder updates, or executive summaries. It features a polished, professional design with clear color coding for tasks and milestones. The timeline is easy to adjust, ensuring your presentation stays up-to-date. It's particularly useful for marketing, design, or management teams who need to communicate timelines clearly. This template is presentation-ready and great for highlighting project milestones at a glance.
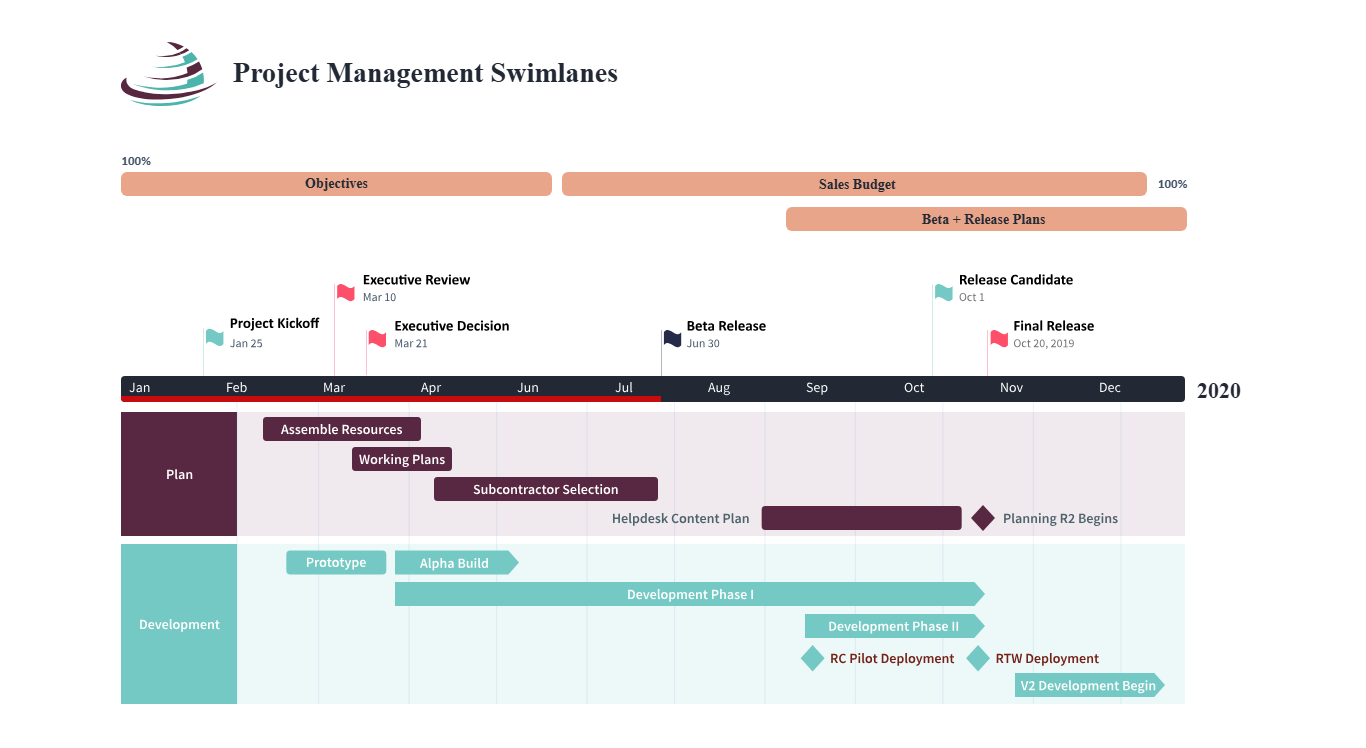
Image source: officetimeline.com
5. TemplateLab collection
The TemplateLab collection offers a wide range of free Excel Gantt templates for different needs daily, weekly, or monthly planning. Each template is formatted for quick customization, so you can easily plug in tasks and dates. Some versions include progress tracking and resource fields. With so many layout options, users can pick one that best fits their project scale. It's an excellent choice for professionals who prefer flexibility and multiple style options for project visualization.
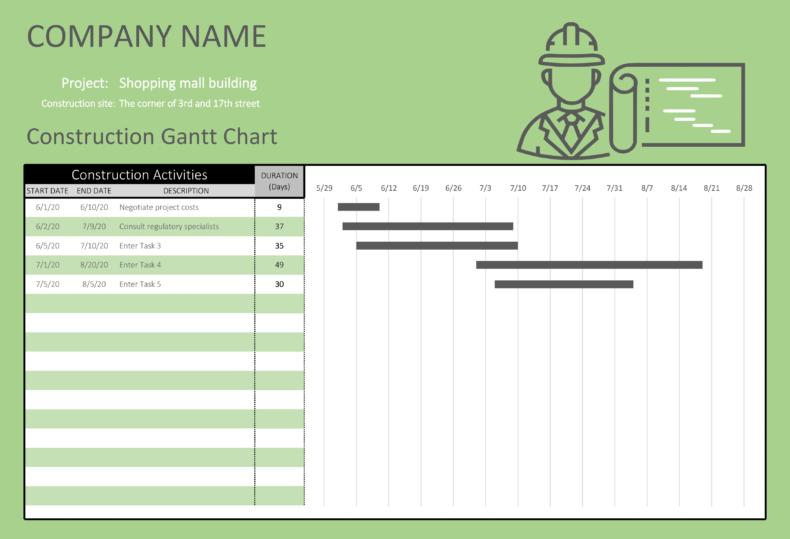
Image source: templatelab.com
Limitations of Gantt charts in Excel and how Lark helps solve them
While Excel can be a quick way to create simple Gantt charts, it quickly becomes restrictive as projects grow. Below are the key limitations teams face and how Lark overcomes each challenge with real-time collaboration, automation, and scalability.
1. Not real-time or collaborative
Limitation: In Excel, multiple users can't work on the same Gantt chart smoothly. Edits often cause version conflicts, file overwrites, or missing updates.
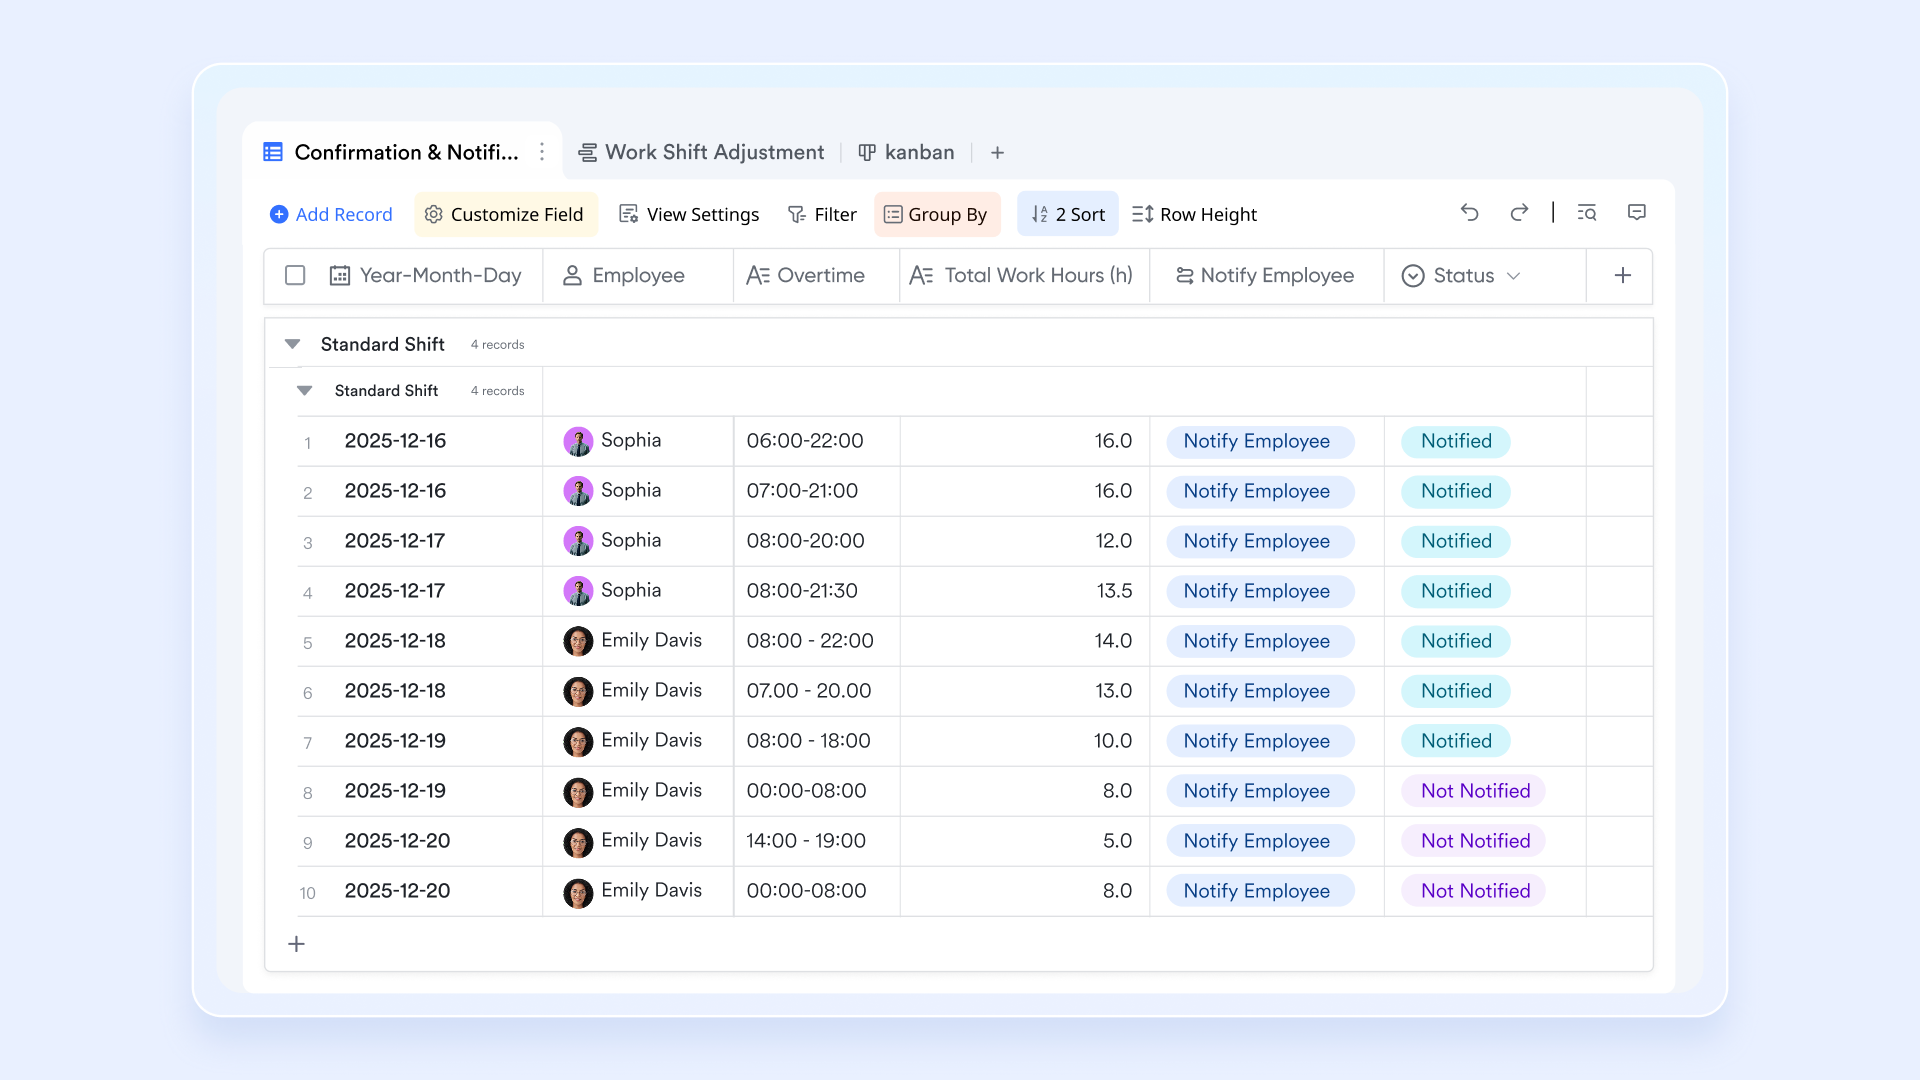
How Lark solves it: Lark Base allows multiple teammates to edit, comment, and update timelines simultaneously. Every change is synced instantly across all devices, with built-in version history to track revisions no need to email attachments or reconcile multiple files.
2. Manual updates required
Limitation: Excel Gantt charts rely on manual data entry for progress updates, deadlines, or dependencies, making them prone to errors and outdated information.
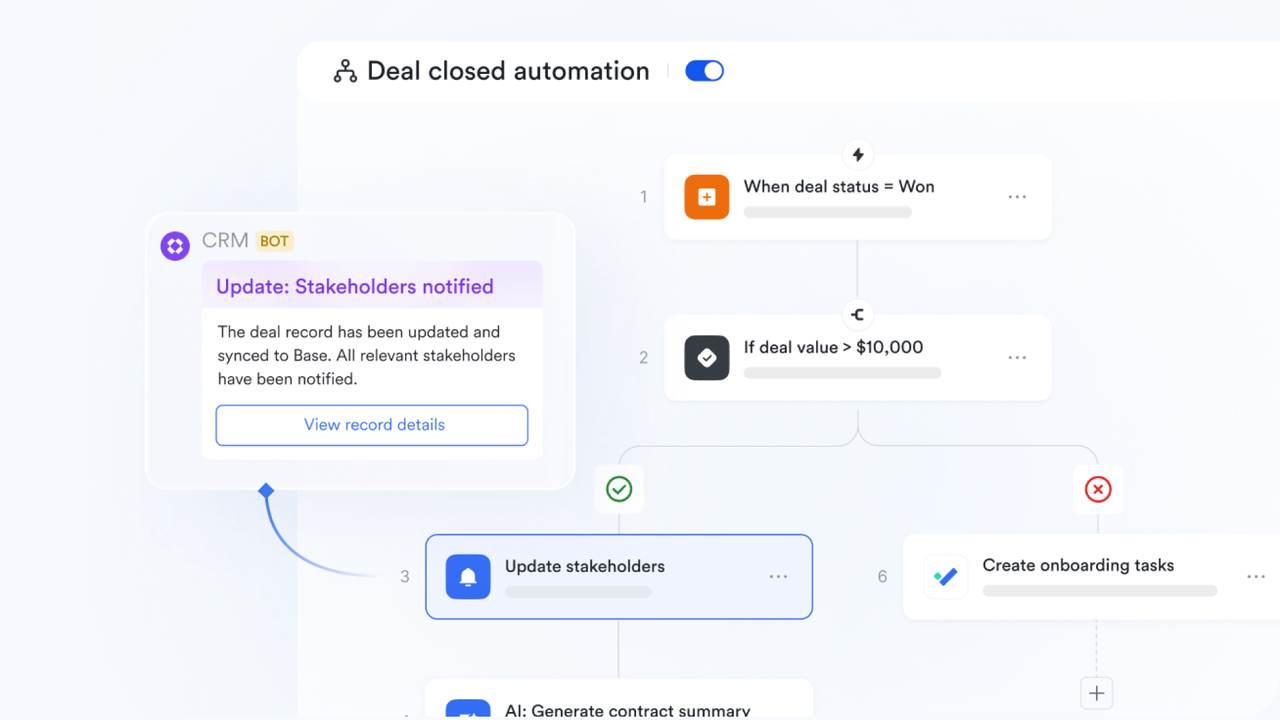
How Lark solves it: Lark automates progress tracking through Base's automation rules. For example, when a task status changes in Lark Tasks, the linked Gantt chart updates automatically. Managers can also set rules to trigger notifications or adjust dependencies without manual intervention.
3. Difficult to manage complex dependencies
Limitation: In Excel, linking dependencies between tasks requires formulas and manual adjustments, which become cumbersome in large projects.
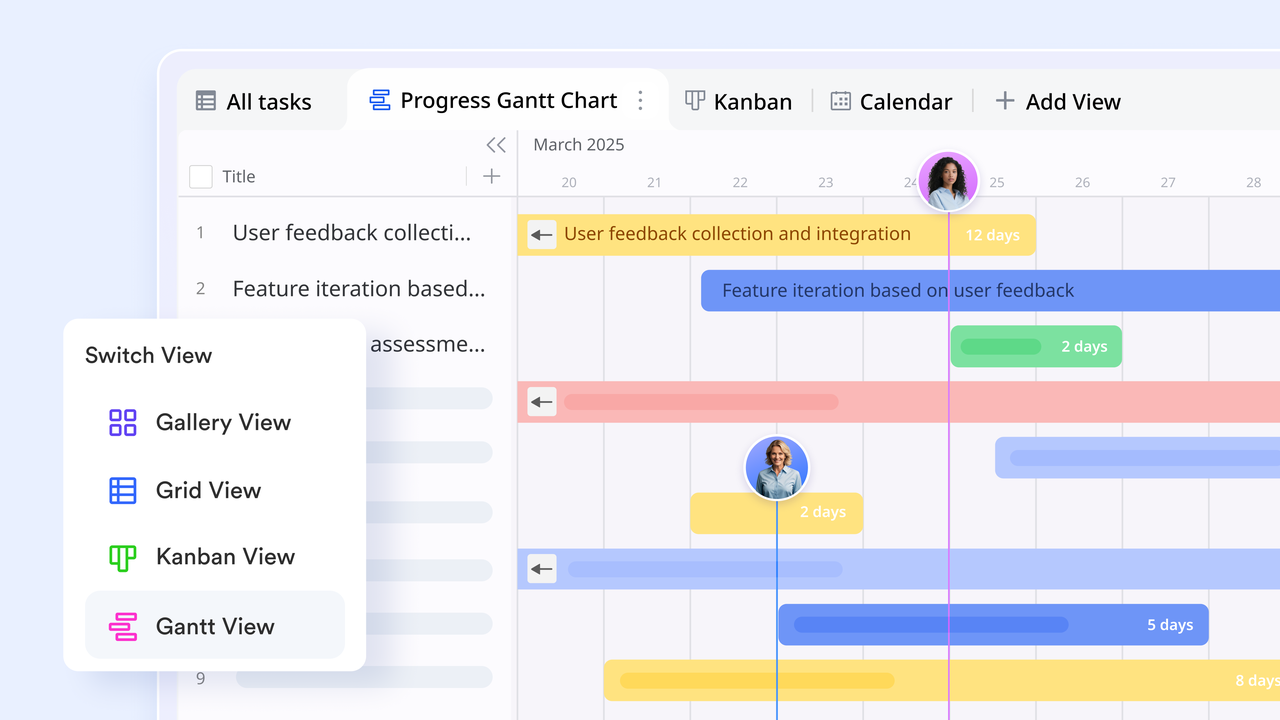
How Lark solves it: Lark Base's Gantt views let teams link tasks visually—dragging dependencies between bars with automatic recalculation of start and end dates. Any change in one task instantly reflects across related items, maintaining accurate timelines without complex formulas.
4. No visibility into accountability
Limitation: Excel lacks built-in ownership or accountability features, so teams can't see who's responsible for which task or whether it's on track.
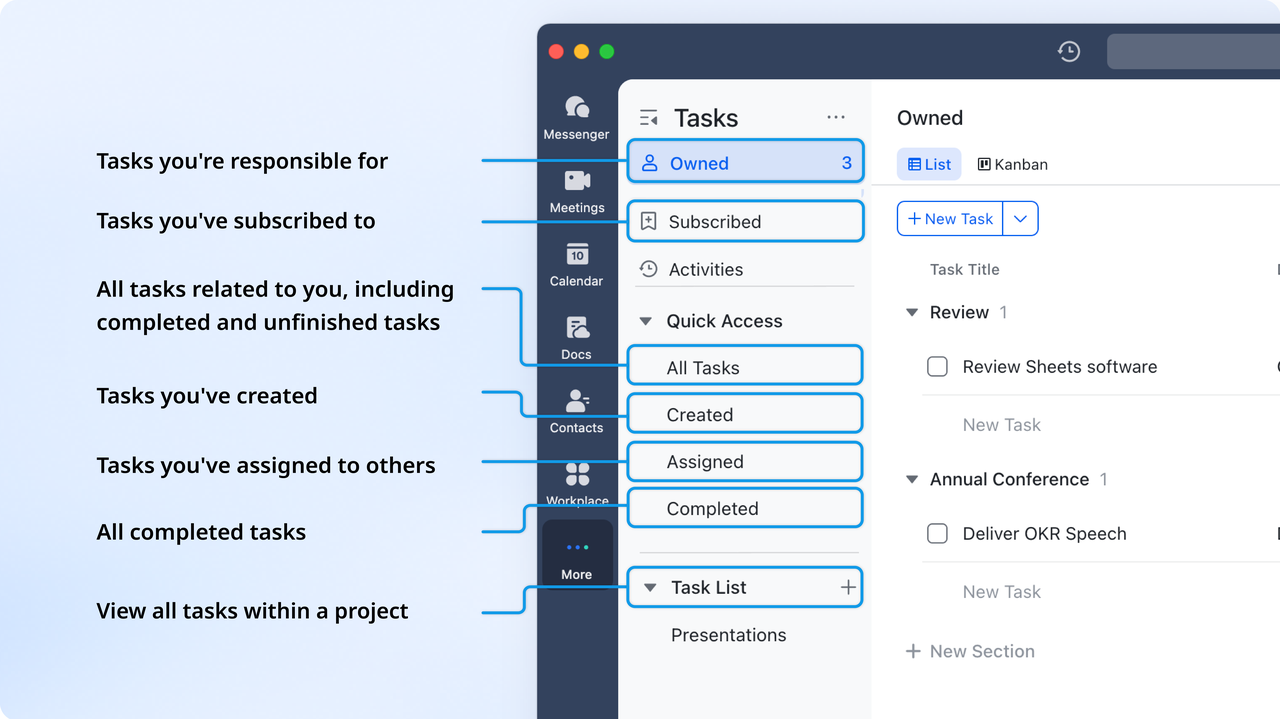
How Lark solves it: In Lark Tasks , each task is assigned to an owner with automated reminders. Visibility and tracking are limited to authorized members, ensuring privacy and focused collaboration.
5. Hard to scale across multiple teams or projects
Limitation: As teams expand or projects multiply, maintaining separate Gantt sheets becomes chaotic—there's no consolidated view across departments.
How Lark solves it: Lark Base provides cross-project dashboards that consolidate multiple Gantt charts into one unified view. Managers can filter by project, owner, or timeline to see organization-wide progress in seconds.
6. Limited collaboration with communication and reporting tools
Limitation: Excel Gantt charts operate in isolation, requiring constant switching to email, chat, or reporting tools for updates.
How Lark solves it: Lark's ecosystem connects Lark Base, Lark Messenger, Lark Docs, and Lark Meetings allowing users to discuss project updates, attach files, or schedule reviews directly from the Gantt view. Real-time notifications in Messenger keep every stakeholder informed without leaving the workspace.

7. Difficult to track progress visually
Limitation: Excel charts provide limited colour-coding and visual cues, making it harder to identify delays or bottlenecks at a glance.
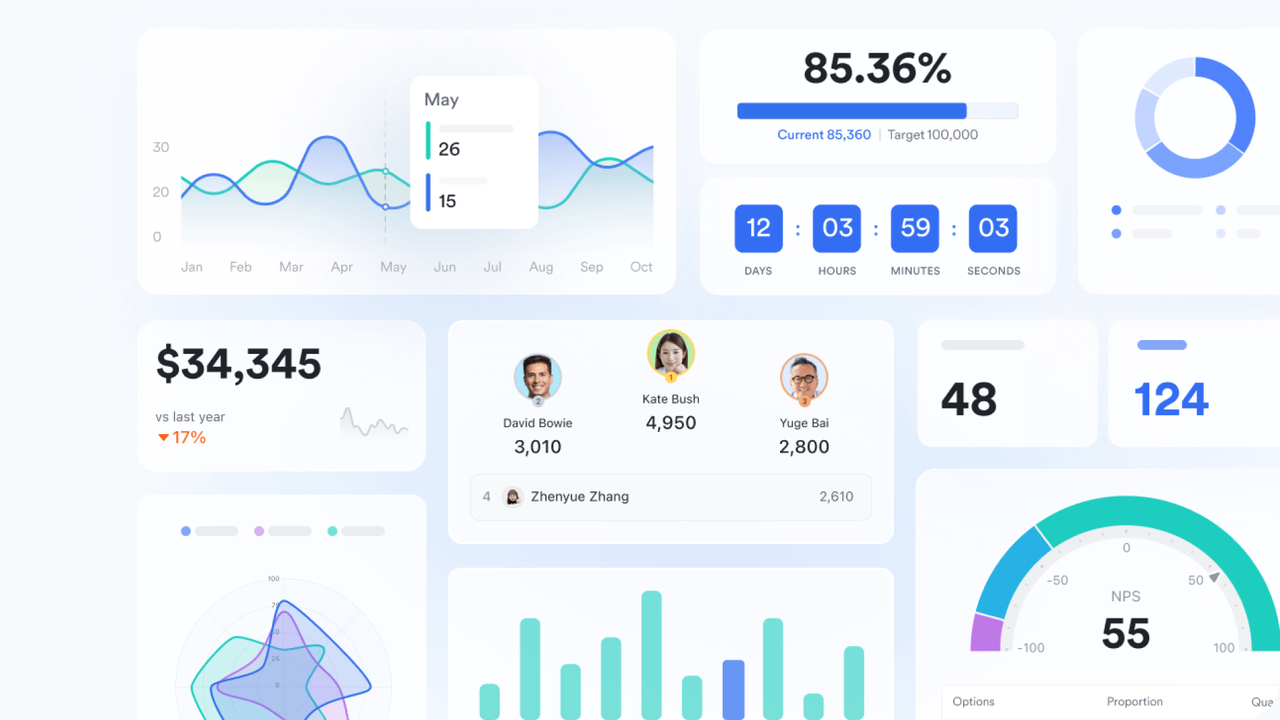
How Lark solves it: Lark's dashboards, views, and custom fields enable colour-coded task stages, milestone tracking, and live progress bars. Project managers can instantly see which stages are behind schedule or nearing completion.
Example of Lark free Gantt chart templates for your work
1. Project Gantt chart
A Gantt chart is a visual representation of a project schedule, displaying the start and finish dates of various elements of a project. This template allows you to create a Gantt chart for your project, enabling you to track progress, manage deadlines, and ensure that all tasks are completed on time. With Lark's user-friendly interface, you can easily update the chart as your project progresses, making it an invaluable tool for project managers and team members alike.
2. Project roadmap Gantt chart
The project roadmap Gantt chart template is a visual tool for project planning and tracking. It allows you to display the project timeline, the tasks involved, and who is responsible for each task. It also provides a clear view of the project's progress, with tasks displayed against time. This template includes features such as task view, project view, priority view, and status view. It also allows for customization of fields and settings, including filters, groups, and sorting options.
3. R&D personnel Gantt chart
The R&D personnel Gantt chart template is a comprehensive tool designed to help you manage your research and development team's tasks and projects. It provides a visual representation of the start and end times of the various tasks and projects assigned to your team members. This template includes fields for task status, priority, start time, end time, and the assigned personnel. It also allows for the addition of new records, customization of fields, and various view settings.
4. Employee task tracker
The employee task tracker template is a comprehensive tool designed to help you manage and track your team's tasks. It includes features such as task progress Gantt charts, task allocation, task leader Kanban, and task list filters. It also allows you to customize fields and add records as per your requirements. The template provides a clear view of task descriptions, deadlines, and the status of each task.
5. OKR management
The OKR management template is a comprehensive tool designed to help you manage your Objectives and Key Results (OKRs) effectively. It provides a structured way to track your yearly objectives, their priority, status, start and end dates. It also allows you to breakdown objectives into key results, and track their progress using a Gantt chart and a Kanban board. The template is customizable, allowing you to add records, customize fields, and adjust view settings to suit your needs.
6. Marketing content calendar template
The marketing content calendar template helps teams plan, organize, and manage content efficiently across multiple channels. Using Gantt charts, teams can visualize timelines, deadlines, and dependencies at a glance. Tasks, campaigns, and milestones are tracked in one unified workspace for clarity and accountability. Collaboration is streamlined, ensuring content is delivered on schedule and aligned with overall strategy.
7. Product development template
The product development template streamlines planning, task delegation, and progress tracking for product teams. Gantt chart views make it easy to coordinate launches, monitor dependencies, and track project milestones. Documents and resources can be attached directly to tasks for clarity and context. Teams stay aligned throughout each stage, ensuring projects are completed on time and according to plan.
8. DTC ecommerce product development template
The DTC ecommerce product development template is designed for fast-moving teams to bring products to market quickly. Gantt chart timelines allow teams to map plans, track progress, and manage responsibilities in one workspace. Tasks, launches, and milestones are clearly visualized, helping teams maintain focus and efficiency. This template supports streamlined workflows, ensuring timely product delivery and effective collaboration.
Lark's Gantt chart benefits
Lark combines powerful project visualisation with real-time collaboration and automation, helping teams work faster and smarter. Its Gantt chart features go beyond static timelines—bringing together communication, data, and workflows in one connected platform.
- Unlock efficiency and real-time collaboration
Lark enables teams to plan, assign, and track projects together in real time, reducing delays and confusion. Team members can chat, share files, and comment directly on tasks without switching tools, keeping discussions, decisions, and documents in context. This seamless collaboration ensures everyone stays aligned and up to date, whether in the office or working remotely.
- Comprehensive project management and automation
Manage timelines, dependencies, and resources seamlessly within a unified workspace. Lark supports automated workflows to update statuses, send reminders, or trigger dependent tasks automatically, helping teams maintain progress without manual follow-ups. Tasks, milestones, and project stages can be tracked in real time, making it easier to monitor completion and adjust plans as needed.
- Data-driven insights and productivity monitoring
Generate analytics and reports to measure project performance, team productivity trends, and workload balance. Real-time task tracking allows managers to instantly view updates as team members complete or modify tasks, helping identify bottlenecks, prioritize work, and make informed, data-driven decisions across projects.
- All-in-one platform and cross-platform collaboration
Lark connects with tools like Docs, Messenger, and Meetings, and supports integration options like Excel and Gmail, enabling smooth coordination across platforms. Teams can streamline communication and keep work organized in one ecosystem, reducing the need to juggle multiple apps while maintaining clarity and accountability throughout the project lifecycle.
- Flexible, customizable, and secure solutions
Adapt templates, fields, and workflows to fit your team's specific project needs and structure. Lark supports distributed teams with cloud-based access, allowing remote collaboration anywhere. At the same time, enterprise-grade security and permission controls protect sensitive project data, ensuring both flexibility and safety for all users.
Conclusion
Excel Gantt chart templates are a great starting point for individuals, freelancers, and small teams managing simple projects. They allow easy visualisation of tasks, deadlines, and progress without needing special software. However, as projects expand and multiple people need to collaborate, Excel's manual updates, limited automation, and lack of real-time synchronisation can slow productivity and cause version issues.
This is where Lark offers a smarter alternative, combining Gantt charts with built-in collaboration, automation, and live updates. Teams can edit timelines together, link tasks, track progress automatically, and communicate directly within one workspace. In short, Excel works for simple tracking, but Lark scales seamlessly with your team's growing project management needs.
FAQs
Can I customize a Gantt chart Excel template?
Yes, Excel Gantt templates are fully customizable. You can edit task names, dates, colors, and progress bars to match your project's needs. Many templates also let you add milestones, dependencies, and conditional formatting for better tracking
Are Excel Gantt templates free to use?
Yes, many reliable sources offer free Gantt chart Excel templates online. They can be downloaded, edited, and reused without licensing fees. However, some advanced templates may require a paid version or add-on for extra features.
What is the difference between a simple Gantt chart template Excel and online Gantt tools?
An Excel template provides a static chart requiring manual updates. Online Gantt tools, like Lark, offer real-time collaboration, automation, and progress tracking. They're better suited for teams managing complex or multi-department projects.
Can I share Excel Gantt charts with my team?
Yes, you can share Excel files through OneDrive, Google Drive, or email. However, simultaneous editing can cause version conflicts or data loss. Online collaboration tools handle shared access and live updates more efficiently.
How does Lark compare to Excel for project management?
Lark combines Gantt charts with collaboration, automation, and collaborated communication tools. Unlike Excel, it updates in real time and supports teamwork across departments. It's ideal for scaling from simple timelines to full project ecosystems.
Related reading
Table of contents
Start using Lark today

Manage all your work in one place
Boost team efficiency by 10x
Save up to 70% on software costs
Table of contents
Start using Lark today
Manage all your work in one place
Boost team efficiency by 10x
Save up to 70% on software costs
Keep reading







2026 Lark Technologies Pte. Ltd.
Headquartered in Singapore with offices worldwide.






Explore: