














Boost Team Productivity with Gantt Charts in Project Management

Ryan Tanner
Product Marketing Specialist
Sep 18, 2026
Ryan Tanner
Sep 18, 2026

15 min read


In project management, clarity and coordination are key to keeping tasks on track and deadlines met. A Gantt chart in project management is one of the most effective tools for visualizing project timelines, task dependencies, and team responsibilities. To give you the full picture of how you should use Gantt chart in project management and which templates, this guide will provide a detailed guide. Let's follow our steps and discover more than the knowledge that resides in your mind.

What is a Gantt chart in project management?
Gantt charts are project management tools that visually map out tasks, timelines, and dependencies. Each task appears as a horizontal bar on a calendar-style grid, showing when work starts, how long it will take, and how tasks overlap or rely on each other. This visual layout helps teams see the overall flow of work, identify scheduling gaps, and coordinate responsibilities clearly.
The Gantt chart was developed by Henry Gantt in the early 1900s to bring structure and visibility to complex production schedules. Originally used in industrial and construction projects, it soon became a standard for planning and tracking work across many fields — from product development and marketing campaigns to research and operations. Its value lies in its simplicity: one chart showing who is doing what, when, and how each task connects.
More than a century later, Gantt charts continue to be one of the most effective ways to plan and monitor progress. They help managers balance workloads, meet deadlines, and maintain accountability. Modern platforms like Lark enhance this classic format by pairing visual timelines with real-time collaboration, automated task updates, and connected communication. With Lark, teams can plan projects, track milestones, and manage dependencies in one shared workspace — keeping every project organized and transparent from start to finish.
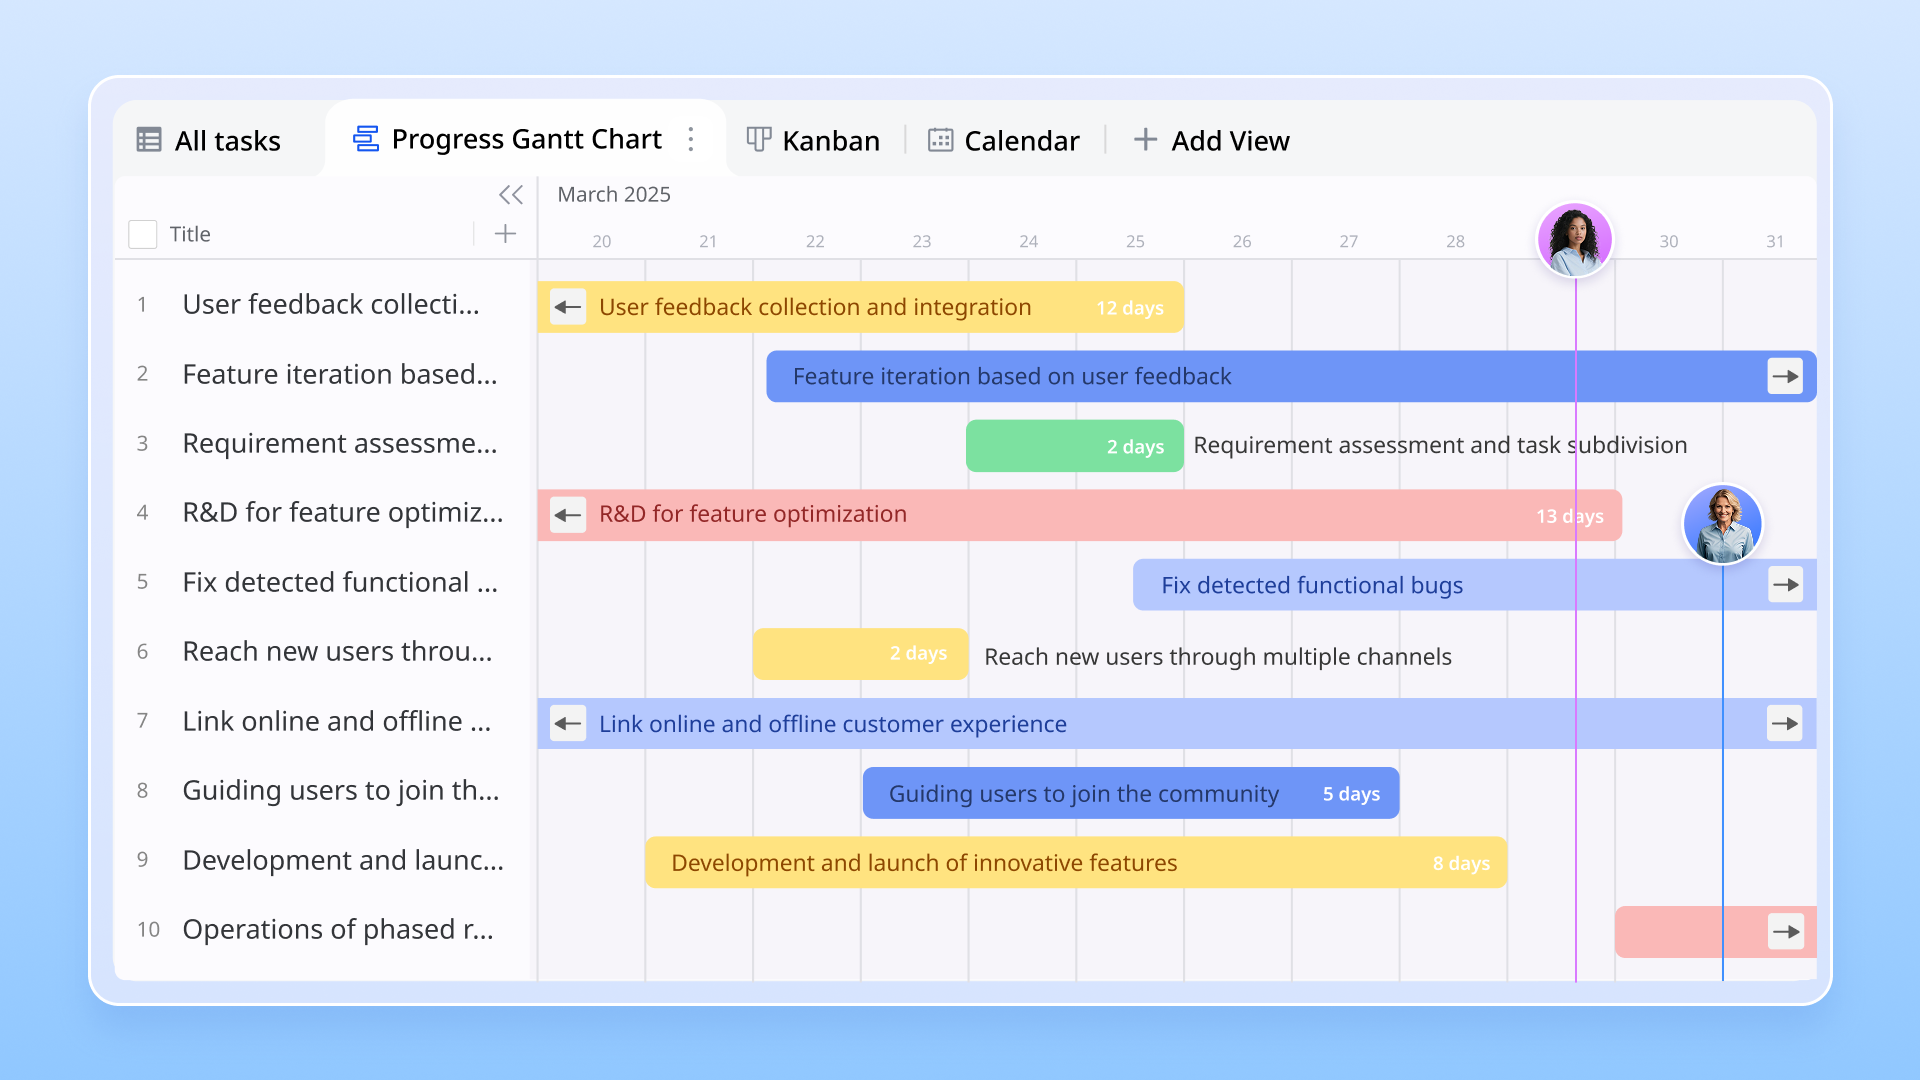
Key components of a Gantt chart
- Timeline and calendar: The timeline runs horizontally across the chart and shows the project duration, typically broken down into days, weeks, or months. It provides a clear view of when tasks start and end.
- Tasks and subtasks: Each task is represented by a horizontal bar along the timeline. Subtasks break larger tasks into manageable pieces, making it easier to track progress and assign responsibilities.
- Dependencies: Dependencies show which tasks rely on others to start or finish. This helps identify critical paths and prevents delays from cascading across the project.
- Milestones: Milestones mark important deadlines, goals, or achievements within the project. They provide reference points to measure progress and celebrate key accomplishments.
- Progress tracking: Many Gantt charts allow you to track the percentage of work completed for each task. This helps monitor performance, identify bottlenecks, and keep the project on schedule.
How to use a Gantt chart effectively
Step 1: Define project scope and tasks
Start by listing all the tasks required to complete the project. Break larger tasks into smaller, manageable subtasks to ensure nothing is overlooked.
Step 2: Assign responsibilities
Clearly assign each task or subtask to a team member. This establishes accountability and ensures everyone knows what they are responsible for.
Step 3: Add dependencies and milestones
Identify which tasks depend on others and mark key milestones. Dependencies help prevent delays from cascading, while milestones highlight critical goals and deadlines.
Step 4: Track and update progress regularly
Regularly update the Gantt chart with task completion and timeline adjustments. This keeps the project on schedule, helps spot bottlenecks early, and ensures team alignment.
Benefits of Gantt charts in project management
- Clear visualization of project timelines: Gantt charts provide a visual overview of all tasks and their schedules, making it easy to see how a project progresses from start to finish.
- Improved task allocation and accountability: Assigning tasks to specific team members ensures everyone knows their responsibilities, reducing confusion and increasing ownership.
- Easier progress tracking against deadlines: By monitoring task completion and timelines, project managers can quickly identify delays and adjust plans accordingly.
- Identification of bottlenecks and dependencies: Gantt charts highlight which tasks depend on others, helping teams anticipate and resolve potential blockers before they affect the project.
- Better collaboration across teams: Visual timelines, shared updates, and clear task assignments promote communication and coordination, ensuring everyone stays aligned on project goals.
Examples of Gantt charts in different industries
Gantt charts are versatile and adaptable across a wide range of industries. Whether managing short-term projects or long-term programs, they provide a structured view of timelines, dependencies, and progress. Here are a few examples of how different fields use Gantt charts effectively:
- Software development: Sprint planning
- In software teams, Gantt charts help plan sprints, track feature development, and manage release schedules. They make it easy to visualize task dependencies between developers, testers, and designers. Teams can quickly see what's in progress, what's next, and how delays in one stage could impact the release timeline.
- Marketing: Campaign launches
- Marketing teams use Gantt charts to coordinate multi-channel campaigns. From content creation and ad scheduling to social media rollout and performance tracking, every step can be plotted visually. This helps keep designers, writers, and analysts aligned, ensuring campaigns launch on time and within budget.
- Construction: Scheduling site activities
- In construction projects, timing is everything. Gantt charts help plan site activities such as excavation, manufacturing, foundation work, inspections, and finishing tasks. They highlight dependencies between contractors and suppliers, making it easier to avoid bottlenecks and ensure that each stage begins only when the previous one is completed.
- Education: Academic project planning
- Educators and students use Gantt charts to manage research projects, startups, thesis timelines, and coursework schedules. By mapping key milestones—like proposal submission, data collection, and final presentation—they can stay organized and avoid last-minute rushes.
Across industries, Gantt charts serve as a powerful project planning tool that turns complex timelines into clear, actionable plans.
Start practice: Use Lark to create the desired Gantt chart
Lark enables teams to organize, visualize, and carry out projects smoothly through dynamic Gantt charts that illustrate timelines and task dependencies effectively. By providing functionalities such as team messaging, task tracking, and document sharing in a single cohesive workspace, Lark ensures teams remain aligned and productive.
Its adaptable Gantt chart view permits project managers to outline milestones, modify schedules in real-time, and keep all stakeholders updated. Teams can communicate about progress directly within the same platform, reducing silos and confusion. Whether overseeing intricate Agile workflows or straightforward project timelines, Lark facilitates effortless and transparent collaboration.
Lark Base: Interactive Gantt-style timelines with built-in workflow automation
Lark Base turns traditional project plans into dynamic, real-time Gantt-style timelines that bring complete visibility to every stage of execution. Teams can map start and end dates, assign owners, and link task dependencies to see how one change affects the rest of the schedule instantly. When timelines shift, Base updates automatically, keeping the entire team aligned on progress and priorities.
Beyond visualization, Base also includes powerful automation capabilities that remove repetitive manual steps. Custom rules can automatically update task statuses, send reminders for approaching deadlines, or trigger follow-up actions when a phase is completed. These smart workflows ensure that no milestone is overlooked and that every project stays on track from planning to delivery.
Example: A marketing team uses Lark Base to manage a product launch. When the "Design" phase finishes, Base automatically marks it as complete, notifies the "Content" team to start the next stage, and updates the Gantt timeline to reflect the new progress—keeping everyone informed without extra coordination.
Real-time task syncing through Lark Tasks
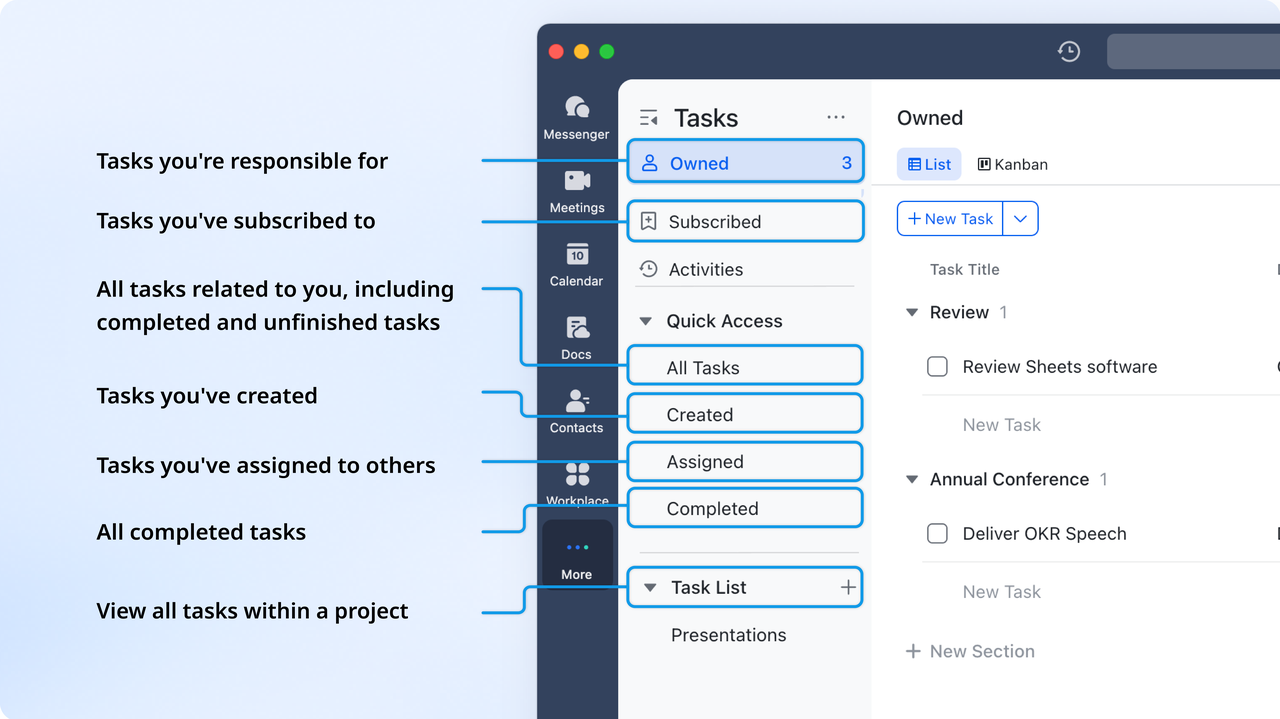
Tasks created from chats, Docs, or directly within Lark Base are linked to their project records. Progress made in Lark Tasks updates Base instantly, ensuring the Gantt timeline always reflects the latest status without manual updates. This live synchronization keeps day-to-day execution aligned with strategic plans.
Example: When a designer marks a creative asset as complete in Lark Tasks, the corresponding record in Base updates instantly, shortening the Gantt bar and giving the entire team real-time visibility on progress.
Seamless sync with Lark Docs and Lark Messenger
Every Lark Base record can be connected to the relevant document and chat thread, keeping context close to the data. This means project teams don't waste time switching between tools or searching for background discussions. Instead, they can open linked Lark Docs or Lark Messenger threads directly from the Base view for instant reference.
Example: During a milestone review, the project team opens the linked creative brief in Lark Docs straight from the Base record. They review client feedback in the associated Messenger thread and finalize changes without leaving the workspace.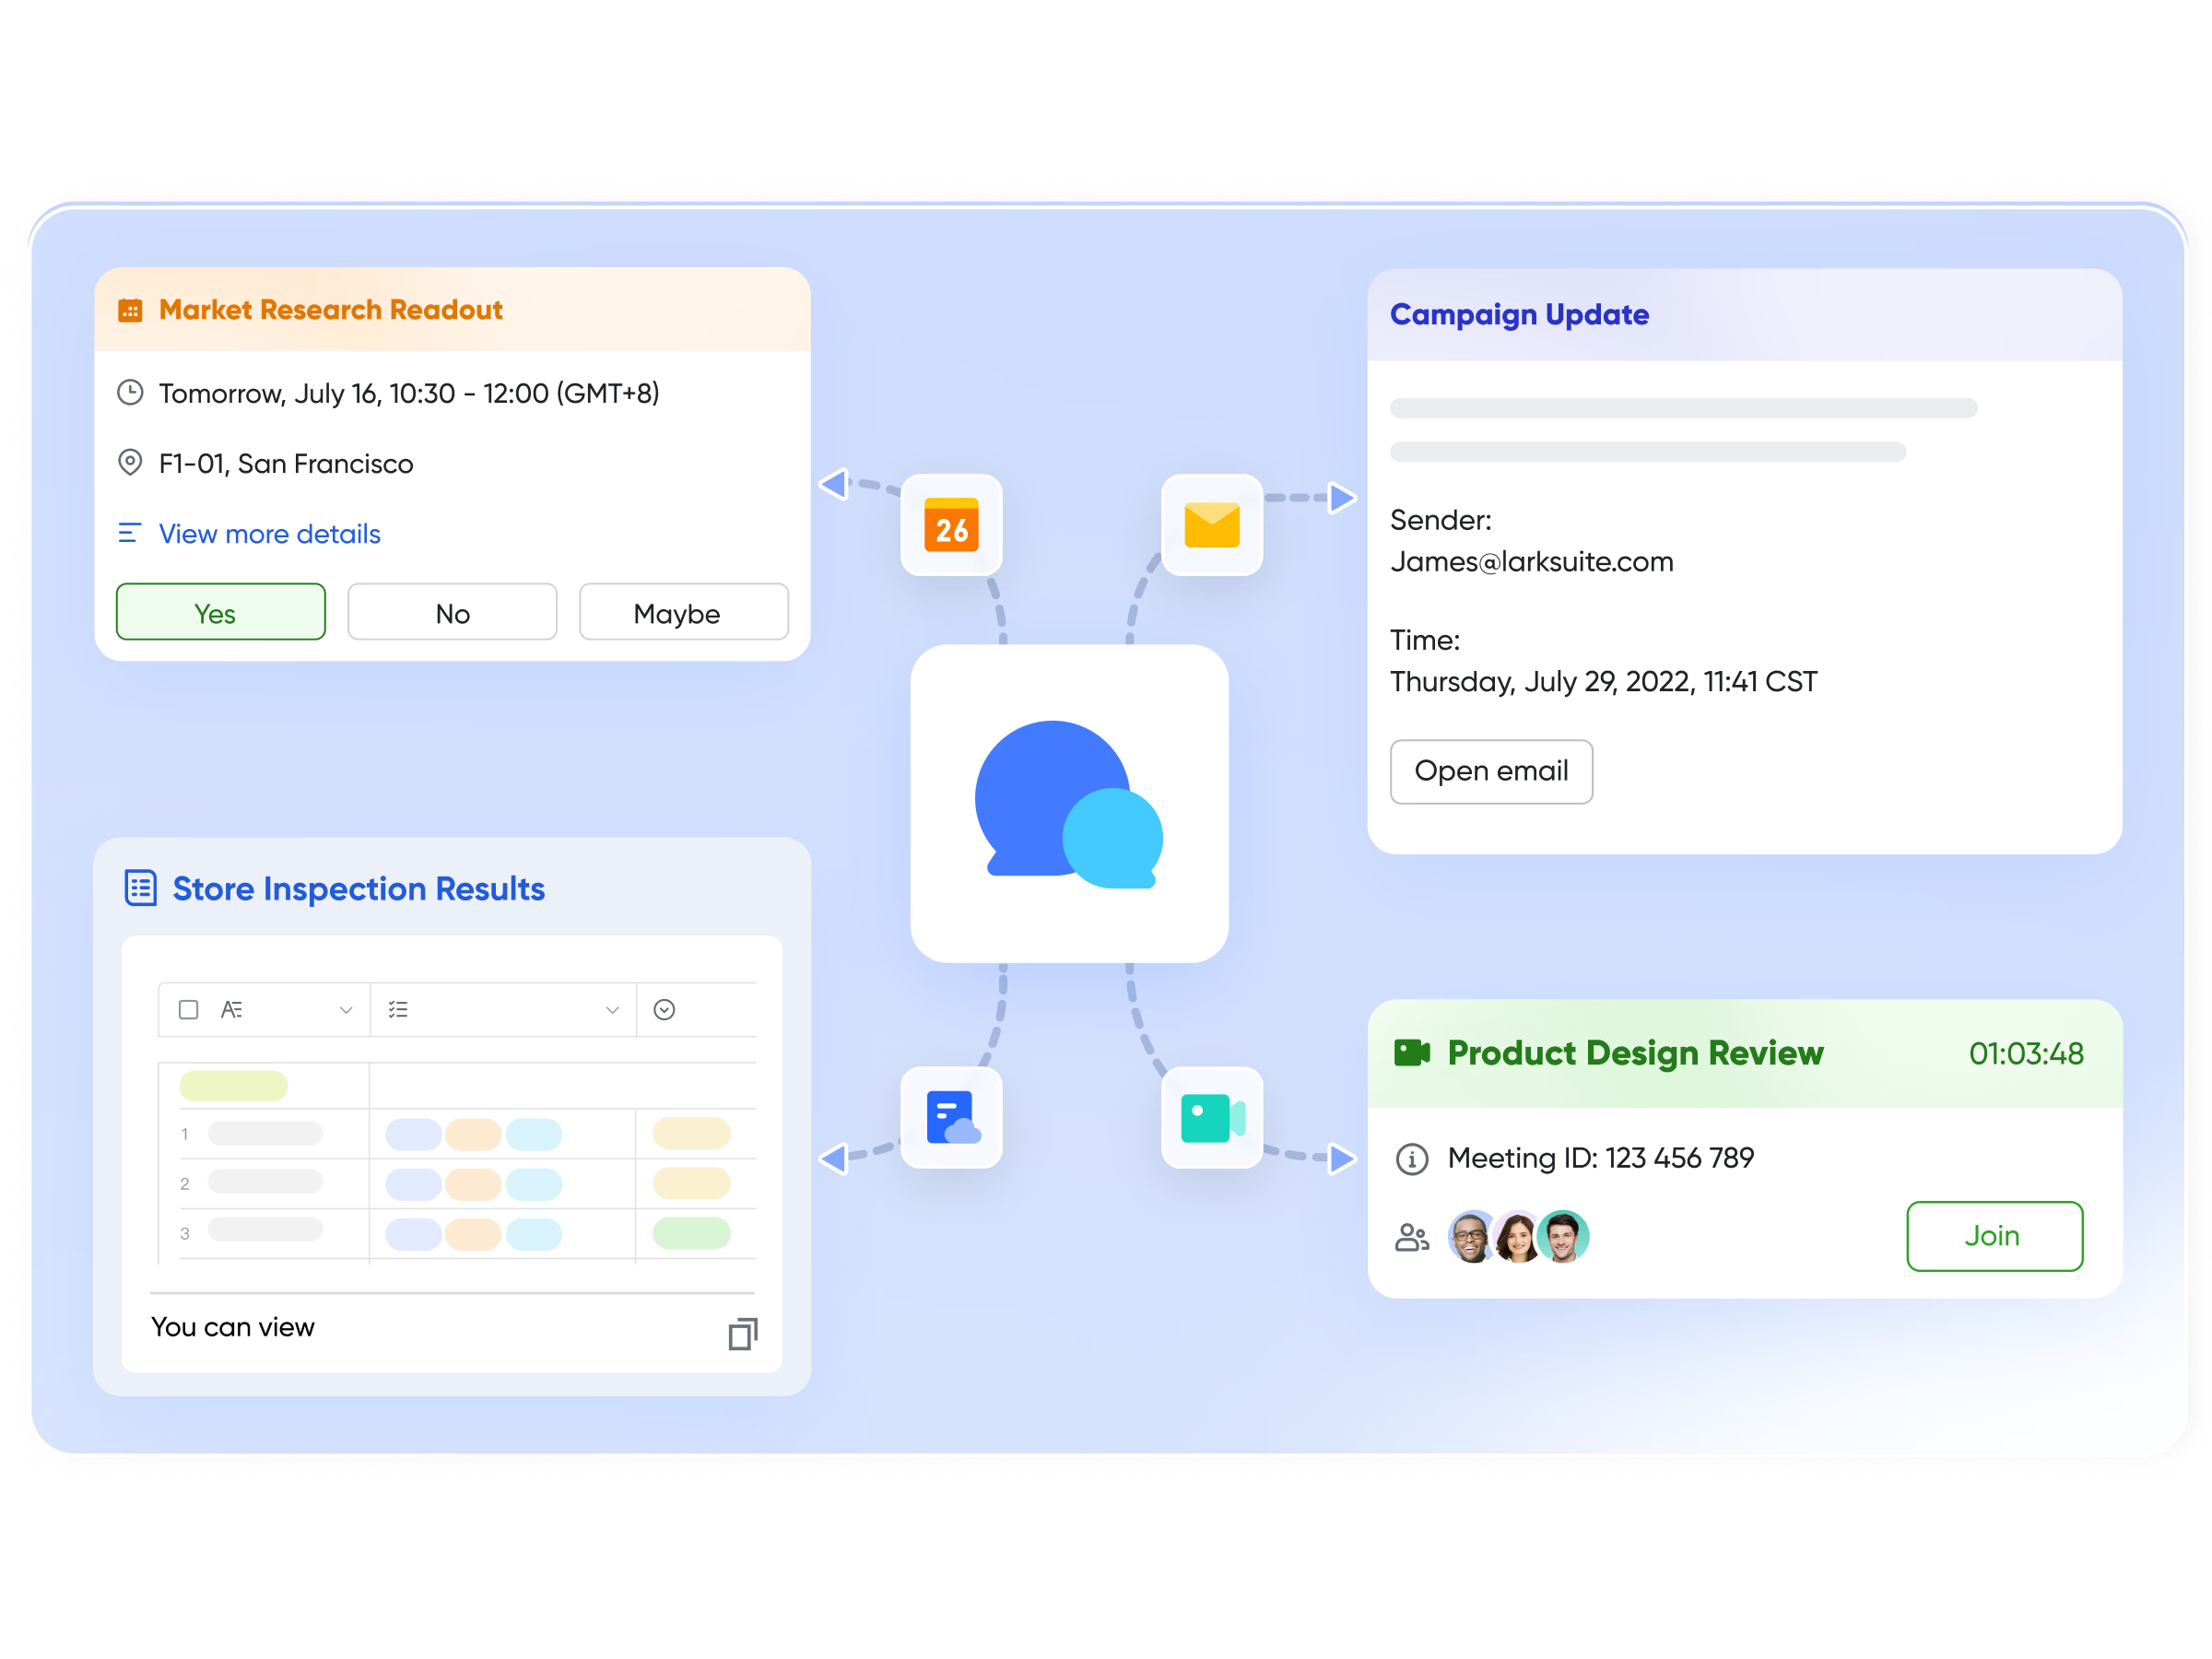
Milestone planning and calendar tracking through Lark Calendar
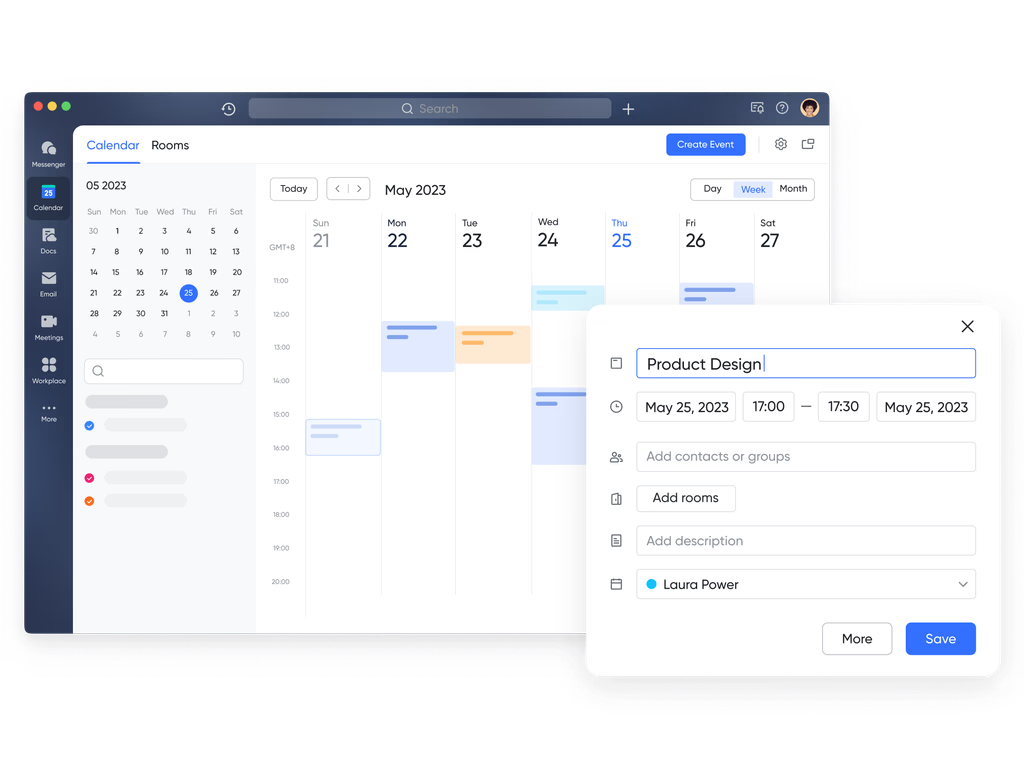
Project milestones and deadlines created in Lark Base appear in the Lark Calendar automatically, ensuring everyone has access to the same schedule. Calendar events include links to Lark Base records and supporting documents, creating a clear chain from planning to action.
Example: A milestone labeled "Beta Launch" appears on every participant's Lark Calendar. The event includes links to the Base record and QA checklist, ensuring the team arrives prepared for the release review meeting.
Gantt Chart template:
Visual planning is key to keeping complex projects on track. These Gantt chart templates from Lark help teams map timelines, manage dependencies, and maintain visibility from kickoff to completion.
OKR management template
This template provides a structured way to define, track, and visualize objectives and key results (OKRs). It helps teams break down high-level goals into measurable outcomes, maintain alignment across departments, and monitor progress with clarity throughout each cycle.
Website design & development template
This template guides teams through every stage of building an e-commerce website—from design planning to development and content updates. It ensures all deliverables, timelines, and tasks stay organized, helping teams deliver seamless online store experiences on schedule.
Project management Gantt chart
This Gantt chart template offers a clear, visual way to plan and manage projects. It allows teams to track timelines, dependencies, and task status, providing a real-time overview of project progress and helping prevent scheduling bottlenecks.
R&D personnel Gantt chart
This template is designed to help manage research and development teams' tasks and projects. It provides a visual representation of start and end times for various tasks, including fields for task status, priority, and assigned personnel. It also allows for customization and various view settings to fit specific needs.
Gantt chart for requirement management
This template offers a visual framework to manage and track project requirements, including modules, versions, and priorities. It provides an overview of each requirement's status—such as under development, pending testing, or awaiting release—enabling teams to monitor progress and make informed decisions.
- Starter plan: Free forever plan that includes 11 powerful tools for up to 20 users. It also comes with 100GB of storage, 1000 automation runs, AI translations, and more.
- Basic plan: $6/user/month (billed annually) for up to 500 users. It includes everything in Starter plus group calling for up to 500 attendees, 5TB of storage, 1000 automation runs, and more.
- Pro plan: $12/user/month (billed annually) for up to 500 users. It includes everything in Starter plus group calling for up to 500 attendees, 15TB of storage, 50,000 automation runs, and more.
- Enterprise plan: Contact sales for custom pricing. Supports unlimited users and includes even more automation runs and advanced security, compliance, and management features.
Common mistakes when using Gantt charts
Even though Gantt charts are powerful tools for project planning, many teams struggle to use them effectively. Avoiding a few common mistakes can make a big difference in keeping projects on track and ensuring everyone stays aligned.
- Overcomplicating tasks and dependencies
- A Gantt chart should make your project easier to follow, not more confusing. Some teams add too many small tasks or unnecessary dependencies, which clutters the chart and makes it hard to read. Keep it simple. Focus on key milestones, deliverables, and meaningful dependencies that reflect the real flow of work.
- Not updating regularly
- A Gantt chart is only useful if it reflects the current state of the project. Many teams create it at the start and then forget to update it as progress continues. This leads to outdated timelines and missed deadlines. Regular updates help track changes, reassign resources, and adjust schedules before problems escalate.
- Treating it as static instead of a living plan
- Ignoring collaboration features
- Modern Gantt chart tools—like the ones available in Lark—offer built-in collaboration features. These allow teams to comment, assign tasks, and share updates in real time. Ignoring these features limits communication and increases the risk of misalignment. Make full use of collaboration tools to keep everyone connected and informed.
By avoiding these mistakes, teams can get the most out of their Gantt charts—using them not just as a scheduling tool, but as a central hub for visibility, accountability, and teamwork.
Conclusion
A Gantt chart in project management is more than just a visual timeline—it's a clear roadmap that helps teams organize tasks, set priorities, and stay on schedule. By process mapping out each phase of a project, it gives everyone a shared view of what needs to be done, when, and by whom.
The biggest advantage of using Gantt charts is the structure and visibility they bring to planning. They make complex projects easier to manage, improve coordination between teams, and help identify potential delays before they turn into real problems.
With modern tools like Lark, teams can take this even further. Lark's Gantt chart view connects timelines with real-time collaboration, making it easier to update progress, share feedback, and adapt quickly as plans evolve. It transforms the traditional Gantt chart into a dynamic, interactive workspace that keeps everyone aligned from start to finish.
FAQs
What is the first step in creating a Gantt chart?
The first step is to list all the key tasks or milestones involved in your project. Once you have that outline, set start and end dates for each task and identify dependencies—tasks that must be completed before others can begin. This foundation helps you build an accurate and realistic project timeline.
Are Gantt charts suitable for Agile project management?
Yes, Gantt charts can work well in Agile environments. While Agile focuses on flexibility and iterative progress, Gantt charts help visualize sprint timelines, backlog priorities, and dependencies. They give teams a structured view without taking away the adaptability that Agile methods promote.
What's the difference between a Gantt chart and a Kanban board?
A Gantt chart focuses on time-based planning. It shows how tasks fit into a schedule and how long each will take. A Kanban board, on the other hand, focuses on workflow. It tracks tasks through stages like “To Do,” “In Progress,” and “Done.” Both tools complement each other—Gantt charts are great for planning, while Kanban boards excel at tracking daily work.
Can I create a Gantt chart in Excel for free?
Yes, you can create a basic Gantt chart in Excel using bar charts and manual formatting. However, it requires frequent updates and lacks automation or collaboration features. It's fine for simple projects, but larger or team-based projects benefit more from dedicated tools.
How does Lark improve Gantt chart project management compared to Excel?
Lark simplifies the entire process by combining visual timelines with real-time collaboration. You can assign tasks, add comments, track progress, and update schedules instantly—without juggling multiple files. Unlike Excel, Lark's Gantt charts stay live and connected, helping teams stay aligned and responsive throughout the project lifecycle.
Related reading
Table of contents
Start using Lark today

Manage all your work in one place
Boost team efficiency by 10x
Save up to 70% on software costs
Table of contents
Start using Lark today
Manage all your work in one place
Boost team efficiency by 10x
Save up to 70% on software costs
Keep reading







2026 Lark Technologies Pte. Ltd.
Headquartered in Singapore with offices worldwide.






Explore: