Flowcharts are an essential tool for breaking down processes, mapping decisions, and improving team communication. For those looking for cost-friendly options, open source flowchart software offers flexibility and freedom without expensive licensing. These tools are especially useful for students, startups, and small teams that need simple diagramming solutions.
In this post, we’ll cover what open-source flowchart tools are, explore the top free options available today, and highlight their pros and cons. We’ll also look at why businesses often outgrow basic diagramming programs and turn to modern, all-in-one platforms like Lark.
🎯
Top 7 free tools covered to fit different technical needs:
Draw.io: Free diagramming platform
Pencil Project: Intuitive diagram tool
LibreOffice Draw: Open-source vector editor
Dia: Simple flowchart and diagram tool
yEd Graph Editor: Versatile diagram software
OpenProject: Team diagram collaboration
Creately Desktop: Offline drawing capabilities
The open-source trade-off: While open-source tools provide excellent flexibility and zero licensing fees, they often fall short when it comes to real-time co-editing and modern automation.
The Lark advantage: Discover how Lark goes beyond static diagrams by combining an intuitive drag-and-drop flowchart builder with live team collaboration, Docs integration, and actionable workflow management in a single workspace.
What is open-source flowchart software
Open source flowchart software is a type of diagramming tool that is freely available, with source code that can be modified or extended by users. Its main advantage is flexibility—teams can customize features, adapt templates, and use it across different platforms without licensing fees. Many users choose open source over paid software to save costs while still accessing reliable diagramming functions. These tools are especially valuable in project management and collaboration, helping teams create process maps, workflow diagrams, or organizational charts that make tasks clearer and improve communication across departments.
How we evaluated open source diagramming tools
We tested each tool against a concrete scenario: recreating a 20+ step customer support escalation flow with decisions, branches, parallel paths, and swimlanes, plus a related system architecture diagram with multiple service components.
Template library: availability of BPMN, UML, network, and custom shape libraries
Collaboration features: real-time co-editing vs. manual file sharing and commenting
Export and sharing: support for multiple formats (PNG, SVG, PDF, XML), embedding into wikis and docs
Performance: responsiveness with large diagrams, load times, offline capability
Extensibility: diagram-as-code support, plugin ecosystems, API access
Diagramming software is often categorized into visual editors and diagram-as-code tools. We evaluated both: GUI-based editors like diagrams.net and LibreOffice Draw alongside text-driven tools like Graphviz and Mermaid.
We tested across Windows, macOS, Linux, and browser environments. Cross-platform availability matters for distributed teams where not everyone runs the same OS.
Finally, we prioritized projects with recent releases or active communities as of 2024–2026 and flagged unmaintained tools where relevant.
Key Features to Look For in Open Source Flowchart Software
Teams need more than the ability to draw boxes and arrows. Here are the must-have features that separate a good tool from a frustrating one.
Drag-and-drop editing: Flowchart software often includes drag-and-drop functionality with snapping, grid alignment, and connectors that dynamically adjust when shapes move. This is essential for building complex flowcharts without constant manual repositioning.
Templates and shape libraries: Many tools offer customizable templates for quick diagram creation. Look for built-in support for BPMN workflows, UML, network diagrams, organizational charts, mind maps, venn diagrams, and state diagrams. The ability to import custom shape libraries is a plus.
Collaboration options: Real-time collaboration is a key feature of flowchart software. Some tools support co-editing where multiple users see each other's cursors, while others rely on manual file sharing. Collaboration features in diagramming tools can be enhanced through real-time editing capabilities. Integration with knowledge base tools and project management platforms matters too.
Export and integration: Flowchart software supports various export options for sharing diagrams in multiple formats-PNG, SVG, PDF, XML. The ability to embed diagrams into wikis, Google Docs, and web pages is increasingly expected. Some flowchart tools integrate with other productivity applications, extending their usefulness. Integrations with popular platforms can enhance the functionality of diagramming tools significantly.
Text-based diagram generation: For developer-centric teams, tools supporting mermaid syntax or DOT language let you version-control diagrams alongside code. Mermaid.js allows users to generate diagrams dynamically using text-based scripts, making it ideal for documentation pipelines.
What are the different types of open source flowcharts?
Open source flowchart software comes in many forms, each designed for specific use cases like project workflows, data tracking, or system design. Choosing the right flow diagram tool open source helps teams improve clarity, streamline communication, and match diagrams to their industry needs.
Swimlane flowchart: A swimlane flowchart divides processes into lanes that represent teams, roles, or departments. It’s especially useful for showing handoffs between groups—for example, how a sales request moves from sales to finance to operations.
Workflow diagram: A workflow diagram visualizes the step-by-step sequence of activities needed to complete a task. Businesses use it to standardize processes like employee onboarding, ensuring each action follows a clear order.
Process flowchart: This is the classic flowchart, using shapes and arrows to illustrate tasks, decisions, and outcomes. It’s often applied in manufacturing or IT to identify bottlenecks and streamline operations.
SDL flowchart: Structured in line with the Specification and Description Language (SDL), this type is used in software and telecommunications. It helps engineers design, analyze, and troubleshoot complex system behaviors.
Process map: A process map gives a high-level overview of how a process functions from start to finish. It’s commonly used in business strategy to align stakeholders around key steps and responsibilities.
Process flow diagram: Often used in chemical, engineering, or industrial contexts, a PFD shows the flow of materials and equipment in a process. It provides technical clarity for industries where accuracy is critical.
EPC diagram: EPC diagrams model workflows based on events and functions. They’re widely used in ERP and business process management, especially in industries with compliance requirements.
Data flowchart: A data flowchart tracks how information moves through systems. For example, it can show how customer data flows from a website form to a CRM, helping teams optimize IT systems and data handling.
While open-source flowchart software provides flexibility for technical teams, business users often prefer platforms that combine visualization with collaboration. Tools like Lark help bridge that gap—allowing teams to design, share, and discuss diagrams in one connected workspace.
Comparison table of open-source flowchart software
Tool
Platform
Templates
Collaboration
Export Options
Pricing
Draw.io
Web, Desktop
Yes
Limited
Multiple formats
Offer free plan
Pencil Project
Desktop
Yes
No
Multiple formats
Start at around $11
LibreOffice Draw
Desktop
Yes
No
Multiple formats
Offer free plan
Dia
Desktop
Yes
No
Multiple formats
Offer free plan
yEd Graph Editor
Desktop
Yes
Limited
Multiple formats
Offer free plan
OpenProject
Web, Desktop
Yes
Real-time
Multiple formats
Offer free plan
Creately Desktop
Desktop, Web
Yes
Real-time
Multiple formats
Start at around $5
Each of these open-source tools serves different needs—from technical system diagrams to collaborative workflow maps. Let us review them in detail in the upcoming section.
7 top open-source flowchart software (paid & free)
1. Draw.io: Browser-based open source diagramming powerhouse
Draw.io is a free open source diagramming software that has become one of the most widely used flowchart tools available. Rebranded as diagrams.net, it runs as a web app, a desktop app (Windows, macOS, Linux), and offers integrations with platforms like Confluence and Google Drive. Diagramming tools like Draw.io integrate with cloud services such as Google Drive, making storage and sharing seamless.
Integration with Google Drive, OneDrive, Dropbox.
Export formats: PNG, JPEG, SVG, PDF.
Template library for common diagram types.
Pros
Free forever, no licensing fees.
Works both online and offline.
Huge library of diagram types.
Stores data in your preferred cloud or locally.
Cons
Lacks built-in team collaboration (comments, version control).
No embedded automation or workflow logic.
2. Pencil Project: Fast prototyping and simple flowcharts
Pencil Project is designed for quick prototyping and flowchart creation. Released under the GPL-2.0 license, it is a genuine open source tool built on Electron, available for Windows, macOS, and Linux as desktop apps. Its straightforward drag-and-drop interface offers predefined shape sets for UI mockups, wireframes, and basic flowchart creation. Exports to SVG, PDF, and PNG cover the essentials. If you need to sketch an onboarding flow, a simple decision tree, or a low-fidelity prototype for internal discussion, Pencil gets the job done without overhead.
Image source: pencil.evolus.vn
Features
Built-in stencils and UI components.
Export to PNG, PDF, SVG.
Multiple pages support for diagram sets.
Link objects (hyperlinks) for interactive prototypes.
Simple import/export of collections.
Pros
Very lightweight and fast to start.
Good for UI flows and diagram sketches.
Editable open source code base.
No vendor lock-in.
Cons
Not suited for large or complex process modeling.
Minimal collaboration features.
3. LibreOffice Draw: Office-style vector editor for flowcharts
LibreOffice Draw is part of the LibreOffice suite, the popular open source office productivity package dual-licensed under MPL-2.0 and LGPL-3.0+. It runs on Windows, macOS, and Linux as a desktop application. For anyone familiar with Writer or Calc, the interface feels natural. LibreOffice Draw offers predefined flowchart shapes, connectors, and multi-page documents that mimic a slide-style layout. The tight integration with the broader Libreoffice suite means you can embed diagrams directly into text documents and spreadsheets-useful for reports and proposals.
Image source: libreoffice.org
Features
Vector drawing tools (lines, curves, shapes).
Import/export of PDF, SVG, and Microsoft format files.
Grouping, layering, alignment features.
Compatibility with other LibreOffice components.
Macro / scripting support.
Pros
Part of full LibreOffice suite—no extra install needed
Strong support for published formats (PDF, SVG)
Customization and scripting possible
Good for technical diagrams, not just flows
Cons
Not optimized specifically for flowcharts (less polished UI).
Collaboration and versioning features are weak.
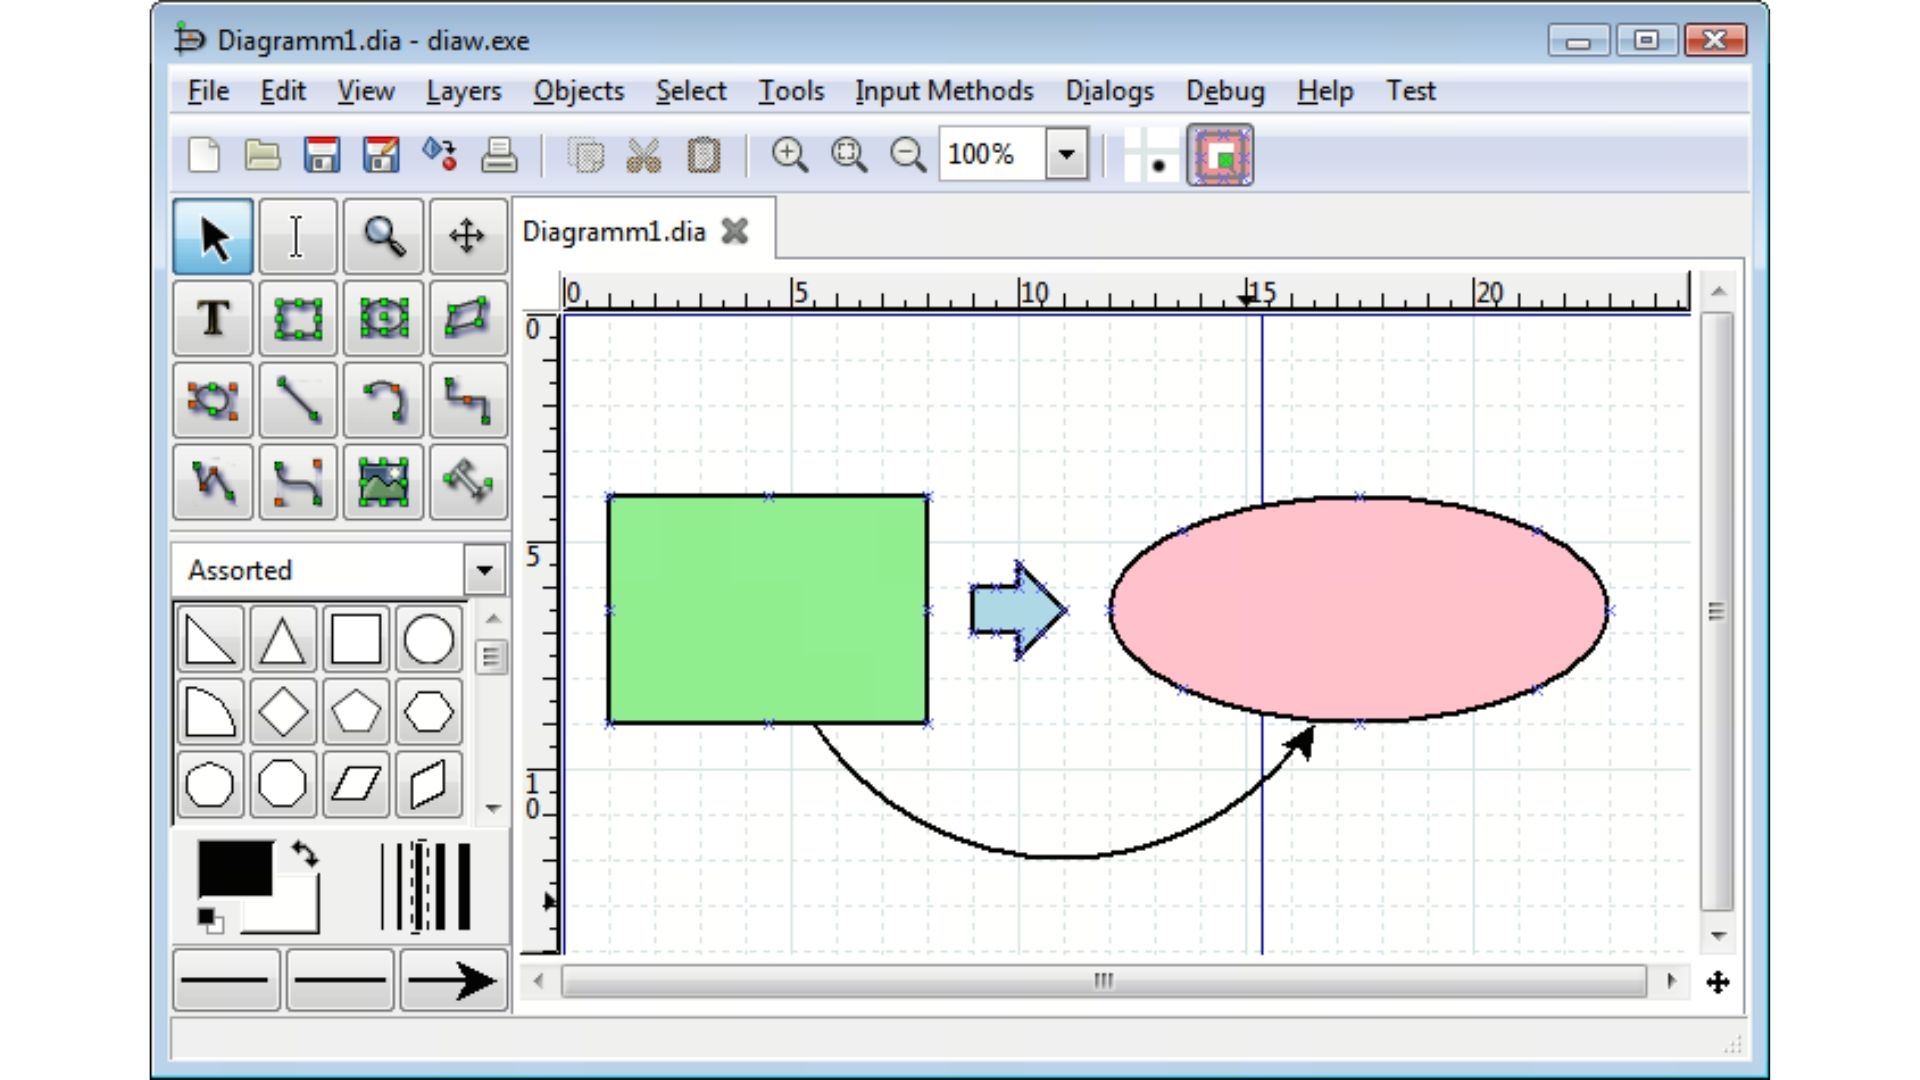
4. Dia: Specialized open source diagramming tool
Dia is a classic, GPL-licensed open source flowchart tool favored by users who want a lightweight, distraction-free diagram editor. Built originally for the GNOME desktop environment, it focuses entirely on simplicity and stability rather than modern bells and whistles. Dia is heavily inspired by commercial Windows tools like Visio, providing a straightforward canvas where users can drag and drop basic shapes to map out ideas quickly. While its interface may look dated, its minimal resource footprint makes it perfect for older hardware or quick, offline process mapping when you don’t need complex integrations.
yEd is a highly versatile graph and flowchart tool. While the application itself is available for free, it is important to note that yEd is proprietary freeware, not an open-source tool. It is widely praised for its exceptional automatic layout algorithms. If you have a messy, tangled web of nodes, yEd can instantly organize them into clean hierarchical, orthogonal, or organic layouts. Because of this, it is heavily used by developers, data scientists, and IT professionals who need to generate complex network diagrams or process flows by importing raw data (like Excel or CSV files) and letting the software handle the visual arrangement automatically.
While OpenProject is primarily known as a robust open-source project management platform, it includes powerful diagramming capabilities that make it a unique contender. Licensed under GPLv3, it is designed for teams that need their workflows, diagrams, and project plans to live in the same ecosystem. Instead of drawing a flowchart in a separate app and uploading it as an image, OpenProject allows you to embed diagrams directly into tasks and link visual workflows to your project milestones. This makes it an excellent choice for agile teams or PMOs who want to ensure that their process flows are directly connected to the work being executed on Gantt charts or Kanban boards.
Image source: openproject.org
Features
Embedding of diagrams / visual attachments.
Task / issue mapping tied to workflows.
Versioning and history within tasks.
Gantt, Kanban, and board support with visuals.
Access control and roles.
Pros
Integrates diagrams with project tasks.
Open source and self-hosting option.
Good for teams already using OpenProject for project management.
Strong permissions and audit trails.
Cons
Diagramming features are limited compared to dedicated tools
The UI may feel less fluid for heavy diagram editing
Creately bridges the gap between traditional offline diagramming and modern workflow management. While Creately is a commercial platform rather than an open-source tool, its Desktop version appeals to users looking for local storage and modular design alongside its free tier. It stands out by focusing heavily on usability and template richness, offering hundreds of pre-built stencils for everything from basic process maps to complex organizational charts. It is an excellent hybrid solution for teams that want the offline security of a desktop app but still need the option to sync to the cloud for collaboration when an internet connection is available.
Image source: creately.com
Features
Drag & drop shapes and connectors.
Templates and stencils for processes, org charts.
Offline and local project storage.
Import/export to PNG, PDF, SVG.
Collaboration sync when online.
Pros
Pleasant UI and ease of use.
Hybrid offline + cloud sync.
Good template library.
Suitable for both diagrams and visual workflows.
Cons
Free version may limit number of diagrams or features.
Some advanced collaboration / sharing only in paid tiers.
Open source vs. SaaS diagramming: Finding the right balance
Before committing to an open-source flowchart tool, it’s worth weighing its flexibility against the convenience of a modern SaaS platform. Based on the tools we’ve explored, here is a closer look at what you gain—and what you might sacrifice.
The advantages of going open source
For developers and technically inclined teams, open-source software offers unmatched freedom:
Zero licensing fees: You gain access to advanced diagramming capabilities without the recurring costs of proprietary software.
Complete data sovereignty: With self-hosting options and auditable codebases, there is no hidden data collection. You retain full control over your information, which is a must-have for compliance-heavy industries.
Deep customization: Open-source tools can be extended with custom plugins to fit perfectly into your CI/CD pipelines, local repositories, or internal documentation systems.
Offline independence: Many of these tools run locally, allowing you to build complex diagrams without relying on cloud services or internet connectivity.
The hidden costs and drawbacks
However, the DIY nature of open-source tools can create unexpected friction, particularly for fast-growing businesses and non-technical stakeholders:
Fragmented collaboration: Most open-source options are built with the solo user in mind. They often lack the polished, real-time co-editing and commenting features that modern cross-functional teams rely on.
High maintenance overhead: Self-hosting means your team is entirely responsible for manual updates, server maintenance, and troubleshooting.
Steeper learning curves: Tools that rely on diagram-as-code (like Graphviz) demand a certain level of technical comfort, which can easily alienate business, HR, and design teams.
Limited AI and automation: You’ll rarely find native AI auto-layout features, text-to-diagram capabilities, or seamless integrations with your daily task management apps.
While open-source tools provide a fantastic sandbox for individuals and small, tech-heavy teams, they often fall short when it comes to enterprise-grade collaboration, automation, and cross-platform scalability. If your team needs to brainstorm, align, and execute at scale, relying on isolated, static diagramming tools can quickly create data silos.
Lark as an alternative to open-source flowchart software
Lark is not an open source flowchart program, but it offers a powerful alternative for teams that need more than just basic diagramming. As an all-in-one workflow platform, it combines flowchart creation with chat, tasks, Docs, and automation in a single space. This means teams can design processes, collaborate in real time, and link diagrams directly to projects without switching tools. With built-in version history, cross-platform access, and seamless communication, Lark helps organizations turn flowcharts into actionable workflows. For businesses seeking scalability and productivity, Lark goes far beyond traditional diagram tools.
From static diagrams to flawless execution
The true value of a diagramming tool isn't just in how pretty the shapes look—it's in how well it helps your team execute the plan. Here is how Lark makes that happen:
"Implementing the right tool at the right time enabled us to organize our team, strategize effectively, and deploy with precision and efficiency, ensuring flawless execution during outlet openings."
Eddie Goh
General Manager
Drag-and-drop flowchart builder
Lark makes diagramming simple with an intuitive drag-and-drop builder. Teams can create process maps, decision trees, and organizational charts without needing external programs. For example, an HR department can build a hiring flowchart—from job posting → candidate screening → interview scheduling → onboarding—directly in Lark, and share it instantly with recruiters and managers.
Real-time collaboration
Unlike many open source flowchart programs that require file sharing and version merging, Lark supports real-time co-editing. Multiple users can work on the same flowchart simultaneously, with changes visible instantly. A product team mapping out a software release workflow can have developers, testers, and product managers update the same diagram at once, ensuring everyone stays aligned.
Docs + Diagrams embedding
Flowcharts rarely exist in isolation—they often support reports, proposals, or project plans. With Lark, diagrams can be embedded directly into Lark Docs and Lark Sheets, keeping visuals connected to the data and narrative they represent. For instance, a finance team can embed an approval flowchart inside a budget proposal Doc, so stakeholders see both the numbers and the approval process in one place.
Version history
Complex workflows often evolve, and it’s easy to lose track of earlier iterations. Lark’s version history ensures every edit to a flowchart is logged, allowing teams to roll back if needed. For example, if a sales process map was simplified too aggressively, managers can restore a prior version that still includes essential steps for compliance.
Seamless communication
Flowchart discussions don’t need to be scattered across emails or external chats. In Lark, teams can switch between Lark Messenger threads, video calls, and diagram editing without leaving the platform. A remote team mapping a customer support escalation flow can review the diagram in a call, leave threaded comments, and edit in real time—all in one workspace.
Cross-platform access
With desktop, mobile, and web access, Lark ensures flowcharts are always within reach. A manager can review a workflow diagram from a laptop, while a field employee checks updates from their phone. Updates sync automatically, ensuring the latest version is always available. This is especially useful for distributed teams working across time zones, where instant access is critical.
Starter plan: Free forever plan with 11 powerful tools for up to 20 users, 100GB storage, 1,000 automation runs, AI translations, and more. No credit card needed.
Basic plan: $6/user/month (billed annually) for up to 500 users. Includes everything in Starter plus unlimited message history, 5TB storage, 1,000 automation runs, and more. Some users may need to contact sales to purchase.
Pro plan: $12/user/month (billed annually) for up to 500 users. Includes everything in Basic plus group calling for up to 500 attendees, 15TB storage, 50,000 automation runs, and more.
Enterprise plan: Contact sales for custom pricing. Supports unlimited users and includes advanced automation, security, compliance, and management features.
How many employees work at your company?
By number of people
1
20
500
5000+
1000
Which tools do you use?
Estimates are for reference only, contact us for an official quote
Replace
0
1
2
3
4
5
6
7
8
9
apps
Lark Enterprisecan replace and surpass at least 4 of your existing business tools.
Saves$
0
1
2
3
4
5
6
7
8
9
0
1
2
3
4
5
6
7
8
9
0
1
2
3
4
5
6
7
8
9
,
0
1
2
3
4
5
6
7
8
9
0
1
2
3
4
5
6
7
8
9
0
1
2
3
4
5
6
7
8
9
/year
With 1000 employees, your company could save at least $390,000 per year by using Lark.
Estimates are for reference only, contact us for an official quote
Conclusion
Open source flowchart software offers flexibility and cost savings, making it a solid choice for teams that need simple diagramming tools. Options like Draw.io or LibreOffice Draw help visualize workflows, but they often lack advanced collaboration features.
This is where Lark stands out as an all-in-one alternative. Beyond flowchart creation, it brings real-time editing, Docs and Sheets embedding, version history, and built-in communication together in one workspace.
For teams that want to boost productivity, streamline workflows, and keep collaboration seamless, Lark provides a future-ready platform that goes far beyond traditional diagramming tools.
Open source flowchart software is freely available, with source code that can be modified and shared by anyone. While this offers flexibility, it often requires more setup and technical knowledge. For teams seeking a ready-to-use, collaborative option, Lark provides flowchart creation alongside chat, Docs, and automation in one platform.
Can I use these tools offline?
Many open source programs like Dia or LibreOffice Draw support offline use, but collaboration features are limited once you’re disconnected. Lark offers offline editing in Docs and Sheets, with changes syncing automatically—ensuring flowcharts and project documents stay updated for the whole team.
Which tool is best for large teams?
Open source tools work well for small groups, but large teams often struggle with version control and collaboration. Lark scales from small businesses to enterprises, giving managers visibility through dashboards and enabling teams to co-edit diagrams in real time.
Are there limitations compared to paid software?
Yes—open source tools may lack advanced automation, integrations, or enterprise security. They’re great for simple diagrams but less suited to complex workflows. Lark fills this gap by combining flowcharting with task management, approvals, and enterprise-grade security.
Can I export flowcharts to PowerPoint or PDF?
Most open source flowchart tools allow exports, but formatting can sometimes break when shared across systems. With Lark, teams can embed flowcharts directly into Docs or export polished versions for presentations, keeping diagrams consistent and easy to share.
Ryan is a Product Marketing Specialist. Having helped over 150 project managers overcome challenges, Ryan delivers actionable strategies and forward-thinking insights to elevate your team's performance by leveraging innovative methods for revolutionary project execution.
10 Best Project Management Calendar Tools to Streamline Your Workflow
Discover how a project management calendar can improve scheduling, visibility, and teamwork. Learn best practices, benefits, and explore the 10 best calendar tools—including Lark,
Discover the top 5 free task management software options of 2026. Explore their features and learn how they help retail and wholesale businesses complete tasks.