Project plans often fail not because teams lack effort, but because progress is difficult to see clearly. Tasks move forward, meetings happen, and documents get updated, yet stakeholders still struggle to understand whether a project is truly on track. This is where milestone charts become essential. They provide a clear view of key delivery points, helping teams focus on outcomes rather than activity.
Milestone charts in project management are used across industries to track progress, align expectations, and reduce delivery risk. Instead of showing every task, they highlight the moments that matter most. This guide explains what milestone charts are, how different types work, and how teams can build effective charts that remain accurate as projects evolve. Platforms like Lark increasingly support milestone charts as living systems rather than static visuals, making them more reliable over time.
Build clearer milestones for your projects
What are milestone charts, and why do they matter?
Milestone charts are visual representations of key project checkpoints. Each milestone represents a significant event, deliverable, or decision point rather than day-to-day work. Unlike task lists, milestone charts emphasize progress toward outcomes that define success.
In milestone charts project management practices, milestones act as anchors for planning and review. They help teams understand whether work is moving toward meaningful goals. Executives and clients also rely on milestone charts for high-level reporting because they summarize progress without unnecessary detail.
charts are especially useful when timelines are long or when multiple teams contribute to the same deliverables. They create shared visibility and reduce misalignment. When built correctly, milestone charts in project management become decision-making tools rather than passive documentation.
Types of milestone charts and when to use each
Different projects require different milestone chart formats. Choosing the right type depends on complexity, audience, and execution style. Understanding these options helps teams apply milestone charts project management methods more effectively.
- Timeline-based milestone charts: Timeline milestone charts place milestones along a horizontal time axis. They work well for linear projects with predictable phases such as construction or infrastructure programs. Teams can quickly see which milestones are upcoming and which are delayed. These charts are commonly used in executive reviews because they show schedule alignment clearly without operational noise.
- Gantt milestone overlays: In this format, milestones appear as markers within a . This approach combines task-level planning with outcome tracking. Teams benefit from seeing how tasks roll up into milestones. It is popular in milestone charts in project management where dependencies are complex and delays need immediate visibility.
- Phase-based milestone charts: Phase-based charts group milestones by project stage rather than by date. They are useful when timelines are flexible, but outcomes must occur in sequence. initiatives often use this model. Project milestone charts built this way emphasize readiness rather than deadlines.
- Financial milestone charts: Examples of project milestone financial charts focus on budget releases, payment approvals, or cost thresholds. These charts align delivery with financial control points. They are critical in procurement, enterprise IT, and regulated environments. Financial milestones ensure spending remains tied to progress rather than assumptions.
Examples of project milestone charts across industries
Milestone charts adapt well across industries because they focus on outcomes rather than processes. While formats differ, the underlying purpose remains the same. Each example below illustrates how milestone charts in project management support clarity and accountability.
- Construction and infrastructure projects: In construction, project milestone charts track events such as foundation completion, inspections, and handovers. These milestones often align with payment schedules, making examples of project milestone financial charts especially relevant. Delays become visible early, allowing contractors and clients to intervene before costs escalate.
- and product launches: Software teams use milestone charts project management practices to track releases, beta launches, and compliance approvals. Instead of tracking every sprint task, milestones reflect user-visible outcomes. This approach helps stakeholders understand progress even in agile environments where plans evolve frequently.
- Marketing teams rely on milestone charts template formats to coordinate launches, approvals, and channel readiness. Campaign success depends on timing, and milestone charts provide a shared timeline across creative, content, and media teams. This reduces last-minute rushes and missed dependencies.
- Finance and enterprise transformation: Examples of project milestone financial charts are common in ERP implementations and compliance programs. Milestones may include audit sign-offs, data migration readiness, or regulatory approvals. These charts help leadership monitor risk exposure while ensuring governance requirements are met.
7 steps to create a milestone chart
Creating an effective milestone chart requires more than listing important dates. Each step helps ensure milestones are meaningful, measurable, and aligned with real project outcomes. A clear process also makes milestone charts in project management easier to maintain as work evolves. The steps below guide teams from initial definition to ongoing review and improvement.
Step 1: Define clear project outcomes
Start by identifying what success looks like for the project. Milestones should represent meaningful outcomes, not individual activities. Clear outcome definition ensures milestone charts in project management reflect real progress. This also prevents milestones from becoming vague or subjective.
Step 2: Identify key milestone events
List the major delivery points, approvals, or decision gates in the project. These events should mark visible progress that stakeholders care about. Project milestone charts work best when each milestone signals a clear shift in project status. Avoid adding minor checkpoints that dilute focus.
Step 3: Set measurable completion criteria
Each milestone must have clear criteria for completion. This removes ambiguity when tracking progress and reporting status. Milestone charts project management practices rely on objective definitions to maintain credibility. Teams should agree on these criteria upfront.
Step 4: Establish milestone dependencies
Map how milestones relate to one another and which ones must occur in sequence. Understanding dependencies helps teams anticipate delays and manage risk early. Examples of project milestone financial charts often depend on this step to control spending. Dependency clarity keeps timelines realistic.
Step 5: Assign ownership and accountability
Every milestone needs a responsible owner who drives progress and confirms completion. Ownership ensures follow-ups happen and issues are escalated quickly. In milestone charts in project management, accountability turns visibility into action. Shared ownership often leads to missed milestones.
Step 6: Choose the right chart format
Select a format that fits the project and audience, such as a timeline, or phase-based layout. Executives may prefer simplified views, while delivery teams need more context. The best for creating milestone charts allow multiple views from the same data. This avoids duplicate tracking.
Step 7: Review and update milestones regularly
Milestone charts should evolve as projects change. Regular reviews help teams adjust dates, scope, or dependencies based on reality. Milestone charts stay reliable only when they reflect current conditions. Ongoing updates build trust in reporting.
Bring your milestone charts into real project uses
How Lark supports milestone charts as living project controls
approaches milestone charts as active project controls rather than static planning visuals. Instead of existing as standalone diagrams, milestones are connected directly to tasks, timelines, and ownership. This allows milestone charts in project management to update automatically as work progresses. Teams gain a real-time view of delivery status without manual reporting. As a result, milestone charts remain accurate, relevant, and useful throughout the .
Centralised project management hub with smart milestone tracking
provides a structured foundation for milestone charts by storing project milestones as live records instead of static rows. Teams can define milestones by project, phase, owner, or priority, and attach attributes such as deadlines, dependencies, and status. This turns milestone charts into a reliable system of record rather than a disconnected visual. With built-in and Kanban views, milestones remain visible within the broader project timeline and execution flow. 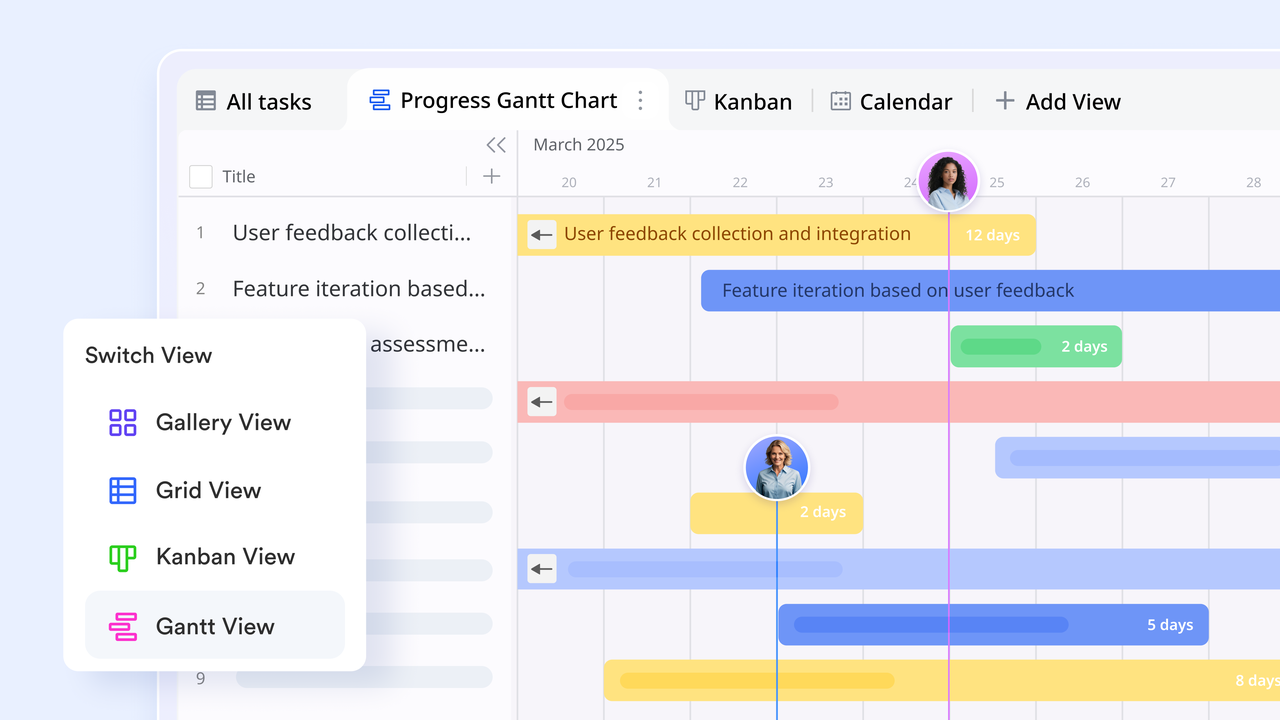
Strong document add-on powers up your visual plan creation
In project management, the Lark Docs timeline add-on acts as a visual bridge between high-level milestones and daily execution. By dragging task bars directly on the timeline, you can instantly adjust schedules with a bi-directional sync that updates every other view in your workspace. You can further organize this view into "" to group tasks by department or phase, while custom color-coding ensures that high-priority milestones stand out at a glance. Unlike a static image, this timeline is interactive—you can adjust start and end dates directly on the bar to instantly update the master record. 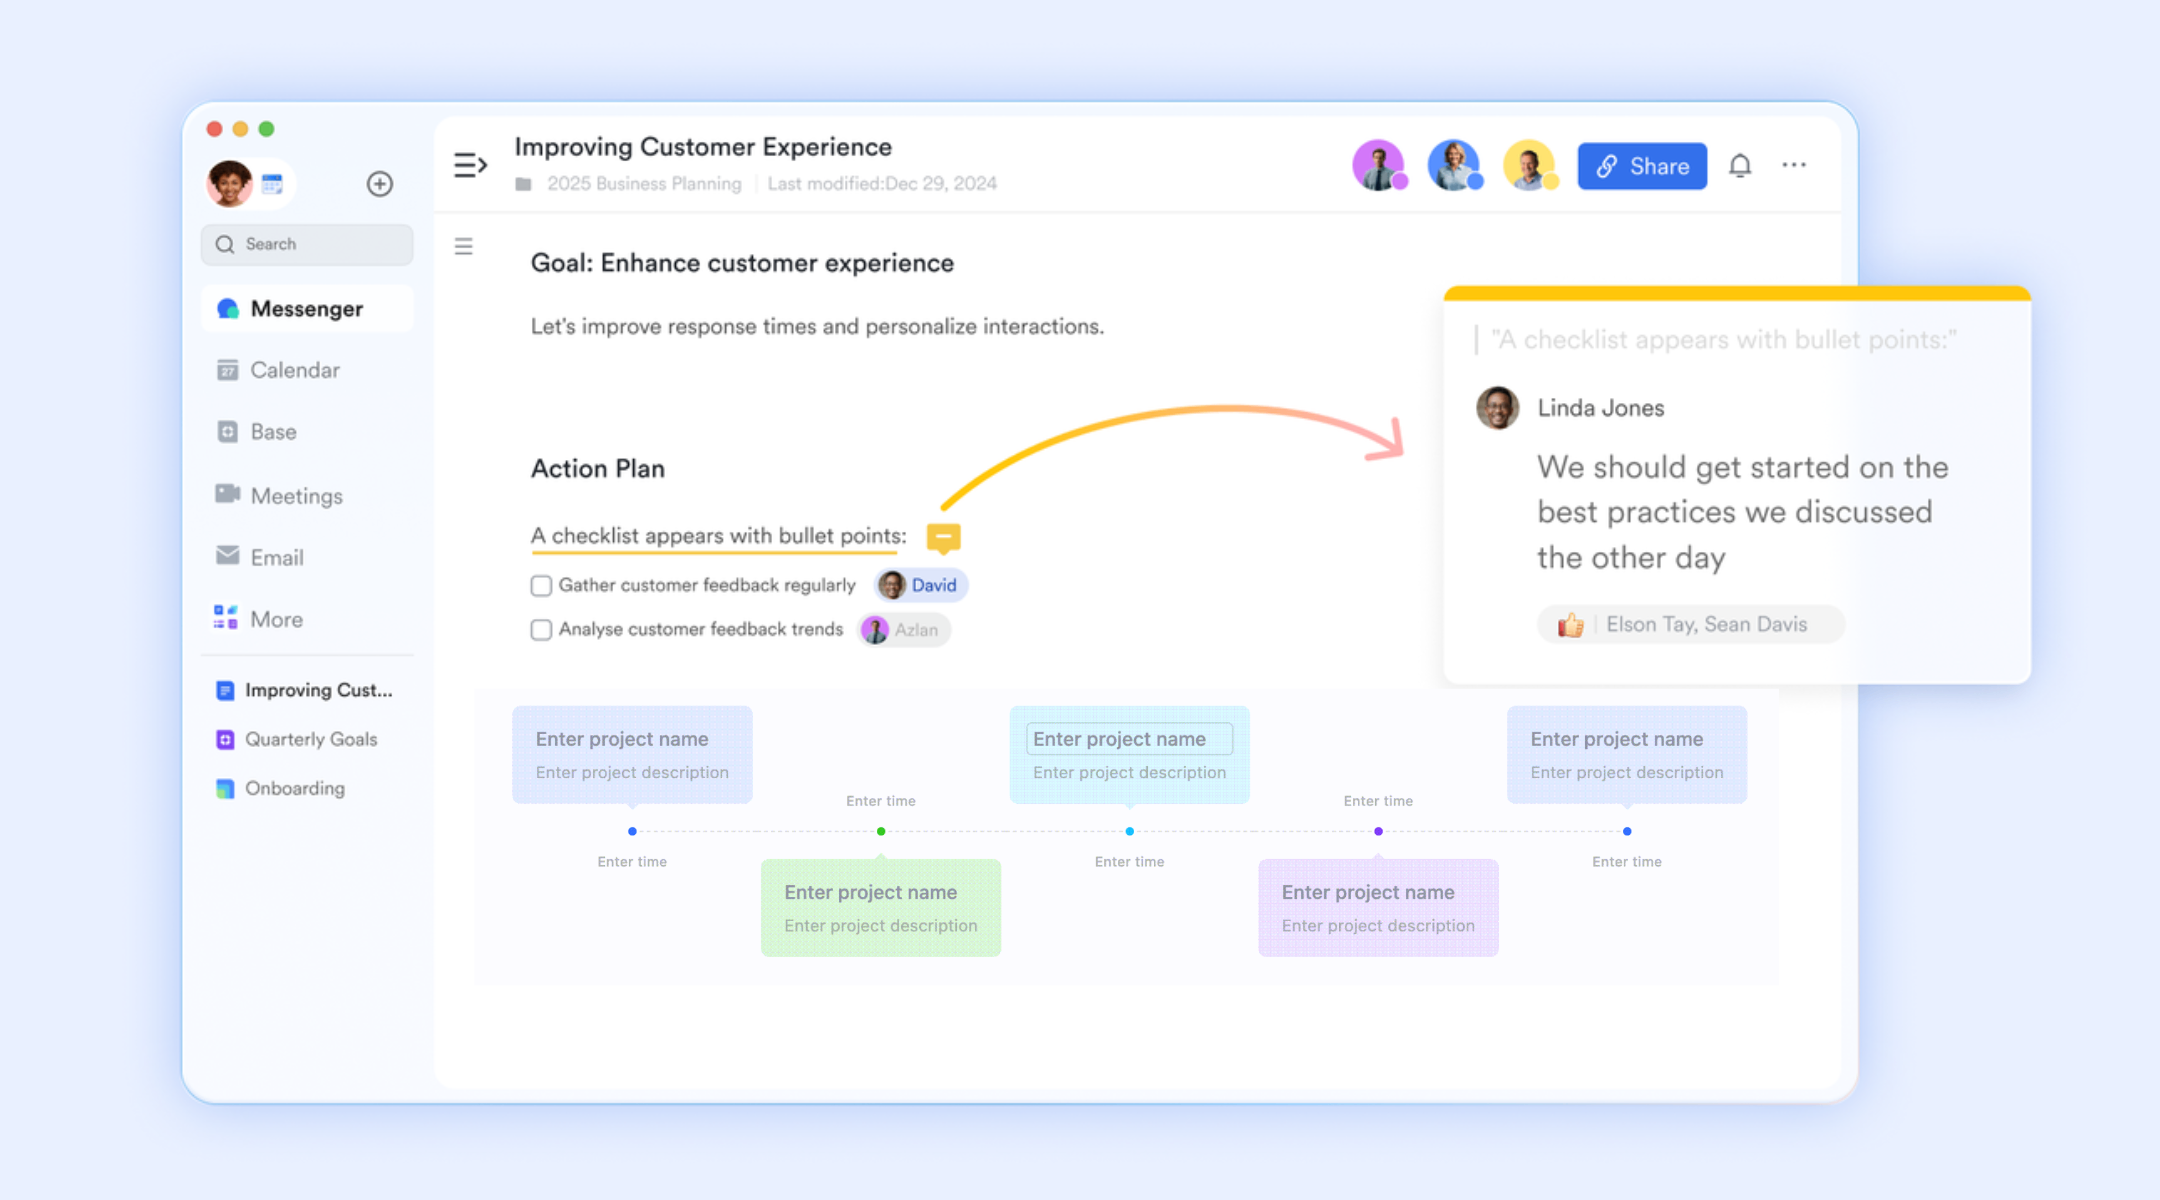
Task-level execution tied directly to milestones
Lark Tasks bridges high-level milestone charts with day-to-day execution. By using the Gantt chart view, you can map out major milestones and their to see exactly how your annual goals are progressing across the calendar. To ensure these milestones are reachable, you can break them into granular sub-tasks, assigning specific owners to each piece of the puzzle to maintain accountability. Custom fields allow you to label these key stages by priority or risk, while the and activities feed provide real-time visibility into the "health" of your milestone. 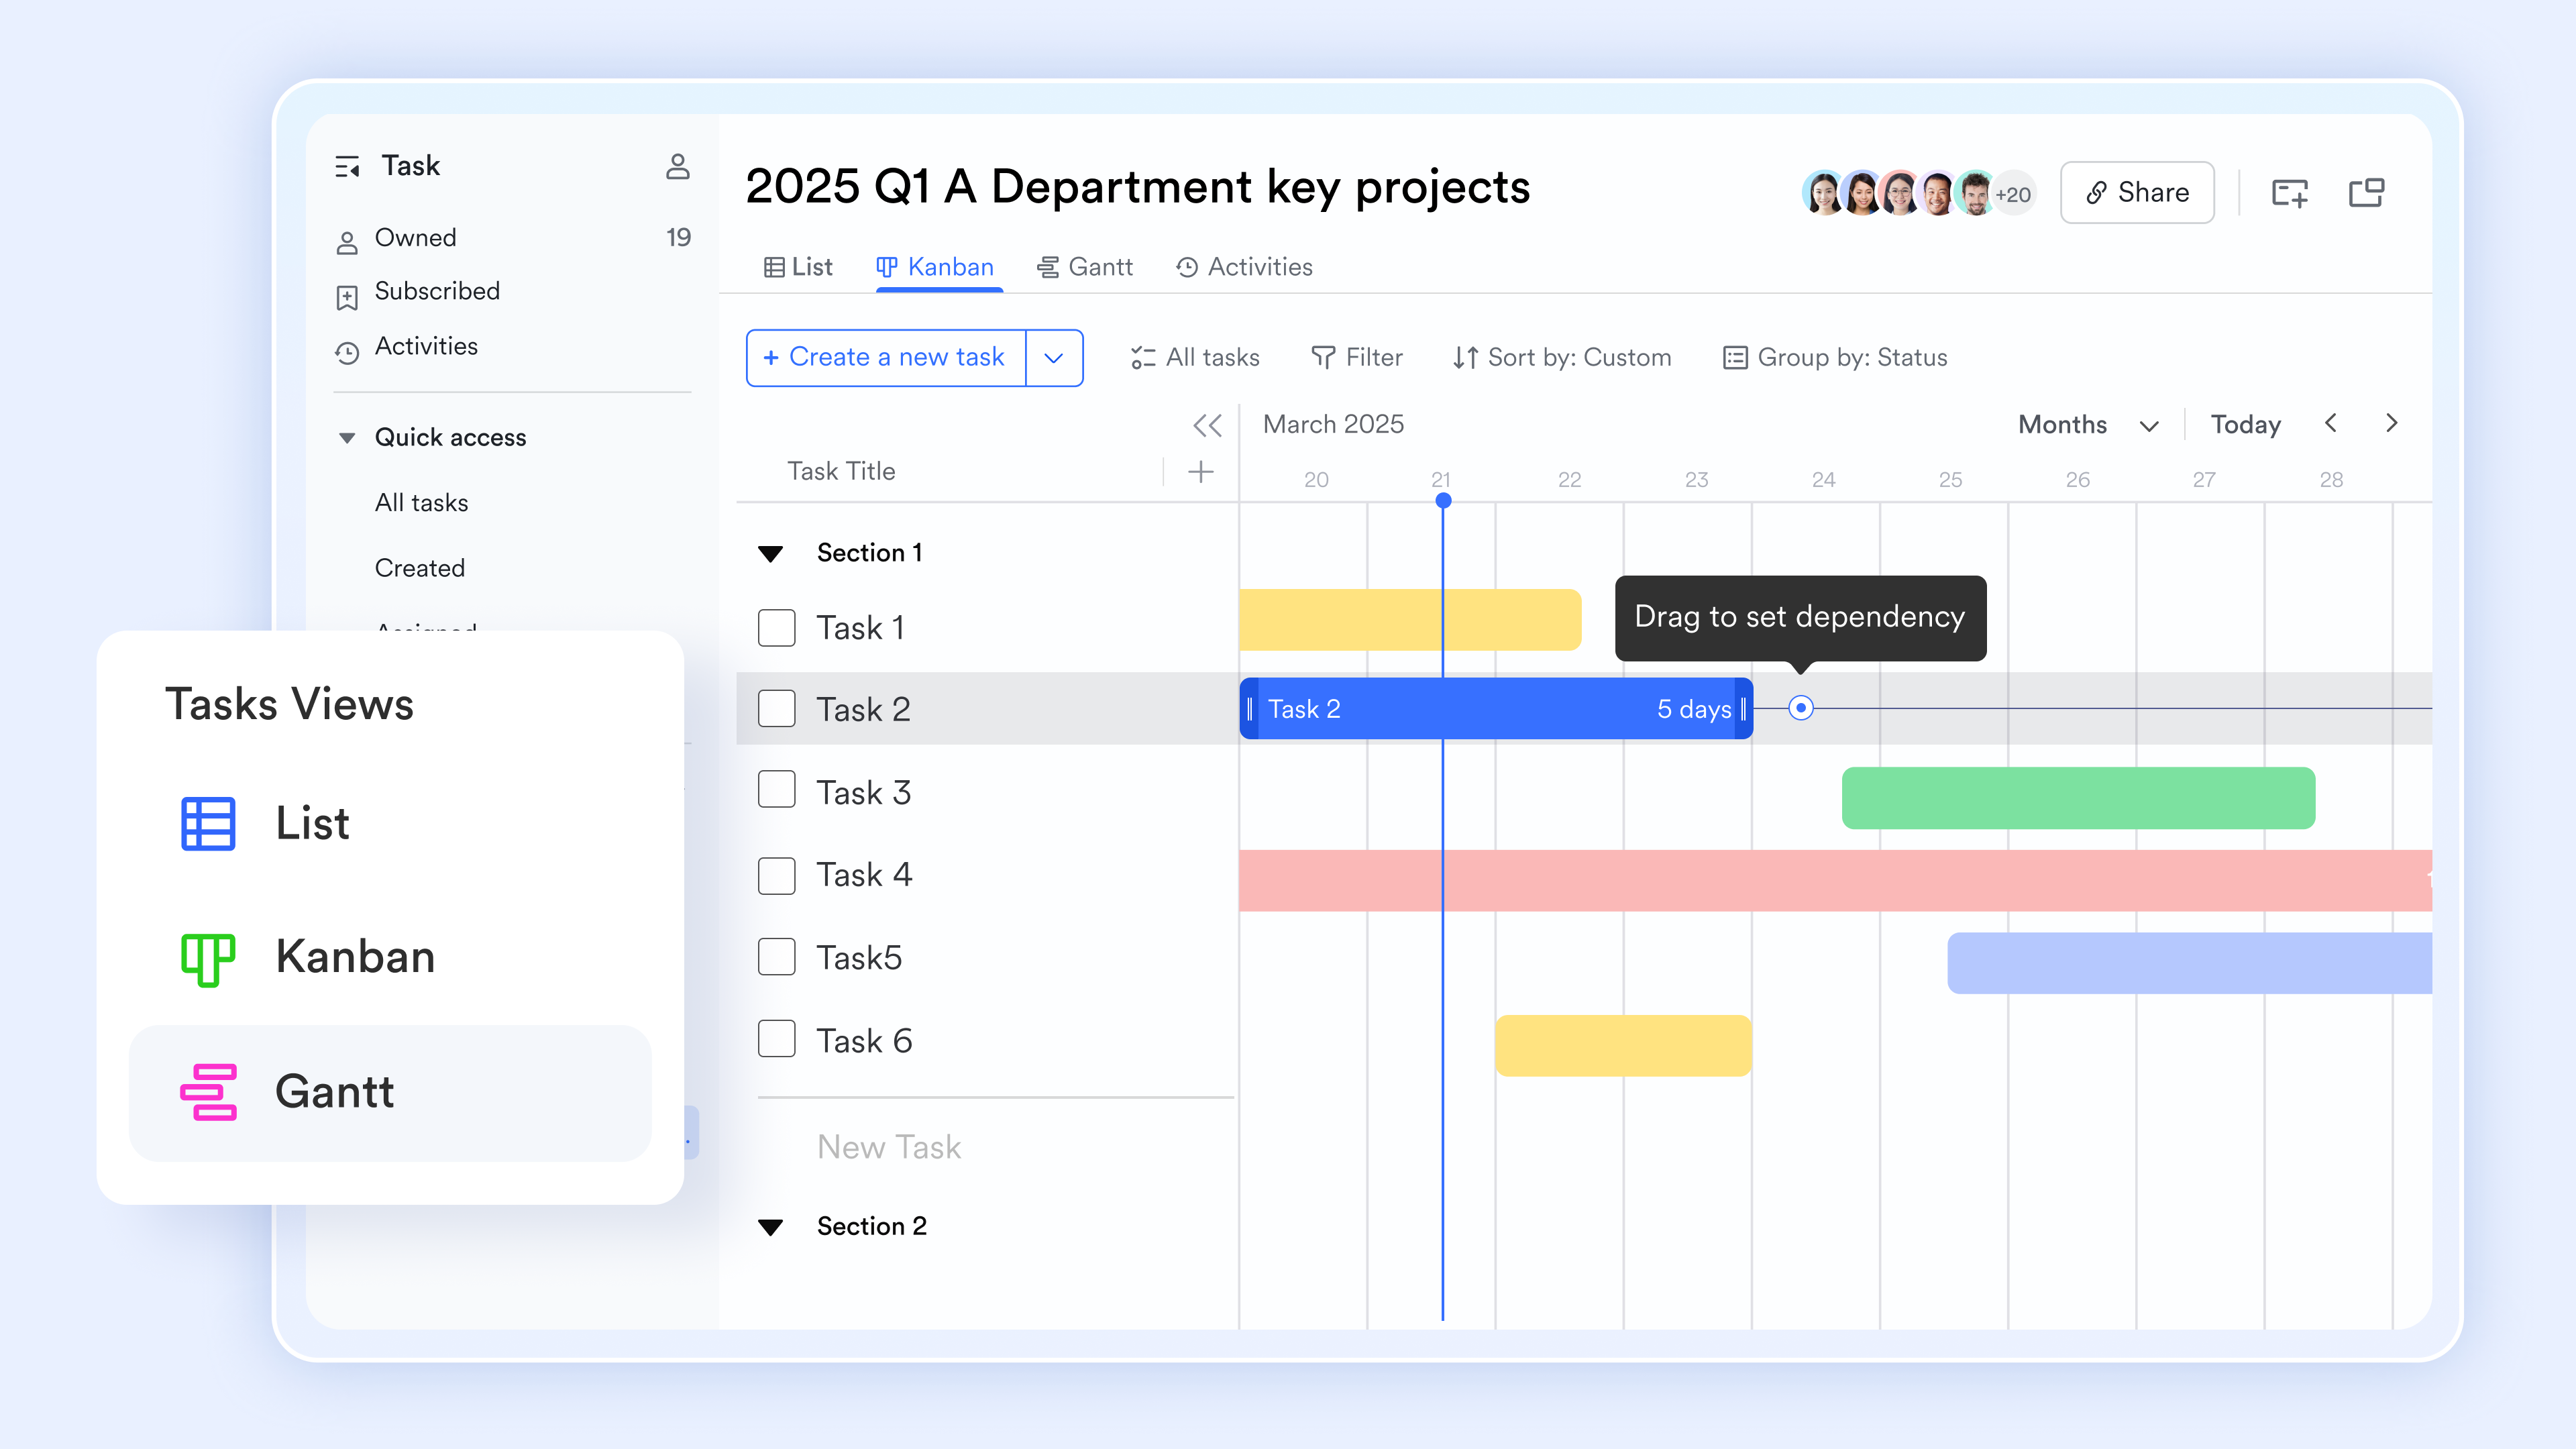
Dynamic grouping and filtering for milestone visibility
Lark Base groups and filters allow teams to focus on the milestones that matter most at any moment. Managers can instantly view milestones by status (in progress, completed, at risk), phase, or owner without creating separate charts. These views update automatically as data changes, ensuring milestone charts always reflect the current state of the project. This makes it easier to assess progress, identify risks, and prioritize attention. 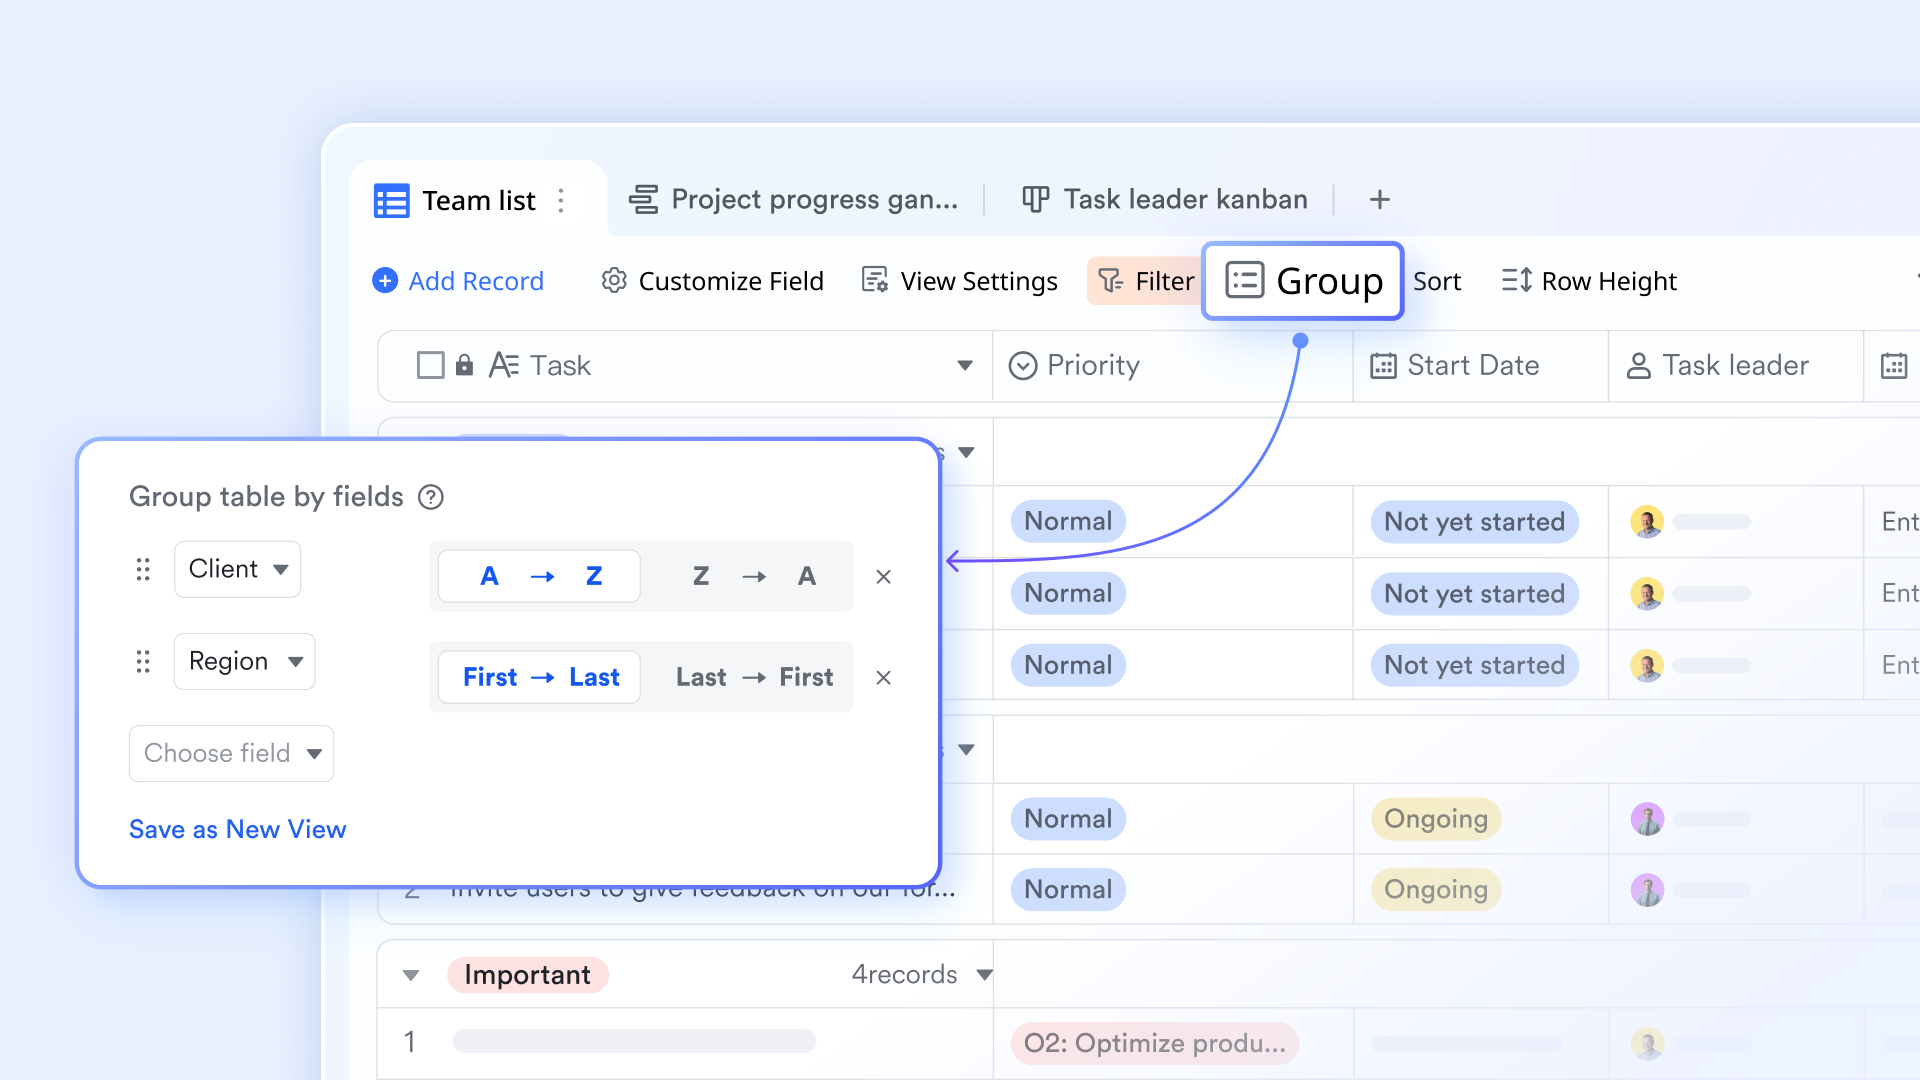
Two-way linked records for milestone consistency
Two-way links in Lark Base connect milestones with related tasks, deliverables, budgets, or approvals. When a linked task progresses or completes, the milestone can update automatically, keeping data consistent across the workspace. This eliminates duplicate tracking and manual reconciliation. Milestone charts remain accurate because they are directly connected to the underlying work driving progress. 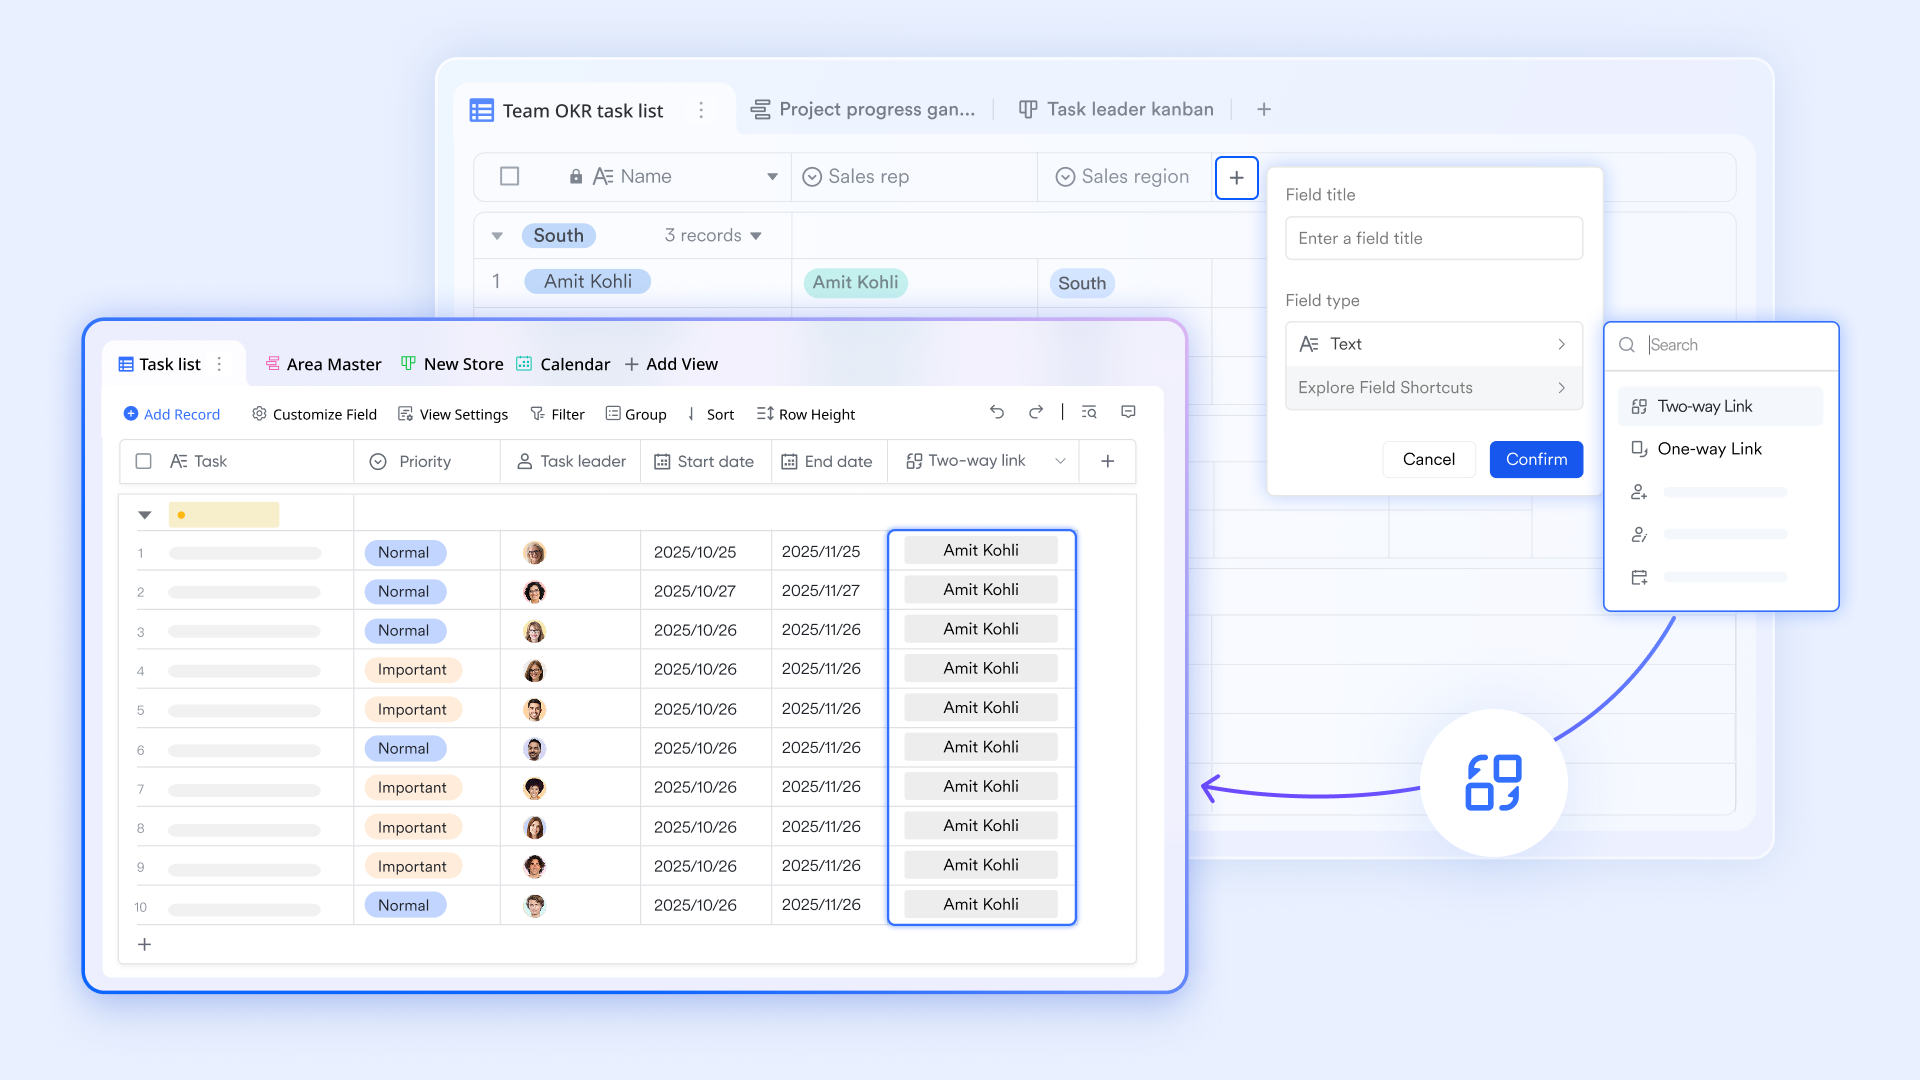
Automated milestone reminders and status updates
Lark Base automations ensure milestone charts stay active rather than forgotten. Teams can trigger reminders as deadlines approach, update milestone status automatically based on task changes, or initiate approval steps when milestones are reached. Notifications are delivered directly through , allowing owners to confirm progress without leaving their workflow. This automation keeps milestones on schedule while reducing manual follow-ups. 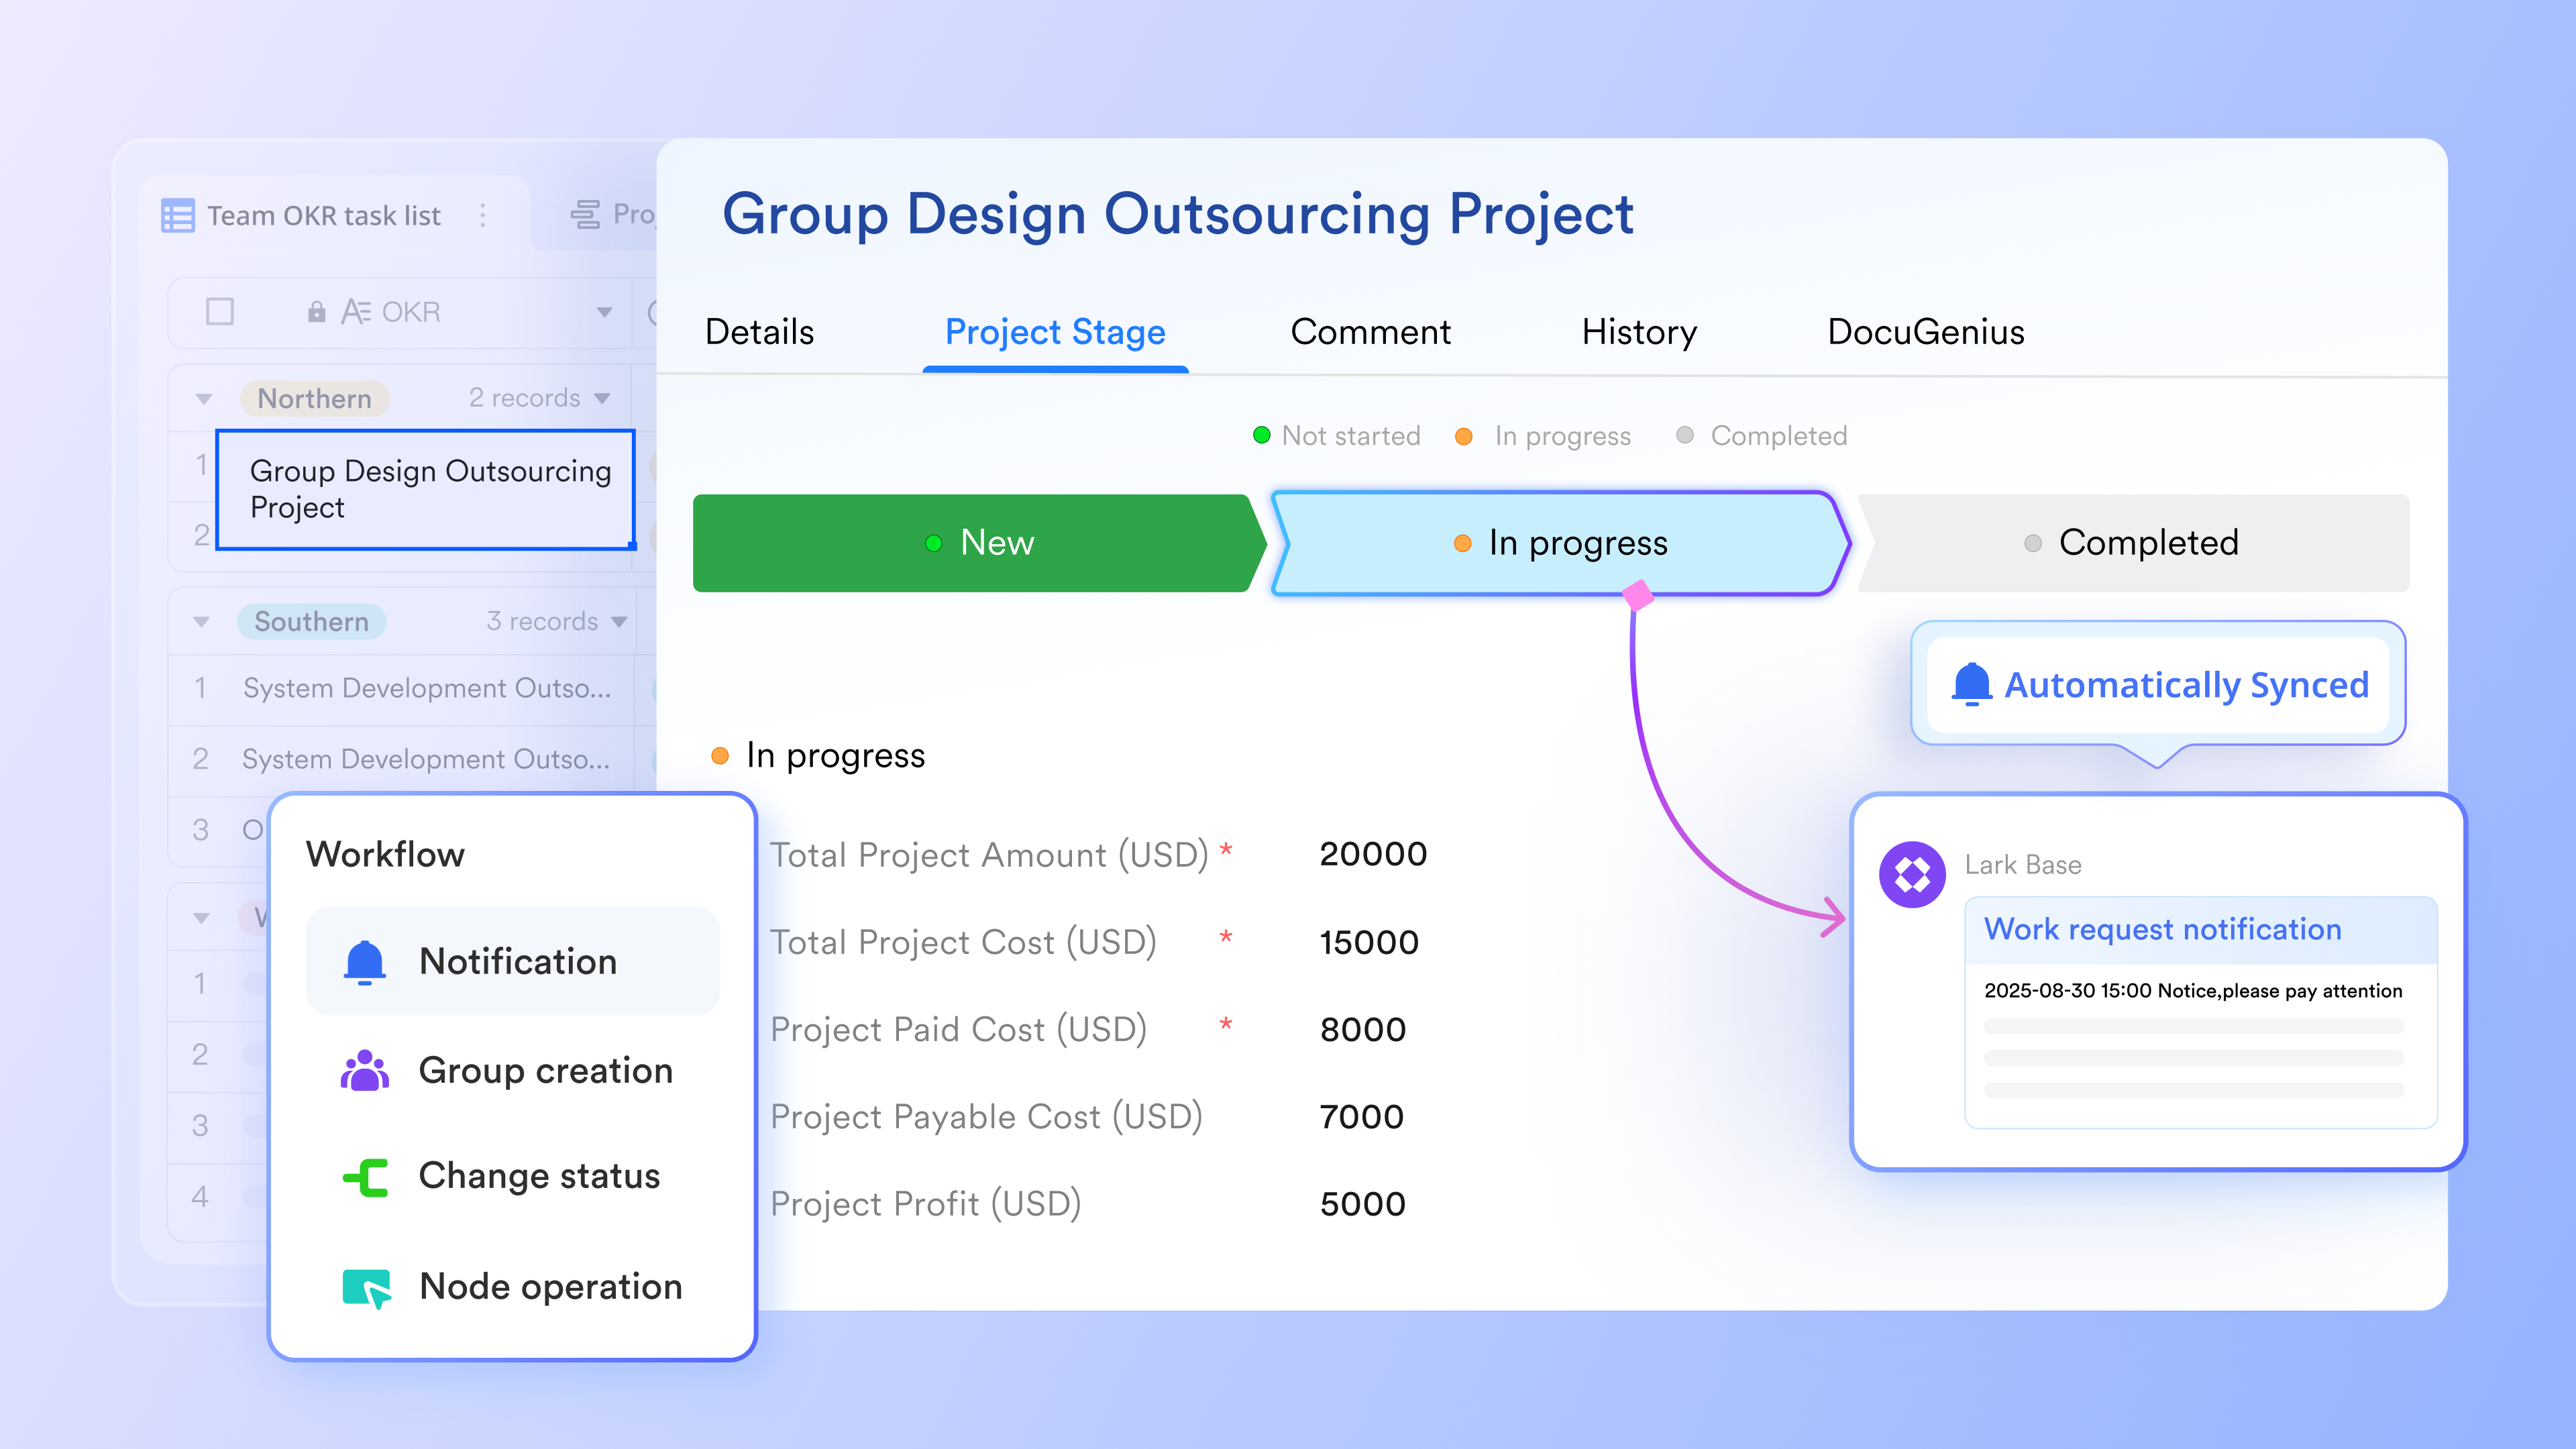
:
- Starter plan: Free forever plan that includes 11 powerful tools for up to 20 users. It also comes with 100GB of storage, 1000 automation runs, AI translations, and more.
- Pro plan: $12/user/month (billed annually) for up to 500 users. It includes everything in Starter plus group calling for up to 500 attendees, 15TB of storage, 50,000 automation runs, and more.
- Enterprise plan: for custom pricing. Supports unlimited users and includes even more automation runs and advanced security, compliance, and management features.
For small teams with simple communication needs

18 months message history
1000 Base automation runs/month
2000 rows per table in Base
Most POPULAR
For companies with comprehensive collaboration and management needs
Unlimited message history
500-participant video meetings
50k Base automation runs/month
20k rows per table in Base
For large companies with advanced security and organizational management needs
Get a personalized demo and pricing
Unlimited message history
500-participant video meetings
15 TB storage + 30 GB storage/user
500k Base automation runs/month
50k Base automation runs/month
Most POPULAR
For companies with comprehensive collaboration and management needs
Unlimited message history
500-participant video meetings
50k Base automation runs/month
20k rows per table in Base
Bonus: Ready-to-use Lark Milestone charts templates
These ready-to-use templates help teams get started with milestone charts quickly without designing structures from scratch. Each template reflects real project scenarios and common delivery patterns, making setup simple and practical. They support t by focusing on outcomes rather than task overload. Teams can adapt fields, views, and milestones as projects evolve. This makes them useful for both early planning and ongoing execution.
Production milestone tracker template
This production milestone tracker template is designed for teams with strict dependencies. It helps production managers track progress from planning through final delivery without losing visibility. Milestones can be grouped by phase, owner, or priority, making coordination easier across teams. The template works well for manufacturing, media production, and operations workflows. It supports milestone charts project management by keeping outcomes visible without task overload.
Web3 project milestone tracker template
This Web3 project milestone tracker template supports decentralized teams working across technical and governance milestones. It helps track deliverables such as protocol development, audits, token launches, and community rollouts. The structure is flexible enough for evolving scopes while still enforcing accountability. Project milestone charts built from this template make progress visible to both internal teams and external stakeholders.
Software project milestone tracker template
This software milestone tracker template focuses on release-driven delivery rather than individual tasks. It helps teams track key moments such as feature freeze, testing completion, and production release. Milestones align well with while remaining understandable to non-technical stakeholders. This makes milestone charts in project management more effective for cross-functional reviews. Teams can connect development progress directly to business outcomes.
Development milestone tracker template
This development milestone tracker template is suitable for long-running initiatives with multiple parallel workstreams. It allows teams to define milestones by phase, dependency, or delivery risk. The structure supports both technical and non-technical development projects. Examples of project milestone financial charts can also be layered into this template for budget tracking.
TV show milestone tracker template
This TV show milestone tracker template is built for creative production environments with fixed delivery windows. It tracks milestones such as script approval, shooting completion, post-production, and release readiness. The template helps coordinate creative, technical, and business teams around shared deadlines.
Common mistakes teams make with milestone charts
Despite their simplicity, milestone charts are often misused. Recognizing these mistakes helps teams improve adoption and outcomes.
Treating milestones as task summaries: When milestones simply summarize tasks, they add little value. Milestones should represent significant decision points or deliverables. Project milestone charts lose impact when overloaded with minor events.
Solution: You can maintain a massive list of granular tasks while creating a filtered "Milestone View." If an event doesn't require a stakeholder's attention or a "Go/No-Go" decision, it belongs on the task list, not the milestone chart.
Overloading charts with too many milestones: Too many milestones dilute focus. Executives struggle to interpret progress when every week contains multiple markers. Effective milestone charts in prioritize clarity over completeness.
Solution: Create an "Internal Milestones" for project managers, while executives only need "External/Contractual Milestones." For example, you can build a dashboard in Lark, so an Executive sees only "P0" milestones, while a Department Head sees a "Grouped By Team" view.
Ignoring financial alignment: Many teams fail to align milestones with budget checkpoints. Examples of project milestone financial charts show how financial visibility strengthens governance. Without this alignment, cost overruns remain hidden.
Solution: Every major milestone should have a "Financial Gate." Before a milestone is marked complete, there must be a check: What was the actual spend vs. the budget for this phase?
Using static documents: Static milestone charts quickly become outdated. Teams lose trust when charts do not reflect reality. This is why the best tools for creating milestone charts emphasize live data connections.
Solution: Try to use a product like the Lark Docs timeline add-on to turn a document into an interactive milestone chart. The milestone chart should be a visual representation of the project database—if the database changes, the chart must change instantly.
Conclusion
Milestone charts remain one of the most effective tools for and aligning stakeholders around outcomes. When designed well, they simplify complexity and improve decision-making. However, their value depends on accuracy, ownership, and connection to execution.
As projects grow more dynamic, milestone charts and project management practices must evolve beyond static visuals. Teams increasingly need milestone charts that update automatically, reflect financial realities, and connect directly to tasks and communication. supports this shift by treating milestones as living controls rather than reporting artifacts. For teams seeking clarity without overhead, this approach makes milestone tracking both practical and sustainable.
Turn your milestone chart into an actionable plan
FAQs
Can milestone charts replace Gantt charts entirely?
Milestone charts highlight key outcomes, while show detailed task sequencing. In many cases, teams use both together. Milestone charts in project management provide executive clarity, while Gantt charts support delivery planning. Platforms like Lark allow both views from the same data.
How do milestone charts support executive reporting?
Executives need concise progress indicators. Project milestone charts summarize delivery without operational noise. Examples of project milestone financial charts are especially useful for budget oversight. This makes milestone charts ideal for leadership reviews.
What's the best way to track milestone dependencies?
Dependencies should be explicit and linked to the underlying work. Manual tracking often fails as projects evolve. The best tools for creating milestone charts support linked records and automated updates to maintain accuracy.
How do agile teams adapt milestone charts for iterative delivery?
use milestones to represent release readiness or value delivery rather than a fixed scope. Milestone charts in project management remain flexible by focusing on outcomes instead of sprint tasks. Tools like Lark support this by updating milestones as work changes.
Related reading





























