Creating a Gantt chart doesn't require expensive software. Many teams still rely on spreadsheets to visualize timelines and track progress. In this guide, you'll learn how to make Gantt chart in Google Sheets manually, common mistakes to avoid, and when it's time to move beyond spreadsheets. Let's get started.
What's a Gantt chart?
A is a visual timeline that displays project tasks along a horizontal date axis. Each task appears as a bar that starts on its scheduled date and extends to its planned completion. This format helps teams understand task duration, dependencies, and overlaps at a glance.
Gantt charts are widely used in project management because they provide a clear overview of progress and deadlines. They help identify bottlenecks, coordinate workloads, and communicate expectations with stakeholders. Whether you're managing a product launch or a marketing campaign, a Gantt chart keeps everyone aligned.
Why teams still use Google Sheets for Gantt charts
Despite the availability of modern tools, many teams still rely on spreadsheets for Gantt charts.
- Free and accessible: Google Sheets is free and only requires a Google account to get started, making it accessible to individuals and . This removes budget barriers and allows anyone to build basic project timelines without additional software costs.
- Easy sharing: Sheets can be shared instantly through a link, allowing teammates to view or edit files in real time. This makes it convenient to gather feedback, review progress, and keep everyone aligned without sending multiple file versions.
- Familiar spreadsheet interface: Most professionals already use spreadsheets in their daily work, so there is little learning curve. Teams can start building Gantt charts immediately without needing formal training.
- Works for small projects: For projects with few tasks and simple dependencies, Google Sheets is usually sufficient. It provides enough flexibility to visualize timelines without requiring features.
Create dynamic Gantt charts and plan projects faster
What you need before creating a Gantt chart
Before building a Gantt chart, it's important to gather the right project information. Having clear inputs upfront ensures your timeline is accurate, easy to update, and useful for and dependencies throughout the project lifecycle.
- Task list: A task list defines all the work that needs to be completed to deliver the project. Each task should be clearly named and broken down to a manageable level so timelines are realistic. Well-defined tasks make it easier to assign owners, estimate effort, and track progress.
- Start and end dates: Start and end dates determine when each task begins and finishes on the timeline. These dates help visualize the overall project duration and identify overlaps between activities. Consistent and realistic dates are essential to avoid schedule conflicts and delays.
- Dependencies: Dependencies show how tasks are connected and which activities rely on others to be completed first. helps prevent bottlenecks and sequencing issues. They also allow teams to understand the impact of delays on the overall project schedule.
- : Milestones represent key checkpoints or major achievements in a project. They help track progress against critical goals and keep stakeholders aligned. Milestones also make it easier to review progress and ensure the project stays on track.
How to make a Gantt chart in Google Sheets manually
Creating a Gantt chart in Google Sheets involves setting up your data and using charts to simulate a project timeline. While it doesn't offer a built-in Gantt view, you can achieve the same result with careful formatting. Follow the steps below to build a clear, functional Gantt chart for simple project tracking.
Step 1: Organize schedule data in a table
Start by creating a structured table in Google Sheets to hold your project schedule. Include columns for task name, start date, end date, and duration. Ensure all dates use the same format to avoid calculation errors. A clean data layout helps Google Sheets and makes later chart creation smoother and more accurate.
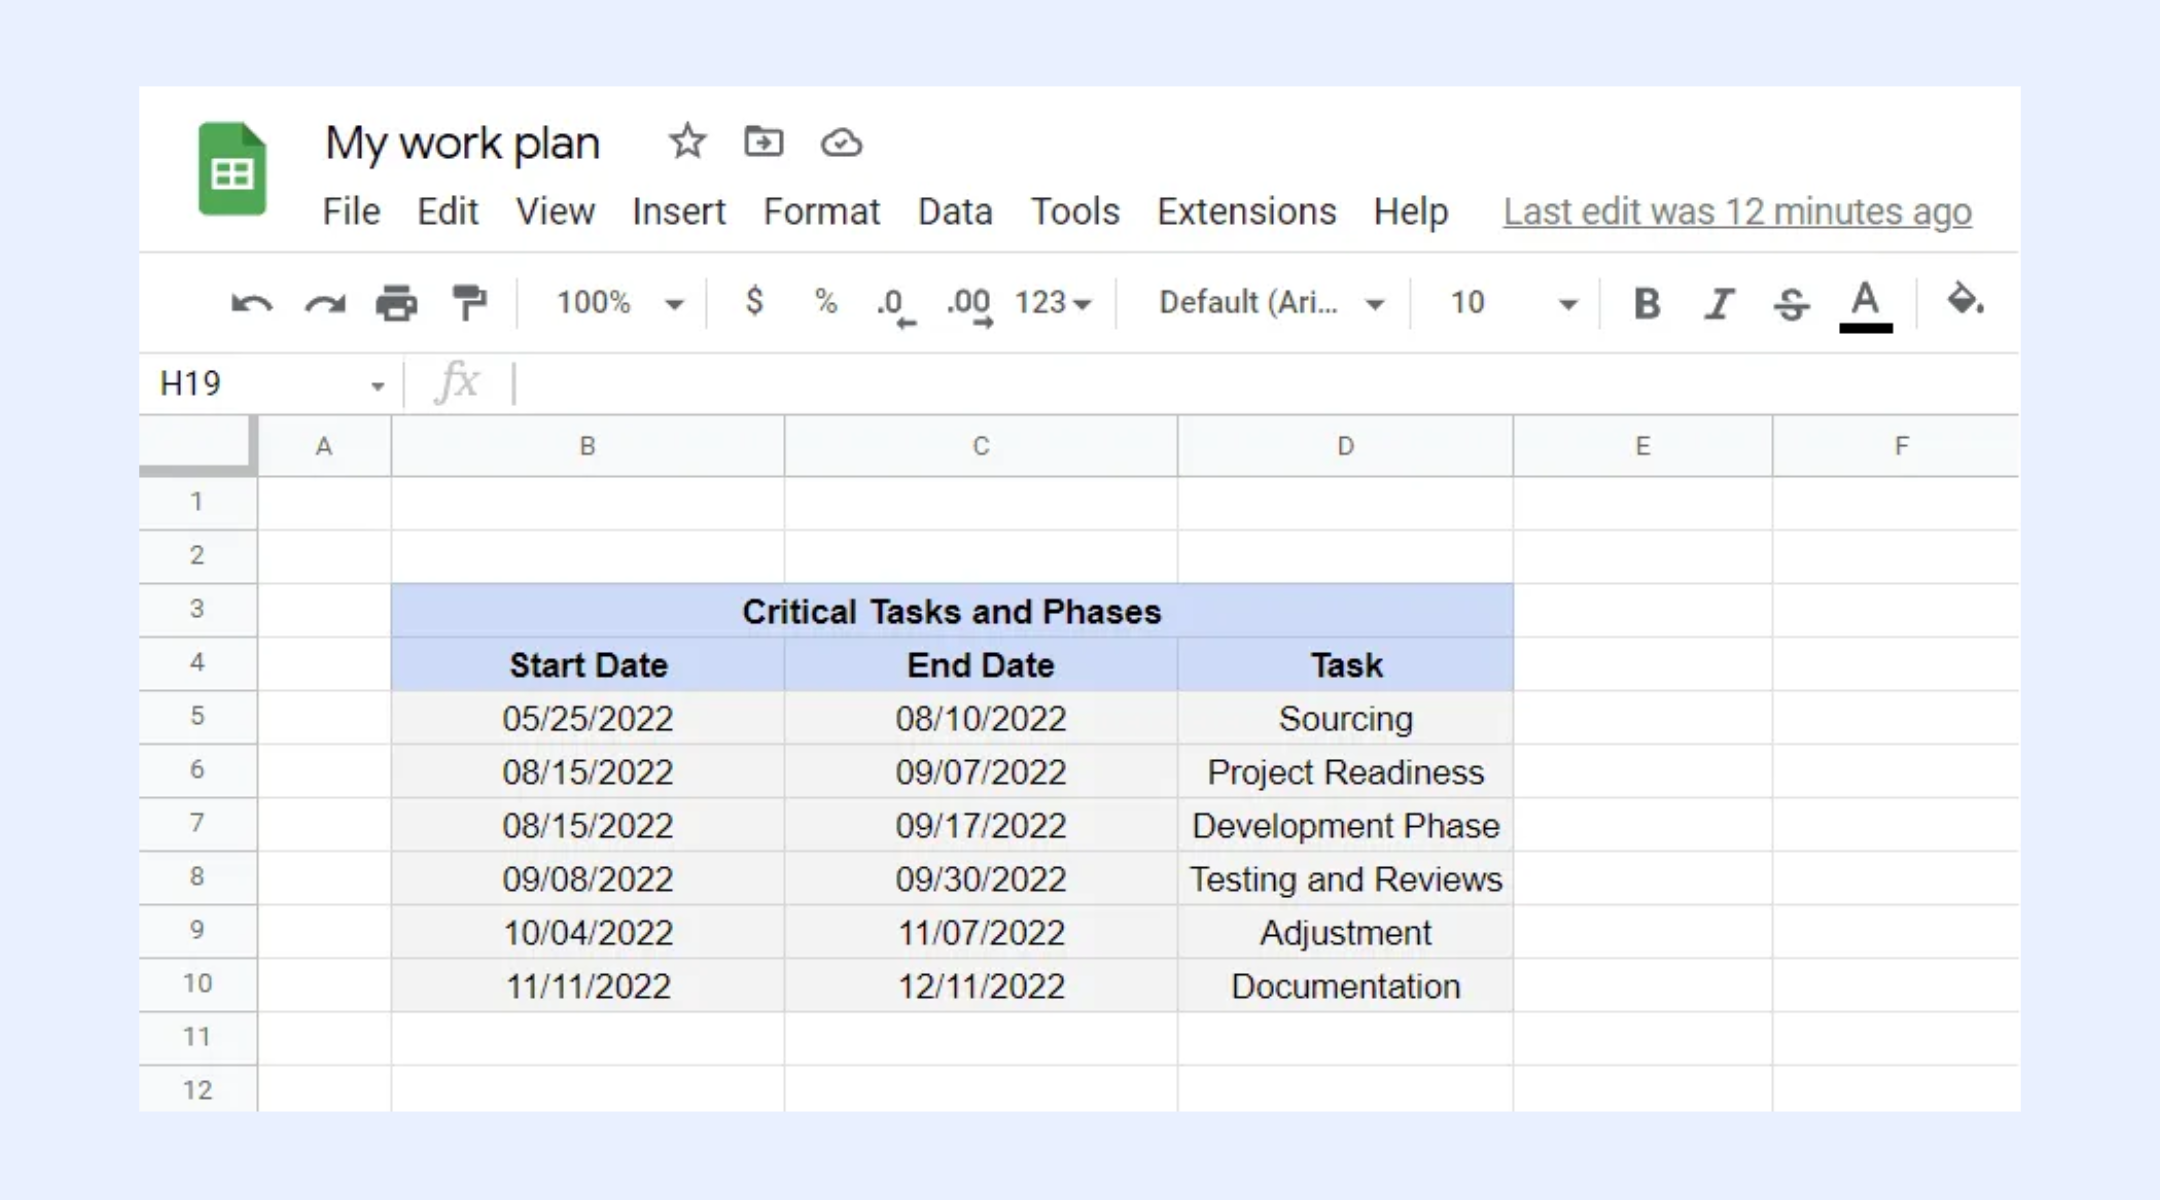
Image source: google.com
Step 2: Add task duration table
Next, create a separate column or table to calculate task duration. Subtract the start date from the end date to determine how long each task will take. This numerical duration is essential for building the visual bars in your Gantt chart. Double-check formulas to ensure accurate results, as incorrect durations will distort your project timeline.
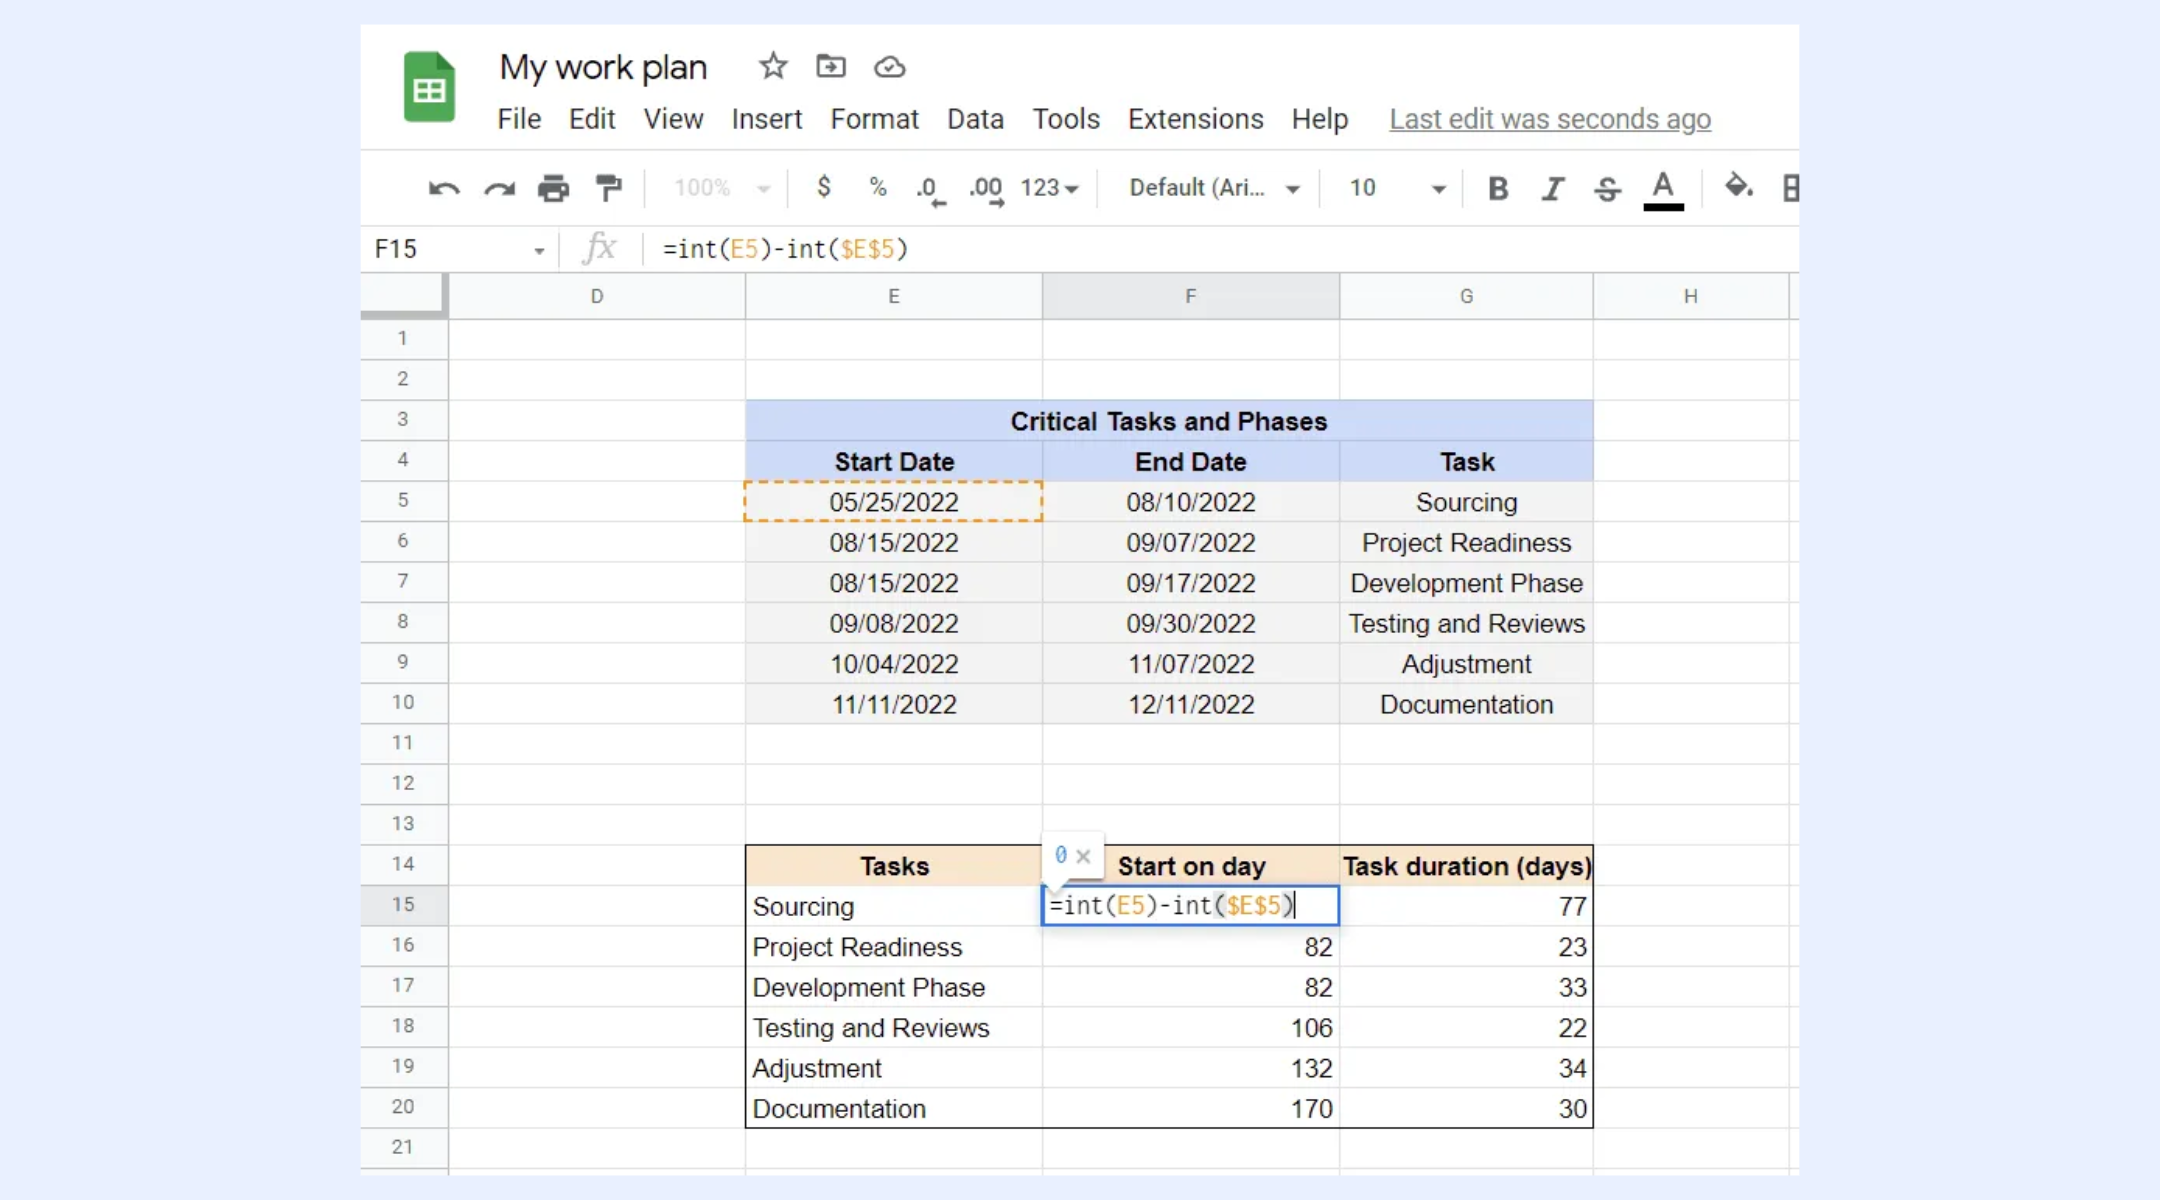
Image source: google.com
Step 3: Insert a Stacked bar chart
Highlight the start date and duration columns, then insert a stacked bar chart from the chart menu. This format allows one bar to represent the start offset, while the second bar shows task length. The stacked layout visually mimics a Gantt timeline, showing when tasks begin and how long they last across your .
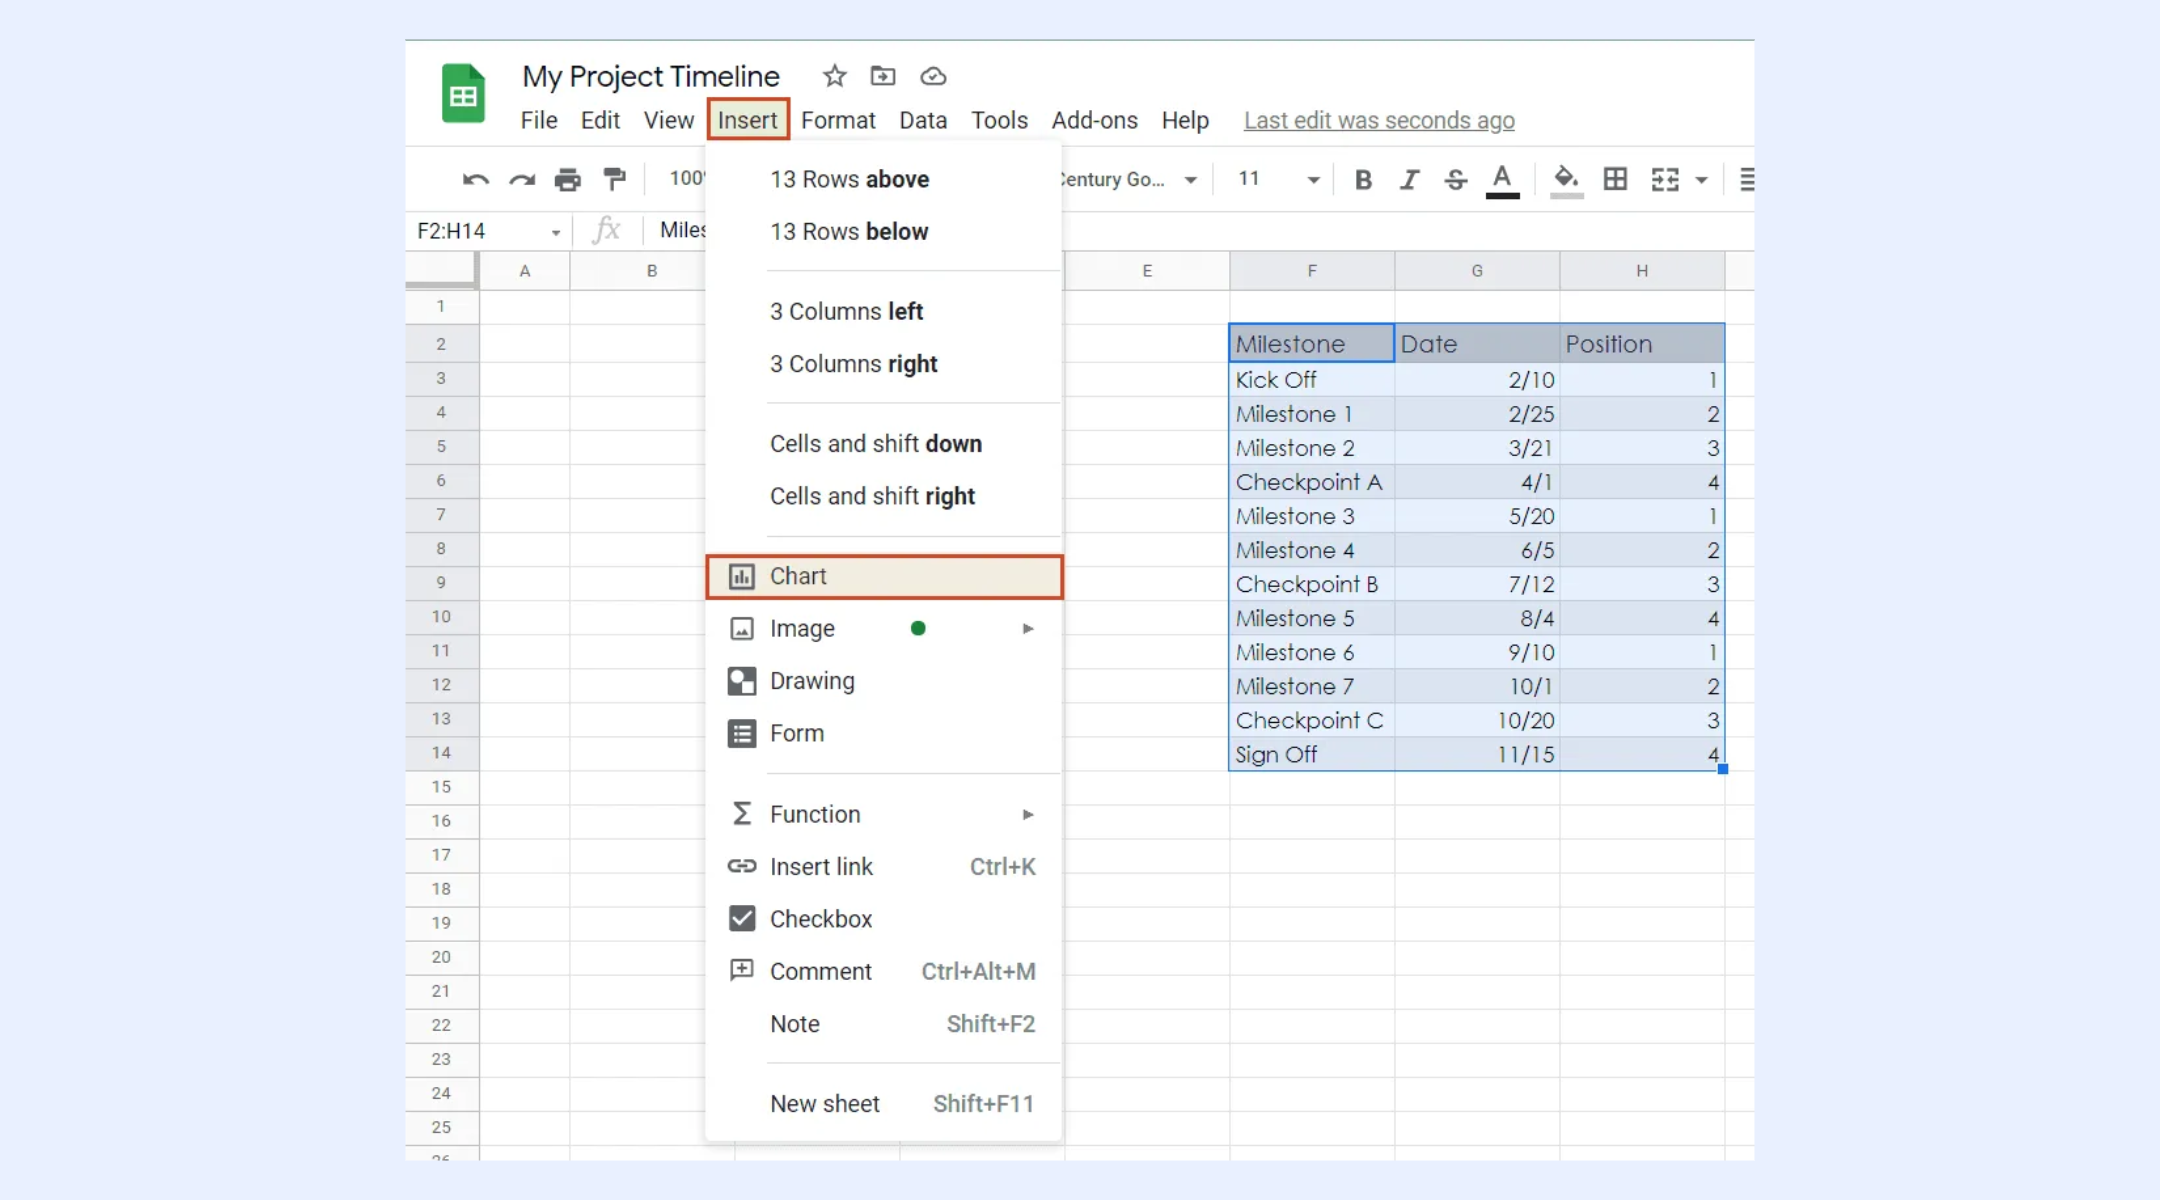
Image source: google.com
Step 4: Change chart bar appearance
Adjust the bar colors to improve clarity. Make the start date bar transparent so only the duration bar remains visible. This creates the classic effect. Customize colors for different task categories if needed. Clear visual contrast helps users quickly understand timelines and identify overlapping or dependent tasks.
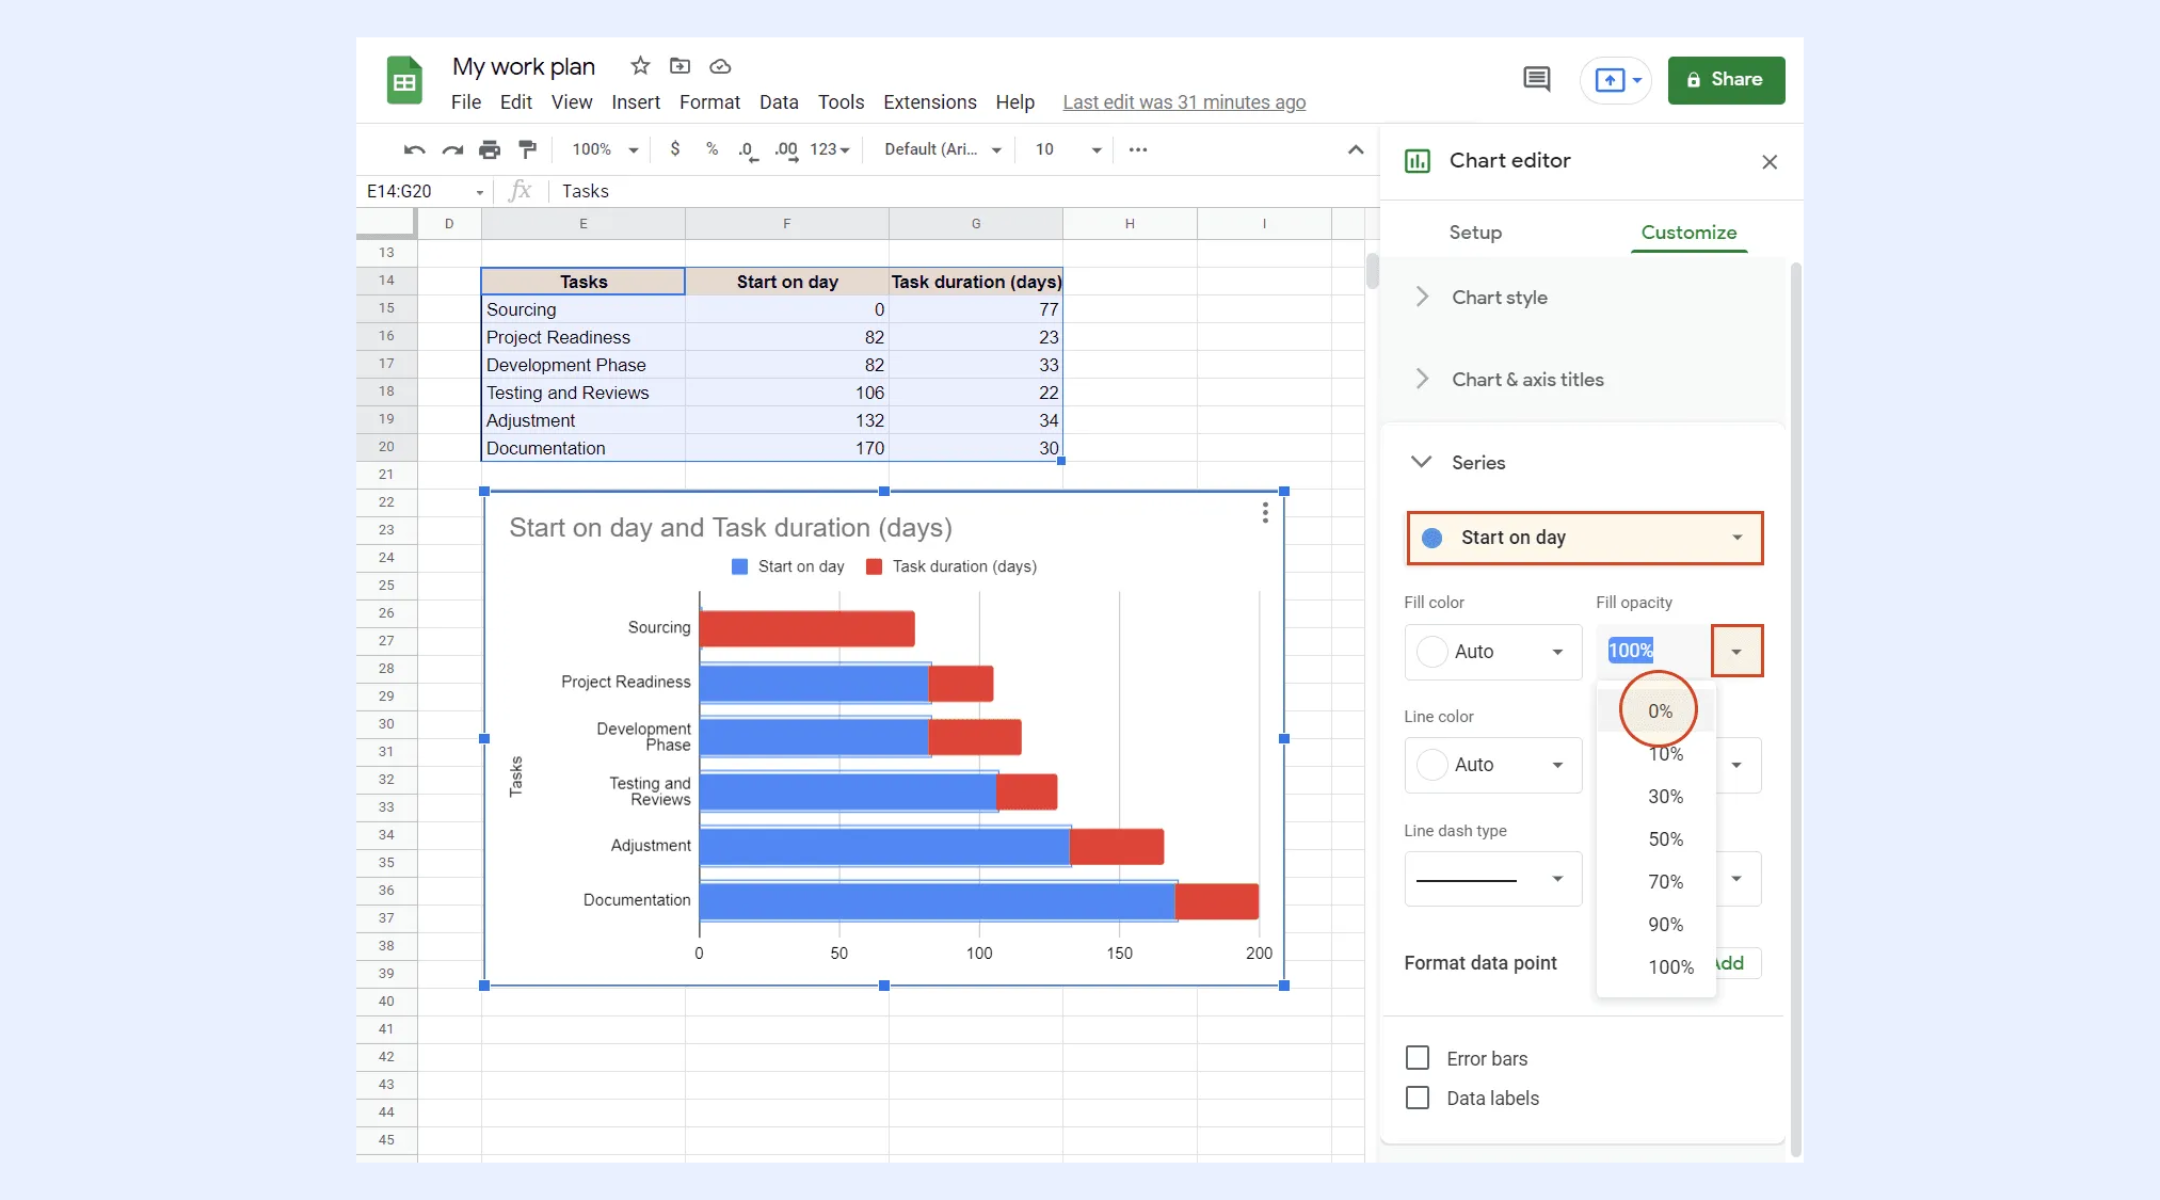
Image source: google.com
Step 5: Customize your Gantt chart
Refine your chart by editing axis labels, adding a title, and adjusting gridlines for readability. Sort tasks logically, such as by start date or priority. You can also resize the chart and adjust spacing to fit your layout. These final touches make your Gantt chart easier to interpret and more professional for presentations or reports.
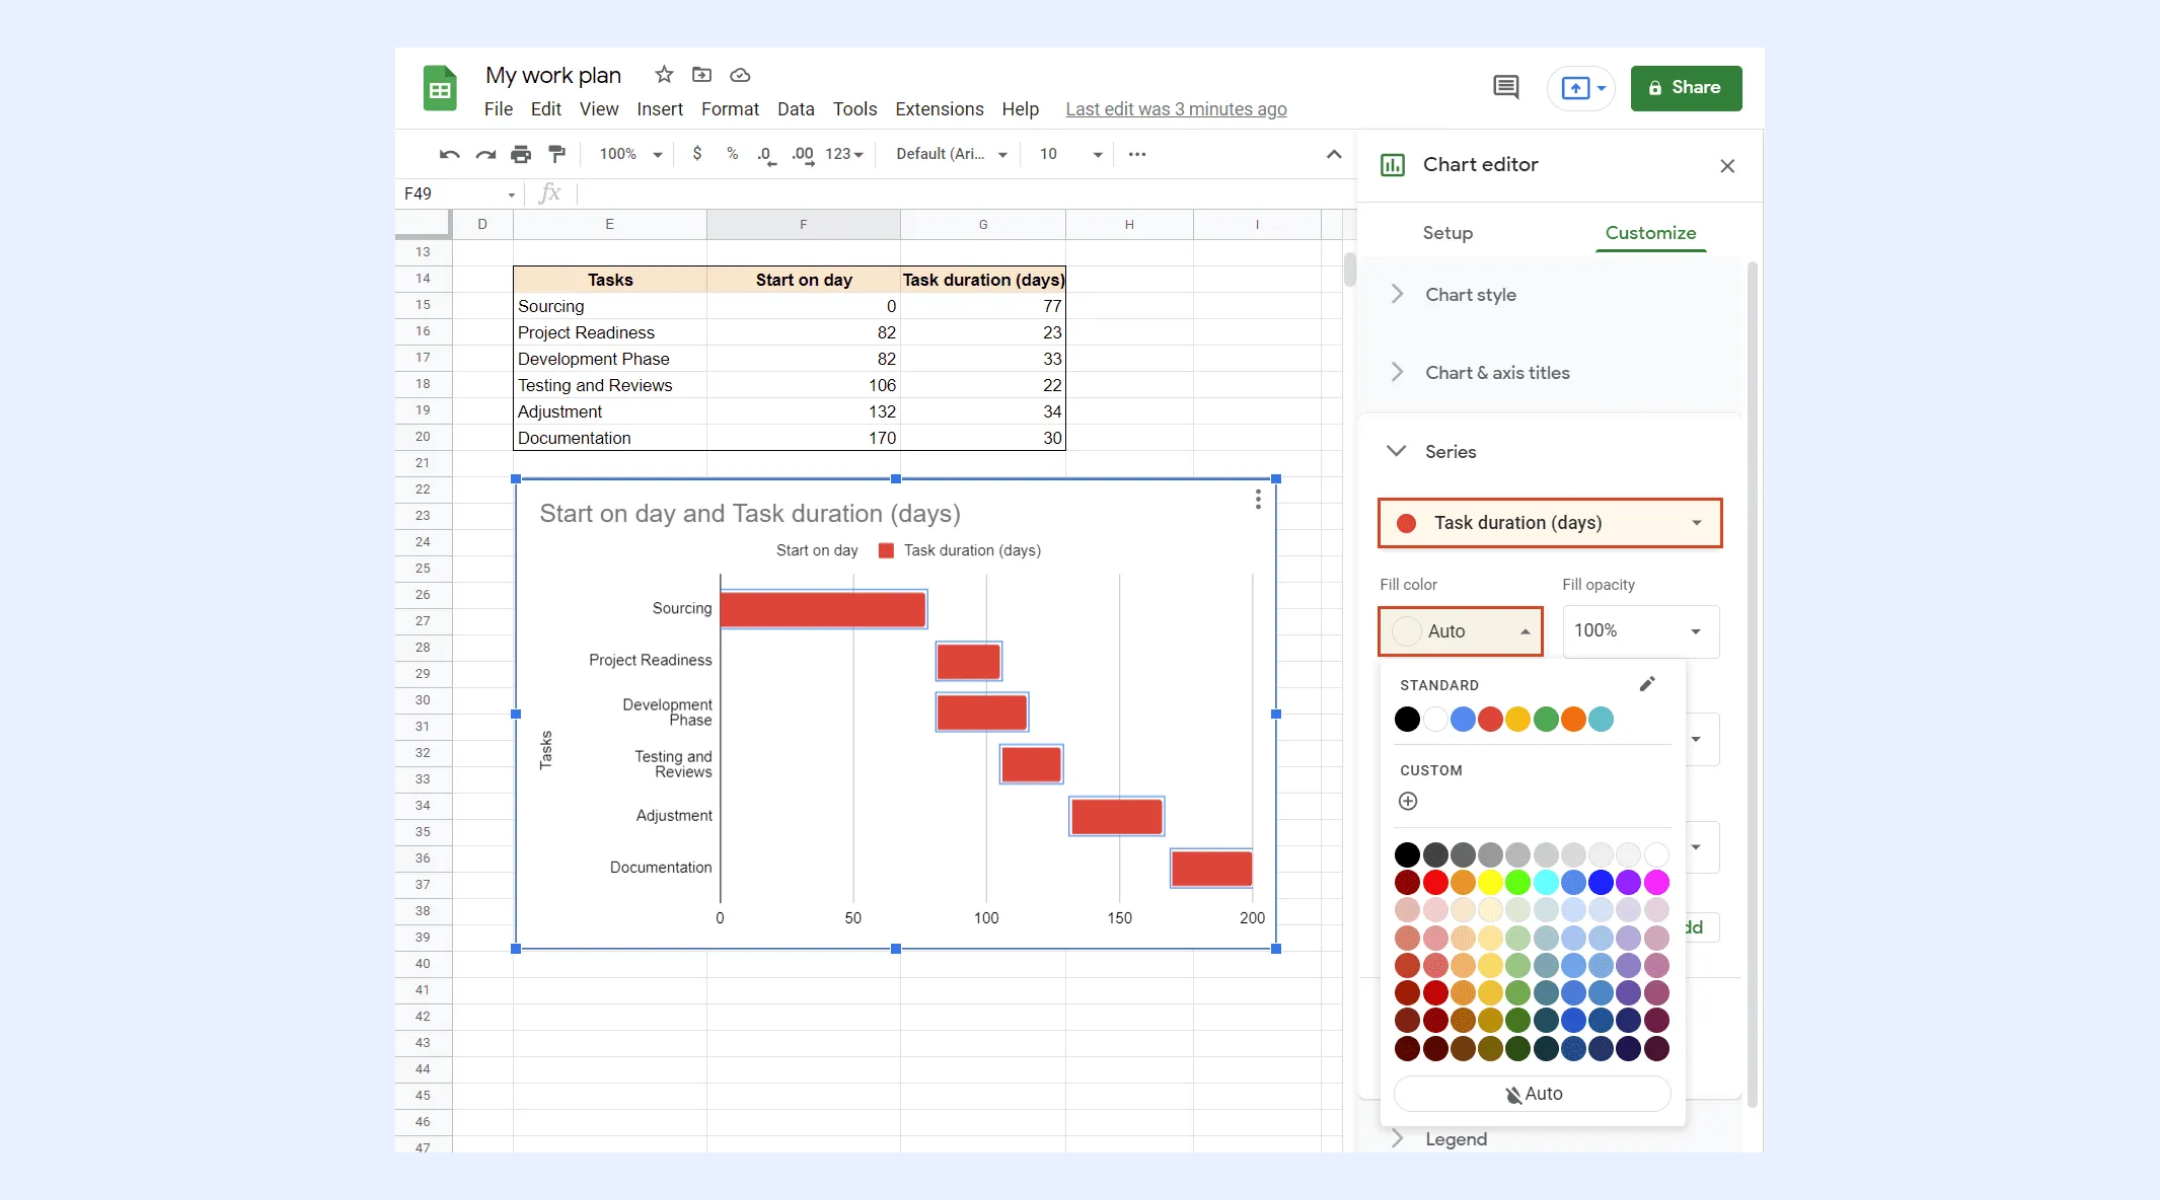
Image source: google.com
Common mistakes when building Gantt charts in Sheets
While can be useful for simple timelines, certain mistakes can quickly make Gantt charts unreliable and hard to maintain. Avoiding these common issues will help keep your project schedule accurate and usable.
- Hard-coded dates: Manually entering dates instead of using formulas makes timelines fragile. Any change requires updating multiple cells, increasing the risk of errors. This often leads to outdated or inconsistent schedules.
- No dependency tracking: Without clear, teams can't see how delays affect the overall timeline. When one task slips, related tasks don't adjust automatically. This can create unrealistic deadlines and hidden bottlenecks.
- Manual updates: Every schedule change must be updated by hand in Sheets. As projects evolve, this becomes time-consuming and error-prone. Manual updates often result in missed changes and inaccurate progress tracking.
- Formatting issues: Inconsistent date formats, misaligned bars, or accidental edits can break the chart. Even small formatting errors can make the Gantt chart hard to read. This reduces clarity during reviews and stakeholder updates.
- Version conflicts: Multiple editors working in the same sheet can overwrite changes. Comments and edits may be missed or misunderstood. Over time, this creates confusion about which version reflects the current plan.
Pros and limitations of Google Sheets Gantt charts
Google Sheets is often the first choice for creating Gantt charts because it's familiar and easy to access. However, while it offers some advantages, it also has clear limitations that become more noticeable as projects grow in size and complexity.
Pros
- Free: Google Sheets is completely free to use and only requires a Google account. This makes it an attractive option for individuals, startups, or small teams that don't want to invest in dedicated . It removes cost barriers for basic timeline planning.
- Flexible formatting: Sheets allows you to customize layouts, colors, labels, and chart styles to match your needs. Teams can adapt the Gantt chart to different project types or presentation requirements. This flexibility is useful for creating simple, visually clear timelines.
- Easy sharing and access: Gantt charts in Google Sheets can be shared instantly using a simple link. can view or edit the timeline from anywhere, making it convenient for quick collaboration and feedback.
- No software installation required: Google Sheets runs entirely in the browser, so there’s nothing to install or maintain. This makes it easy to use across devices and ideal for teams with limited IT support or mixed operating systems.
Limitations
- No automation: All updates in Google Sheets must be done manually. When dates change, you need to adjust formulas, charts, and formatting yourself. This increases the risk of errors and slows down project updates.
- No real-time dependency logic: Google Sheets doesn't automatically adjust dependent tasks when one task is delayed. Teams must manually identify affected tasks and update dates, which can lead to . This makes it difficult to manage complex project sequences.
- Difficult collaboration at scale: While Sheets supports sharing, collaboration becomes challenging with larger teams. Multiple edits can cause conflicts, and important discussions may be buried in comments. As project complexity increases, maintaining clarity and accountability becomes harder.
Upgrade from spreadsheets to a better project planning tool
Meet Lark: A professional alternative to Google Sheets Gantt charts
When your project outgrows manual spreadsheets, Lark, one of the best , offers a far more powerful and intuitive solution for visual . Unlike Google Sheets, where Gantt charts require manual setup and constant maintenance, Lark provides native Gantt views that automatically transform your task dates into interactive timelines. With built-in dependency logic, real-time collaboration, and automated notifications, it helps teams stay aligned, save time, and manage complexities effortlessly—making it ideal for projects of any size.
Gantt views inside Lark Base
In , the Gantt view is a native visualization that automatically transforms your data fields into a timeline without the need for manual chart configuration. Unlike Google Sheets, where you must build a stacked bar chart to visualize time, it allows you to toggle between a standard spreadsheet Grid and a Gantt chart in one click. You can intuitively drag and drop the time bars to extend durations or shift dates, and these changes instantly update the underlying data across all other views and dashboards. 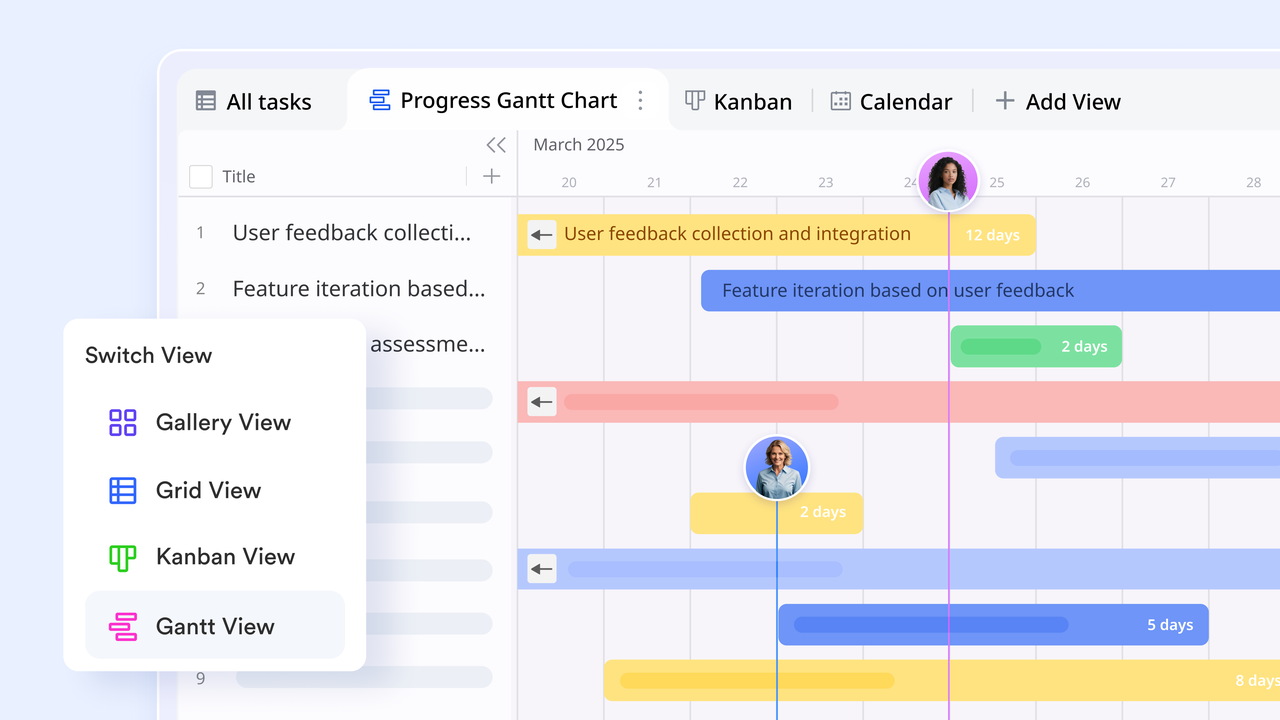
Arrange task dependency with Gantt views
In Lark Tasks, users can build their Gantt chart view by dragging the boundaries of task bars to set start and end dates. The system enables advanced coordination through dependency mapping, allowing you to link tasks, manage time buffers, and check to ensure a logical workflow. To safeguard deadlines, you can highlight the "critical path" to identify the most vital sequences of tasks or mark essential phases as milestones for clear tracking. 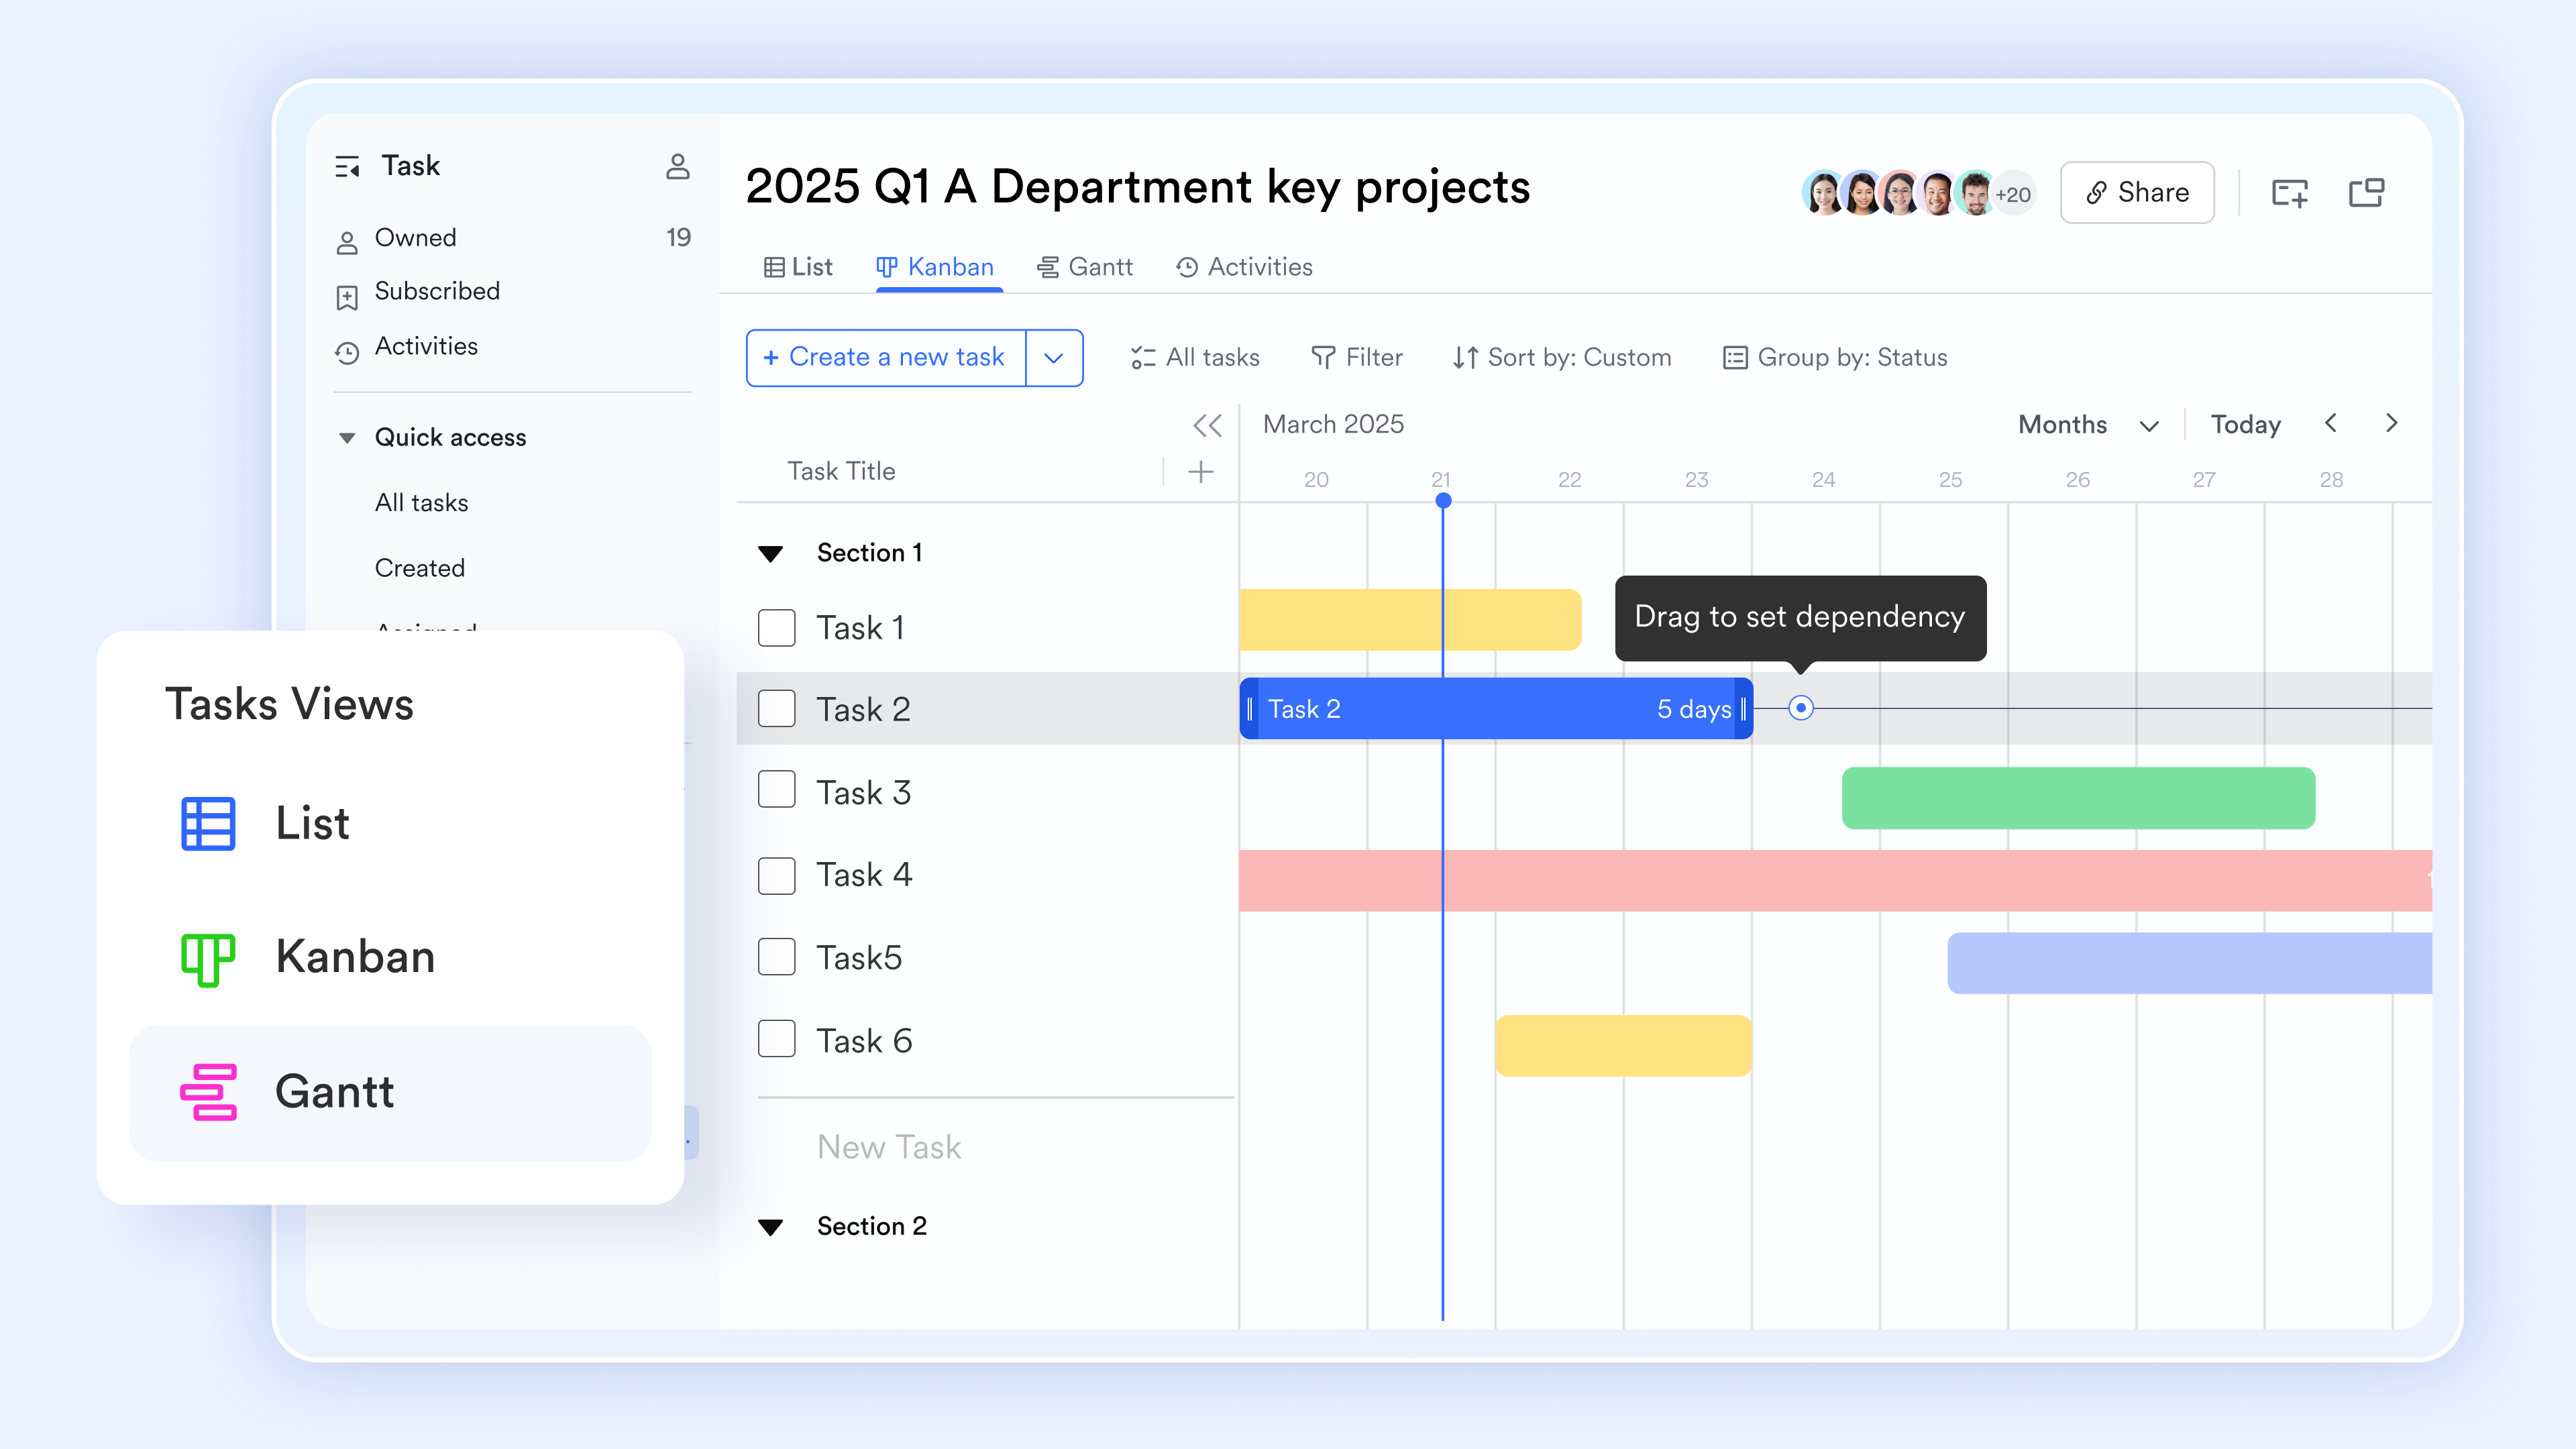
Linked task databases
Lark Base treats your data as a relational database, allowing you to link separate tables for Projects, Tasks, and Resources. In Google Sheets, linking data across tabs usually involves fragile VLookUp or XLookUp formulas that break when rows are added. Link fields (one-way or two-way) allow you to connect records across different tables within the same base, between data. This ensures that a resource's overall location in one project is immediately visible in the wider portfolio timeline. 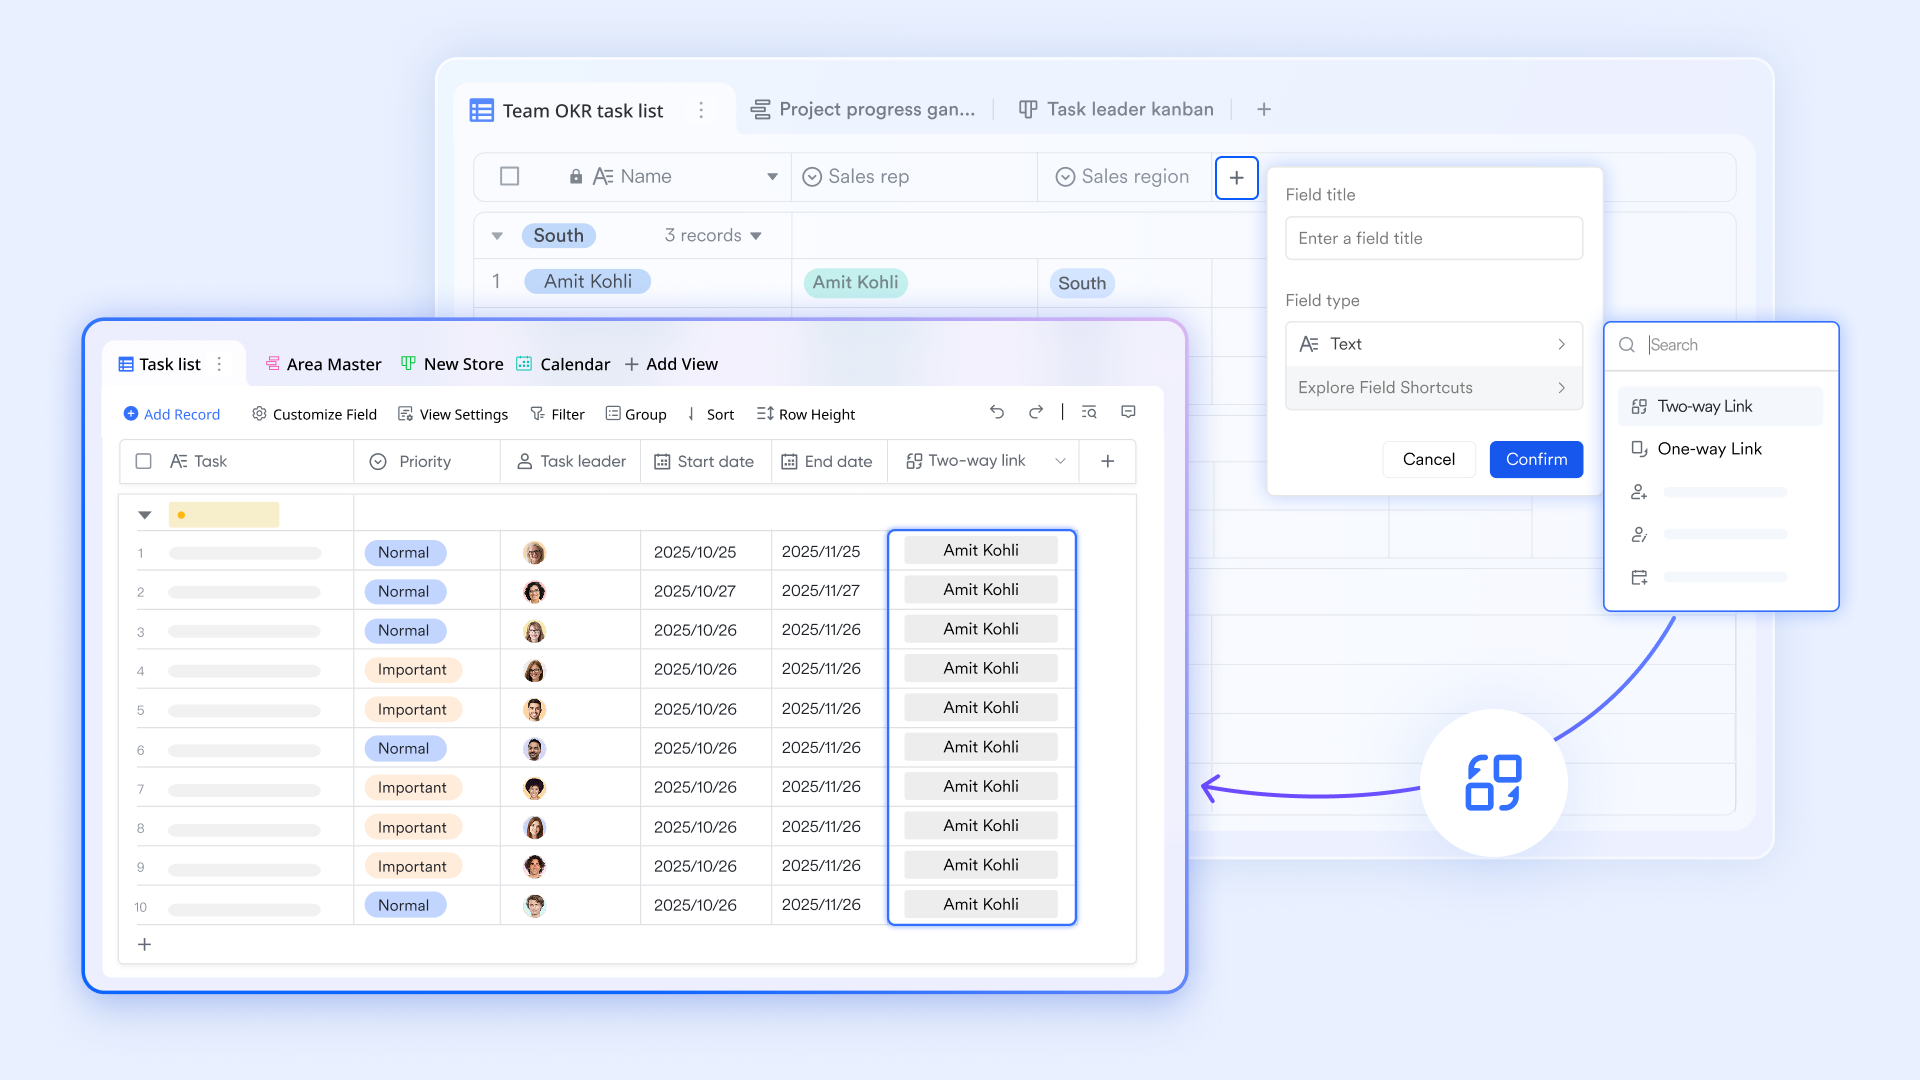
Real-time collaboration
Lark Base excels at by nesting communication directly inside the project record. In Google Sheets, discussions are often buried in cell comments or external emails, but in Lark, every task bar in the Gantt view can be expanded to reveal a dedicated chat thread, file attachments, and an @mention system. This ensures that the context for a "Timeline shift" or "Budget update" is permanently attached to the record, allowing team members to collaborate on the schedule while viewing the live impact of their changes. 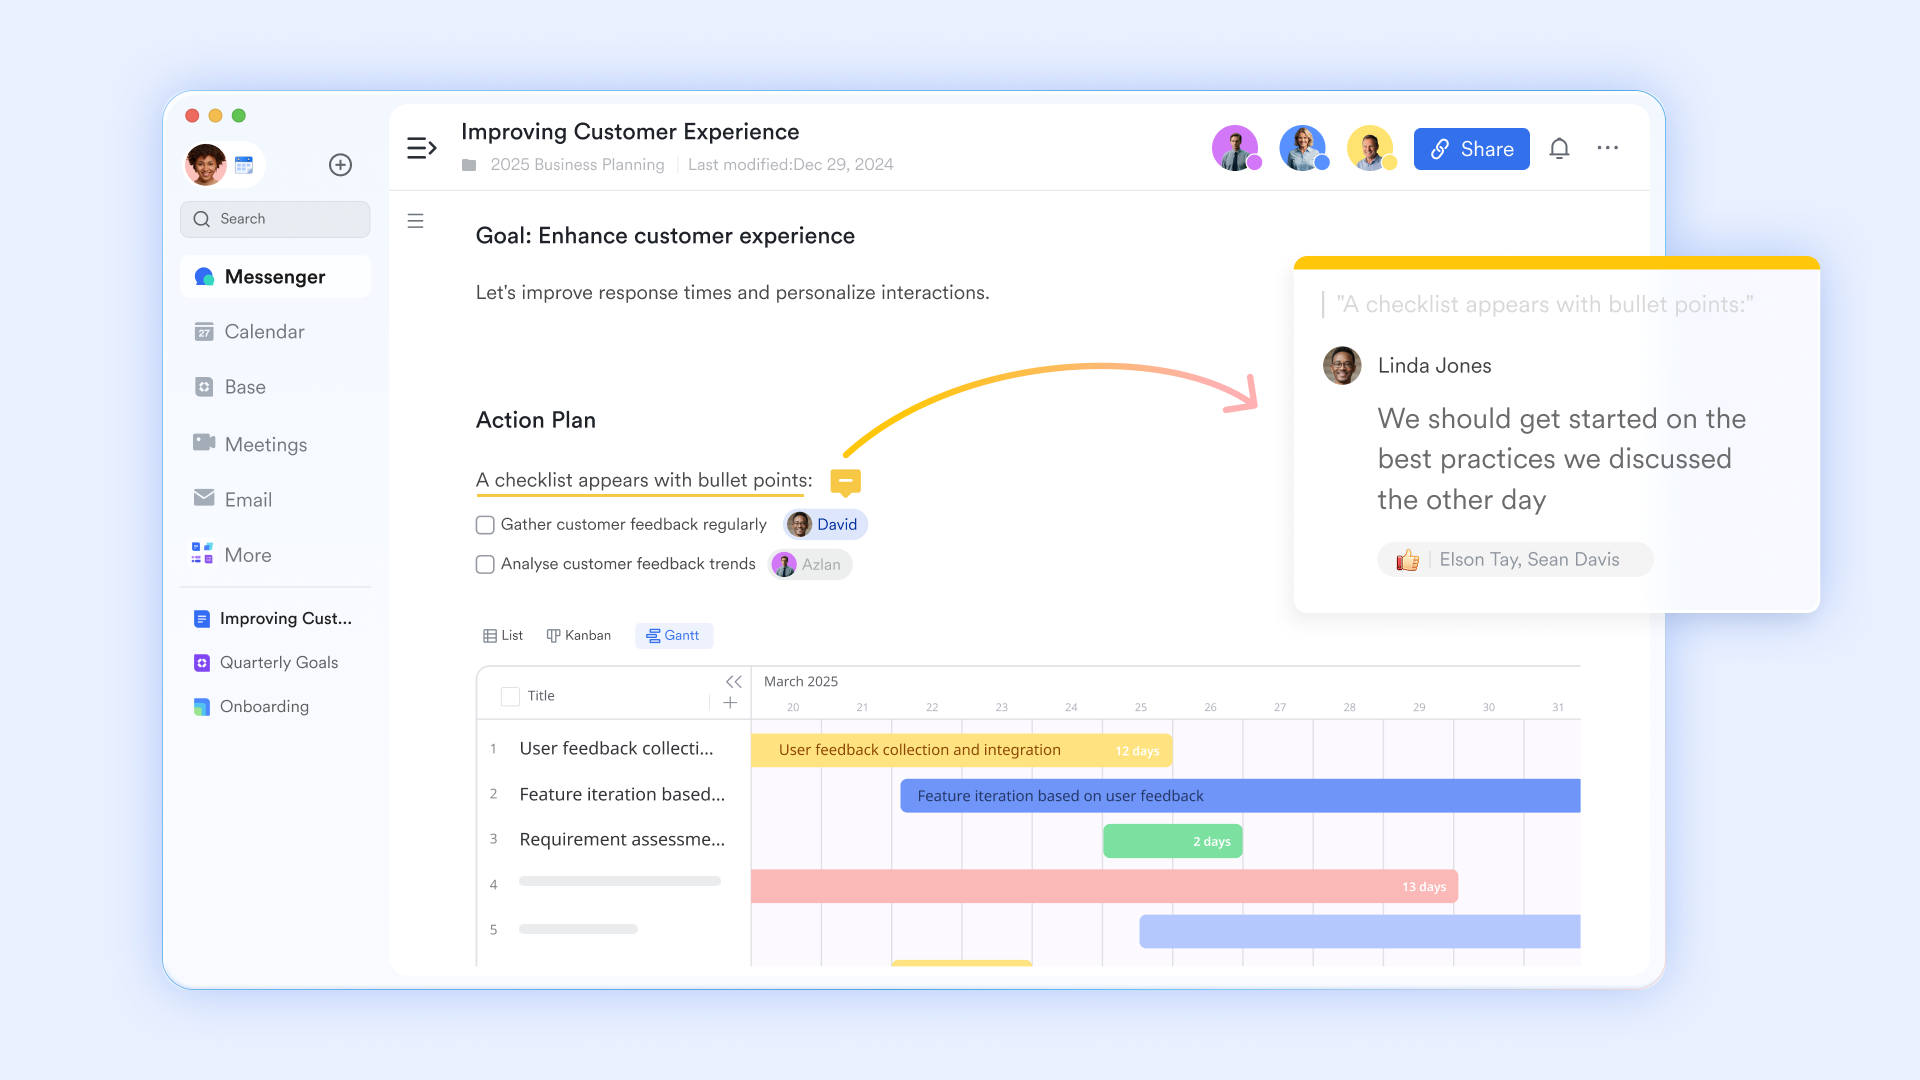
:
- Starter plan: Free forever plan that includes 11 powerful tools for up to 20 users. It also includes 100GB of storage, 1,000 automation runs, AI translations, and more.
- Pro plan: $12/user/month (billed annually) for up to 500 users. It includes everything in Starter plus group calling for up to 500 attendees, 15TB of storage, 50,000 automation runs, and more.
- Enterprise plan: for custom pricing. Supports unlimited users and includes even more automation runs and advanced security, compliance, and management features. Before selecting a productivity suite, it's worth reviewing the latest and plans.
For small teams with simple communication needs

18 months message history
1000 Base automation runs/month
2000 rows per table in Base
Most POPULAR
For companies with comprehensive collaboration and management needs
Unlimited message history
500-participant video meetings
50k Base automation runs/month
20k rows per table in Base
For large companies with advanced security and organizational management needs
Get a personalized demo and pricing
Unlimited message history
500-participant video meetings
15 TB storage + 30 GB storage/user
500k Base automation runs/month
50k Base automation runs/month
Most POPULAR
For companies with comprehensive collaboration and management needs
Unlimited message history
500-participant video meetings
50k Base automation runs/month
20k rows per table in Base
Free ready-to-use Gantt templates you can use today
If you want to skip manual setup and start planning immediately, ready-made Gantt templates are the fastest option. These templates come pre-configured with task fields, timelines, and views, allowing you to visualize project schedules in minutes. Whether you're managing projects, tasks, content, or operations, these free templates help you stay organized, save time, and adapt quickly without building a Gantt chart from scratch.
Project management Gantt chart templates
The is a visual tool for project planning and scheduling. It allows you to display the timeline of a project, the tasks involved, and the project owners. This template is designed to provide a clear view of the project's progress, with tasks displayed against time. It is an excellent tool for managing complex projects with multiple tasks and stakeholders.
Task management template
This is designed to help you keep track of all your tasks in one place. It includes a task list, status kanban, progress gantt chart, and task calendar. The template allows you to add records, configure fields, filter tasks, group tasks, and sort tasks. It also includes a color-coding feature for easy visual reference. The template includes fields for task name, priority, test functionality, assess usability, gather feedback, status, and progress.
OKR management template
The is a comprehensive tool designed to help you manage your Objectives and Key Results (OKRs) effectively. It provides a structured way to track your yearly objectives, their priority, status, start, and end dates. It also allows you to break down objectives into key results, and track their progress using a Gantt chart and a Kanban board. The template is customizable, allowing you to add records, customize fields, and adjust view settings to suit your needs.
Content calendar template
In the world of content creation, organization is key. With multiple campaigns, events, and formats to keep track of, it can be easy to lose sight of the bigger picture. That's where our comes in. This template allows you to keep track of all your content in one place, with fields for campaign names, content format, progress, and associated events. It also includes a Gantt chart for visualizing your content timeline and a Kanban board for tracking progress.
New media podcast content creation management template
Creating a podcast involves a lot of moving parts - from selecting content topics, scheduling production, to managing the release of episodes. is designed to help you streamline all these processes. It allows you to track and manage your podcast production schedule, customize fields to suit your needs, and even view your schedule in a Gantt chart for a visual representation of your timeline. It also includes fields for the channel, topic or title, and host.
Google Sheets vs Lark Gantt comparison
Comparing Google Sheets and Lark highlights how project timeline tools have evolved. While Sheets offers basic charting and flexibility, it lacks automation and for growing teams. Lark, built with modern project needs in mind, delivers real-time views, dependency logic, and smarter workflows to help teams plan and execute more effectively.
Choose Google Sheets if:
- You manage small or short-term projects.
- You only need basic timelines or simple Gantt charts.
- Your team is comfortable with manual updates and formulas.
- Collaboration needs are minimal.
Choose Lark if:
- You handle complex or long-term projects with dependencies.
- Your team requires real-time collaboration and live updates.
- You want automated workflows, smart alerts, and scalability.
- You need a structured system that grows with your team.
In short, Sheets works for simple planning, while Lark is better suited for dynamic, fast-moving project environments.
Conclusion
Google Sheets is a practical starting point for creating simple Gantt charts, especially for small projects with limited tasks and minimal dependencies. It's free, familiar, and flexible enough for basic timeline visualization. However, as projects grow larger, involve multiple teams, or require frequent updates, spreadsheets quickly become hard to manage and error-prone. This is where modern tools make a real difference. With native Gantt views, automated dependencies, , and built-in notifications, offers a more reliable and scalable way to manage project timelines. For teams seeking clarity, speed, and control, moving beyond spreadsheets is often the smartest next step.
Upgrade your workflow beyond spreadsheets
FAQs
Can you make a Gantt chart in Google Sheets?
Yes, you can create a Gantt chart in using a stacked bar chart. However, it requires manual setup and ongoing updates whenever dates or tasks change.
Is Google Sheets suitable for complex projects?
Google Sheets works best for small, simple projects. For complex projects with many dependencies and frequent changes, it can become difficult to maintain and prone to errors.
Does Google Sheets support task dependencies?
Not natively. Dependencies must be tracked manually, and task dates do not update automatically when a related task changes.
What is a better alternative to Google Sheets for Gantt charts?
Tools like Lark offer native Gantt views, automatic dependencies, real-time collaboration, and alerts, making them more effective for growing teams and complex projects.
Related reading