














Project Management KPIs Explained: Metrics, Dashboards, and Practices

Ryan Tanner
Product Marketing Specialist
Sep 18, 2026
Ryan Tanner
Sep 18, 2026

16 min read


Every project aims for the same outcome: success delivered on time, within budget, and aligned with business goals. But achieving that consistently depends on one crucial factor: tracking the right project management KPIs. KPIs, or key performance indicators, turn data into directions. They help teams see whether projects are progressing as planned, where risks are forming, and how decisions affect overall performance. Without them, even the best-planned projects can drift off course.
This guide breaks down what project management KPIs are, why they matter, key types and examples, how to visualize them on dashboards, and how tools like Lark help teams monitor and act on insights in real time.

What are project management KPIs?
Project management KPIs (key performance indicators) are measurable metrics that help managers evaluate how effectively a project meets its objectives. These indicators track critical aspects such as time, cost, quality, risk, and stakeholder satisfaction, giving teams a data-driven way to monitor performance. In project management, KPIs act as a bridge between goals and outcomes, revealing whether projects are on schedule, within budget, and aligned with expectations.
Common KPIs in project management include schedule variance, budget health, resource utilization, and client satisfaction scores. By consistently measuring these project management metrics, teams can identify risks early, improve planning accuracy, and enhance overall project delivery. Whether you're tracking construction project management KPIs or digital workflow metrics, having a clear KPI framework ensures accountability and transparency. Ultimately, project management KPIs turn performance data into actionable insights that drive smarter decisions and continuous improvement.
Types of project management KPIs
Project management KPIs come in many forms, each highlighting a different aspect of performance. From tracking timelines and budgets to assessing quality and risk, these metrics give managers a complete picture of project health. Choosing the right mix of project management KPIs ensures balanced visibility across operations, outcomes, and team productivity.
Time KPIs
Time KPIs measure how effectively a project adheres to planned schedules and how quickly work moves through the delivery pipeline. They show whether project milestones, tasks, and overall delivery are on target.
Key metrics & examples
- Schedule variance (SV): Schedule variance (SV) equals earned value minus planned value. If the schedule variance is greater than zero, the project is ahead of schedule. If it is less than zero, the project is behind schedule.
- Schedule performance index (SPI): The Schedule performance index (SPI) is calculated by dividing earned value by planned value. If the schedule performance index is less than one, the project is progressing more slowly than planned.
- On-time completion rate: The percentage of tasks completed by the planned due date
- Cycle time/lead time: Average time to complete a task or process.
- Milestone slippage: Number or percentage of milestones delayed vs planned.
How to monitor
- Use Gantt and timeline views for visual dependency tracking.
- Display SV and SPI as trend lines on dashboards to spot creeping delays.
- Combine task-level cycle time charts with resource-level workload views to find causes.
Best practices
- Track both task-level and phase-level time KPIs.
- Use rolling averages for cycle time to smooth short-term noise.
- Pair time KPIs with resource utilization to understand the cause of delays.
Common pitfalls
- Focusing only on milestone dates and ignoring task-level slippage.
- Not accounting for dependencies, a delayed dependency can cascade.
- Using raw completion counts without normalizing for task complexity.
Cost KPIs
Cost KPIs measure financial performance, whether actual spending aligns with budgets and forecasts, and whether the project remains profitable or cost-effective.
Key metrics & examples
- Cost variance (CV): Cost variance is calculated by subtracting actual cost from earned value. If the result is greater than zero, the project is under budget; if it is less than zero, the project is over budget.
- Cost performance index (CPI): Cost performance index is calculated by dividing earned value by actual cost. If the CPI is less than one, the project is experiencing a cost overrun.
- Burn rate: The rate at which a budget is spent over time, typically expressed as dollars per week.
- Budget utilization: The percentage of the total budget used to date.
- Estimate to complete (ETC)/Estimate at completion (EAC): Estimate to complete predicts how much more budget will be needed to finish the project, while estimate at completion forecasts the total cost of the project at its completion.
How to monitor
- Show AC, EV, and PV on the same chart to compare schedule vs cost performance.
- Use burn-rate gauges and EAC trend lines to forecast overruns early.
- Drill down from portfolio to project to task-level expenses for root-cause analysis.
Best practices
- Keep cost data live by integrating timesheets, procurement, and expense reports.
- Assign owners for budget categories (labor, materials, subcontracting).
- Recalculate EAC regularly when significant scope or schedule changes happen.
Common pitfalls
- Ignoring sunk costs vs future commitments when forecasting.
- Omitting indirect costs or contingency from budget calculations.
- Relying solely on final cost numbers rather than combining with earned value metrics.
Quality KPIs
Quality KPIs evaluate deliverable fitness, defects, compliance with specifications, client acceptance, and rework required to meet standards.
Key metrics & examples
- Defect density: Defect density measures the number of defects found per size unit, such as per 1,000 lines of code or per deliverable.
- Rework rate: Rework rate is the percentage of work that requires revision after the initial delivery.
- First-pass yield/acceptance rate: First-pass yield shows the percentage of deliverables accepted without any rework.
- Customer complaints/escaped effects: This tracks issues reported by customers after delivery.
- Test coverage/compliance rate: Test coverage measures the percentage of requirements or checks that have been validated.
How to monitor
- Use defect dashboards that classify by severity, component, and root cause.
- Track acceptance rates and time-to-fix to measure responsiveness.
- Combine quality metrics with schedule/cost KPIs to measure the impact of poor quality on delivery and budget.
Best practices
- Define quality gates at key milestones (design review, QA sign-off, client sign-off).
- Use trend charts (defects over time) to detect systemic quality problems.
- Incorporate peer review and automated checks where possible to reduce human error.
Common pitfalls
- Over-reliance on defect counts without weighting by severity or impact.
- Treating QA as a late-phase activity rather than embedding quality early (shift-left).
- Not correlating quality failures to upstream causes (requirements or design issues).
Workload & Productivity KPIs
These KPIs measure how effectively the team and resources are being utilized and whether productivity is sustainable.
Key metrics & examples
- Resource utilization rate: Resource utilization rate shows the percentage of available time spent on productive project work.
- Throughput: Number of work items completed per unit of time.
- Billable utilization (for services): Billable utilization tracks the percentage of hours billed compared to available hours for services.
- Overtime hours/Workload variance: Overtime hours or workload variance indicates signs of overload or imbalance in the team's workload.
How to monitor
- Use heatmaps or capacity charts showing allocation vs availability.
- Display utilization alongside individual backlog and assigned task counts.
- Monitor throughput trends and cycle-time distribution to detect productivity shifts.
Best practices
- Define capacity in hours, not headcount, and account for non-project work.
- Use workload balancing views to reassign work before overload occurs.
- Track both utilization and outcome metrics (throughput, quality) to avoid optimizing the wrong thing.
Common pitfalls
- Maximizing utilization at the cost of throughput and quality.
- Using utilization as the only productivity metric , high utilization can hide inefficiency.
- Not tracking unplanned work or context-switch overhead.
Risk KPIs
Risk KPIs quantify exposure to potential events that could negatively impact schedule, cost, quality, or scope. They measure both identification and mitigation effectiveness.
Key metrics & examples
- Number of identified risks: The number of active risks currently logged in the risk registry.
- Risk severity index/expected monetary value (EMV): This is calculated by multiplying the probability of a risk occurring by its impact, helping prioritize risks based on severity.
- Open vs mitigated risks: The percentage of risks that have mitigation plans implemented versus those that remain open.
- Time-to-mitigate: The average time taken to implement responses or mitigation strategies for identified risks.
- Issue escalation frequency: The frequency at which risks turn into issues that require escalation to higher management or attention.
How to monitor
- Maintain a risk register view with filtering by owner, status, and EMV.
- Visualize top risks on dashboards and map their trend (emerging, increasing, decreasing).
- Link risks to related tasks, change requests, and budget lines to measure impact.
Best practices
- Score risks with consistent scales for probability and impact.
- Assign owners and deadlines for mitigation actions.
- Conduct regular risk reviews and rehearse contingency plans for high-impact items.
Common pitfalls
- Treating the risk register as a static document instead of a living tool.
- Underestimating low-probability/high-impact risks (black swans).
- Failing to measure mitigation effectiveness, mitigation without validation is risky.
Stakeholder & Team KPIs
These KPIs measure engagement, satisfaction, decision speed, and team health, all of which affect delivery success and project adoption.
Key metrics & examples
- Client satisfaction/NPS: Post-phase or post-project satisfaction scores.
- Stakeholder response time: Average time to provide approvals or feedback.
- Decision turnaround time: Time between request and decision for scope or design choices.
- Team morale/pulse survey scores: Regular, short sentiment surveys.
- Meeting effectiveness: % of meetings with clear outcomes or action items.
How to monitor
- Use short survey widgets and trend the scores over time.
- Track approval workflows and bottlenecks in stakeholder responses.
- Correlate stakeholder delays with schedule variance and change requests.
Best practices
- Make stakeholder KPIs visible on executive dashboards to motivate responsiveness.
- Assign single points of contact for decision-critical stakeholders.
- Run frequent, lightweight pulse checks to catch morale issues early.
Common pitfalls
- Overlooking soft metrics because they're harder to quantify.
- Ignoring the link between delayed decisions and cost/time overruns.
- Treating stakeholder satisfaction as a "nice to have" rather than a project success factor.
Construction project KPIs
Construction projects have domain-specific KPIs reflecting safety, compliance, site productivity, and materials/equipment efficiency. These metrics must integrate field reports, inspections, and procurement.
Key metrics & examples
- Safety incident rate/TRIR: Total Recordable Incident Rate (TRIR) measures the number of safety incidents per hour worked.
- Change order frequency & cost: The number and financial impact of change orders made during the project.
- Equipment utilization: The percentage of uptime versus idle time for critical machinery.
- Material waste percentage: The volume or cost of waste produced compared to materials delivered to the project site.
- Schedule adherence by trade: The on-time performance of different trades, such as electrical, plumbing, and civil work, against the planned schedule.
- Inspection pass rate/rework: The percentage of inspections that pass the first time without requiring rework.
How to monitor
- Combine field data (daily reports, punch lists) with schedule and cost dashboards.
- Use mobile tools to capture safety incidents, photos, and inspection results in real time.
- Map change orders to baseline schedule and budget to calculate true impact.
Best practices
- Make safety and compliance visible KPIs with targets and daily reporting.
- Track productivity by crew and trade, not just project-level aggregates.
- Use earned value and resource-level KPIs together to measure true progress on the site.
Common pitfalls
- Underreporting safety incidents or near-misses.
- Failing to tie change orders to root causes (poor scope definition, subcontractor issues).
- Not capturing real-time field productivity, relying only on weekly or monthly reports, leads to blind spots.
Top project management KPIs to track
Tracking the right project management KPIs ensures every project runs smoothly from planning to delivery. These performance indicators give teams real-time visibility into timelines, budgets, resources, and client satisfaction, helping managers make smarter, data-backed decisions. Here's a closer look at the most essential KPIs in project management:
- Schedule performance: This KPI measures how closely project timelines align with the original plan. By tracking schedule variance and on-time task completion, teams can identify delays early and take corrective action. Strong schedule performance ensures predictable delivery and builds client confidence.
- Budget health: A crucial cost KPI in project management, budget health tracks spending against planned costs. Monitoring this metric helps prevent overruns and ensures resources are used efficiently. Consistent budget control directly impacts project profitability and stakeholder trust.
- Resource allocation: This KPI shows how effectively human and material resources are distributed across tasks. Proper resource allocation avoids overloading team members and minimizes idle time. Balanced utilization improves productivity and ensures deadlines are met without burnout.
- Task execution: Task execution KPIs assess how efficiently project tasks are completed within scope and deadlines. Tracking task completion rates highlights workflow efficiency and identifies bottlenecks. Improved execution ensures smoother progress and better coordination between teams.
- Earned value KPIs: Earned value metrics combine cost and schedule data to measure actual project progress against planned performance. These KPIs reveal whether work completed to date is delivering expected value. They're essential for maintaining financial and operational control throughout a project.
- Change request frequency: This KPI measures how often scope changes occur during a project. A high frequency may signal poor initial planning or shifting client needs. Monitoring this helps managers maintain stability, minimize disruptions, and improve project predictability.
- Client satisfaction: A vital stakeholder KPI in project management. This metric reflects how well deliverables meet client expectations. Feedback surveys, review scores, and repeat business rates help quantify satisfaction. High satisfaction indicates successful communication, delivery, and long-term relationship potential.
- Workload balance: This KPI measures how evenly work is distributed among team members. Uneven workloads can lead to burnout or delays, while balanced allocation boosts morale and efficiency. Regular tracking helps sustain team performance over time.
- Bottleneck indicators: These KPIs highlight stages or processes that slow project flow. Identifying bottlenecks early helps optimize task dependencies and improve overall cycle time. Reducing process blockages enhances project efficiency and keeps delivery schedules intact.
KPI dashboards: What they should include
A well-designed project management KPI dashboard transforms raw data into actionable insights. It helps teams monitor progress in real time, balance workloads, and maintain transparency across every stage of a project. The right dashboard doesn't just report numbers , it empowers proactive decisions and continuous improvement.
- Real-time task and project data: Live project data ensures that managers and team members always have up-to-date visibility into progress. By tracking KPIs in real time, teams can spot delays, resource gaps, or cost overruns immediately. This enables faster responses and keeps projects on schedule.
- Workload charts show how tasks are distributed among team members. They help prevent burnout by showing who's overbooked or underutilized. Balanced workloads improve productivity and ensure consistent execution of tasks across the team.
- Timeline views (Gantt): Gantt-style timeline views visualize task dependencies, deadlines, and milestones. These visual KPIs make it easy to track schedule performance and identify potential overlaps or delays. Clear timelines improve planning accuracy and cross-team coordination.
- Budget and cost trackers: Budget and cost tracking tools help monitor financial KPIs throughout the project lifecycle. They show real-time spending versus planned costs, helping teams maintain healthy budget performance. Accurate financial visibility supports profitability and informed decision-making.
- Issue escalation views: These dashboards track open issues, risk levels, and escalation timelines. By monitoring problem areas early, teams can assign responsibility and resolve challenges before they impact delivery. Consistent issue tracking strengthens project stability and accountability.
- Stakeholder visibility panels: Stakeholder panels summarize project KPIs such as progress, costs, and client satisfaction scores in an accessible view. They enhance transparency by giving clients and executives real-time updates. This clarity builds trust, supports alignment, and improves communication across all stakeholders.
Tracking KPIs effectively requires more than a list of metrics; it depends on having a workspace where data, timelines, communication, and daily work come together. Many teams struggle because their dashboards sit separately from the tools they use to plan tasks, review progress, or communicate updates. This disconnect makes KPI tracking slower, less accurate, and harder to maintain. That's where Lark offers a clearer path forward: by bringing projects, updates, and daily workflows into one connected environment, Lark makes it easier for teams to monitor KPIs in real time and act on them quickly.
Practice the KPIs: Use Lark to track KPIs, manage data, & attain success
Tracking KPIs effectively requires more than static reports; it needs a connected workspace where goals, progress, and collaboration come together. Lark provides teams with a unified environment to define, measure, and act on their project management KPIs in real time. With tools for dashboards, analysis, and communication, it turns KPI tracking into seamless, data-driven execution.
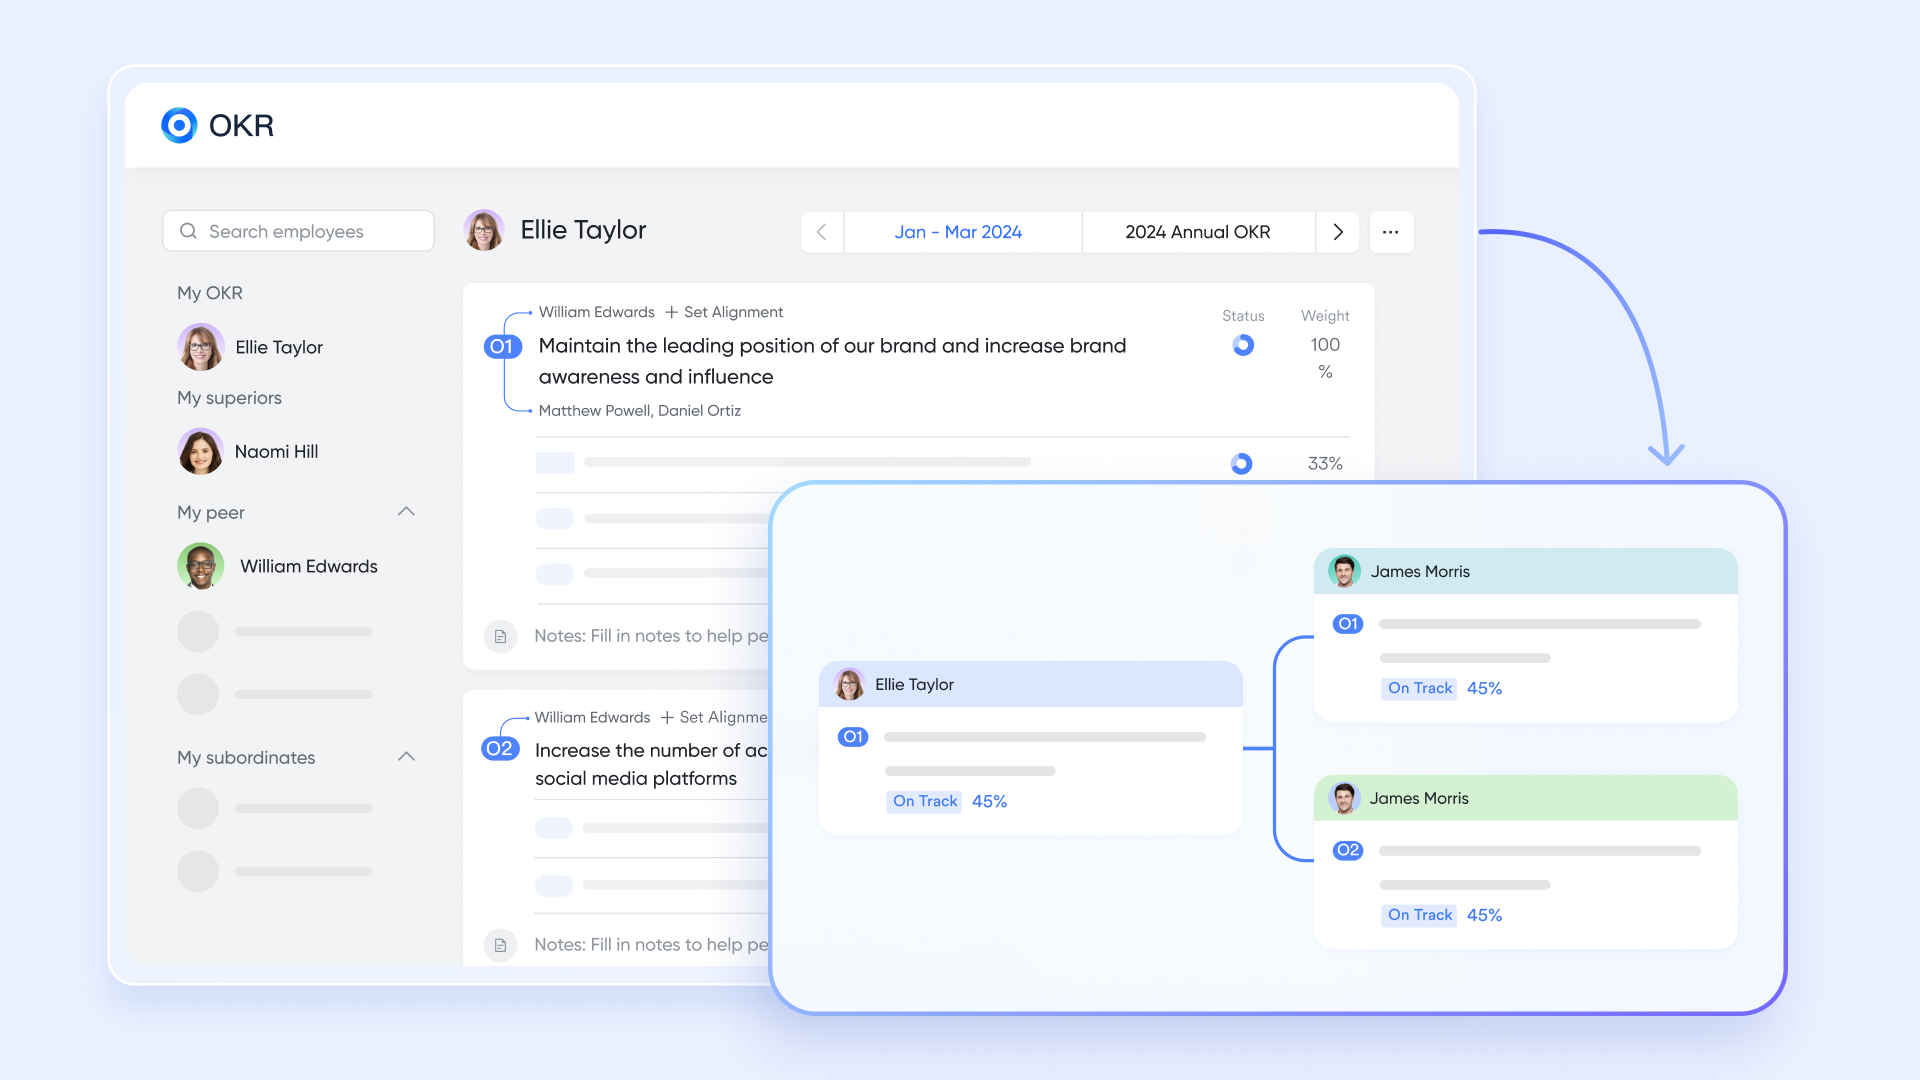
Lark OKR & built-in dashboard for measurable goals and KPI alignment
The Lark OKR allows teams to define clear objectives and attach measurable key results that act as core KPIs for any project. Managers can track progress in real time, ensuring teams stay aligned with broader project goals and organizational priorities. The dashboard highlights progress trends, stalled indicators, and areas where performance needs attention. You can also send follow-up reminders to individuals or entire teams to maintain momentum throughout the KPI cycle. Because updates sync across the workspace, stakeholders always have an accurate view of how work is advancing against expectations. This makes OKR a powerful foundation for structured, transparent KPI tracking.
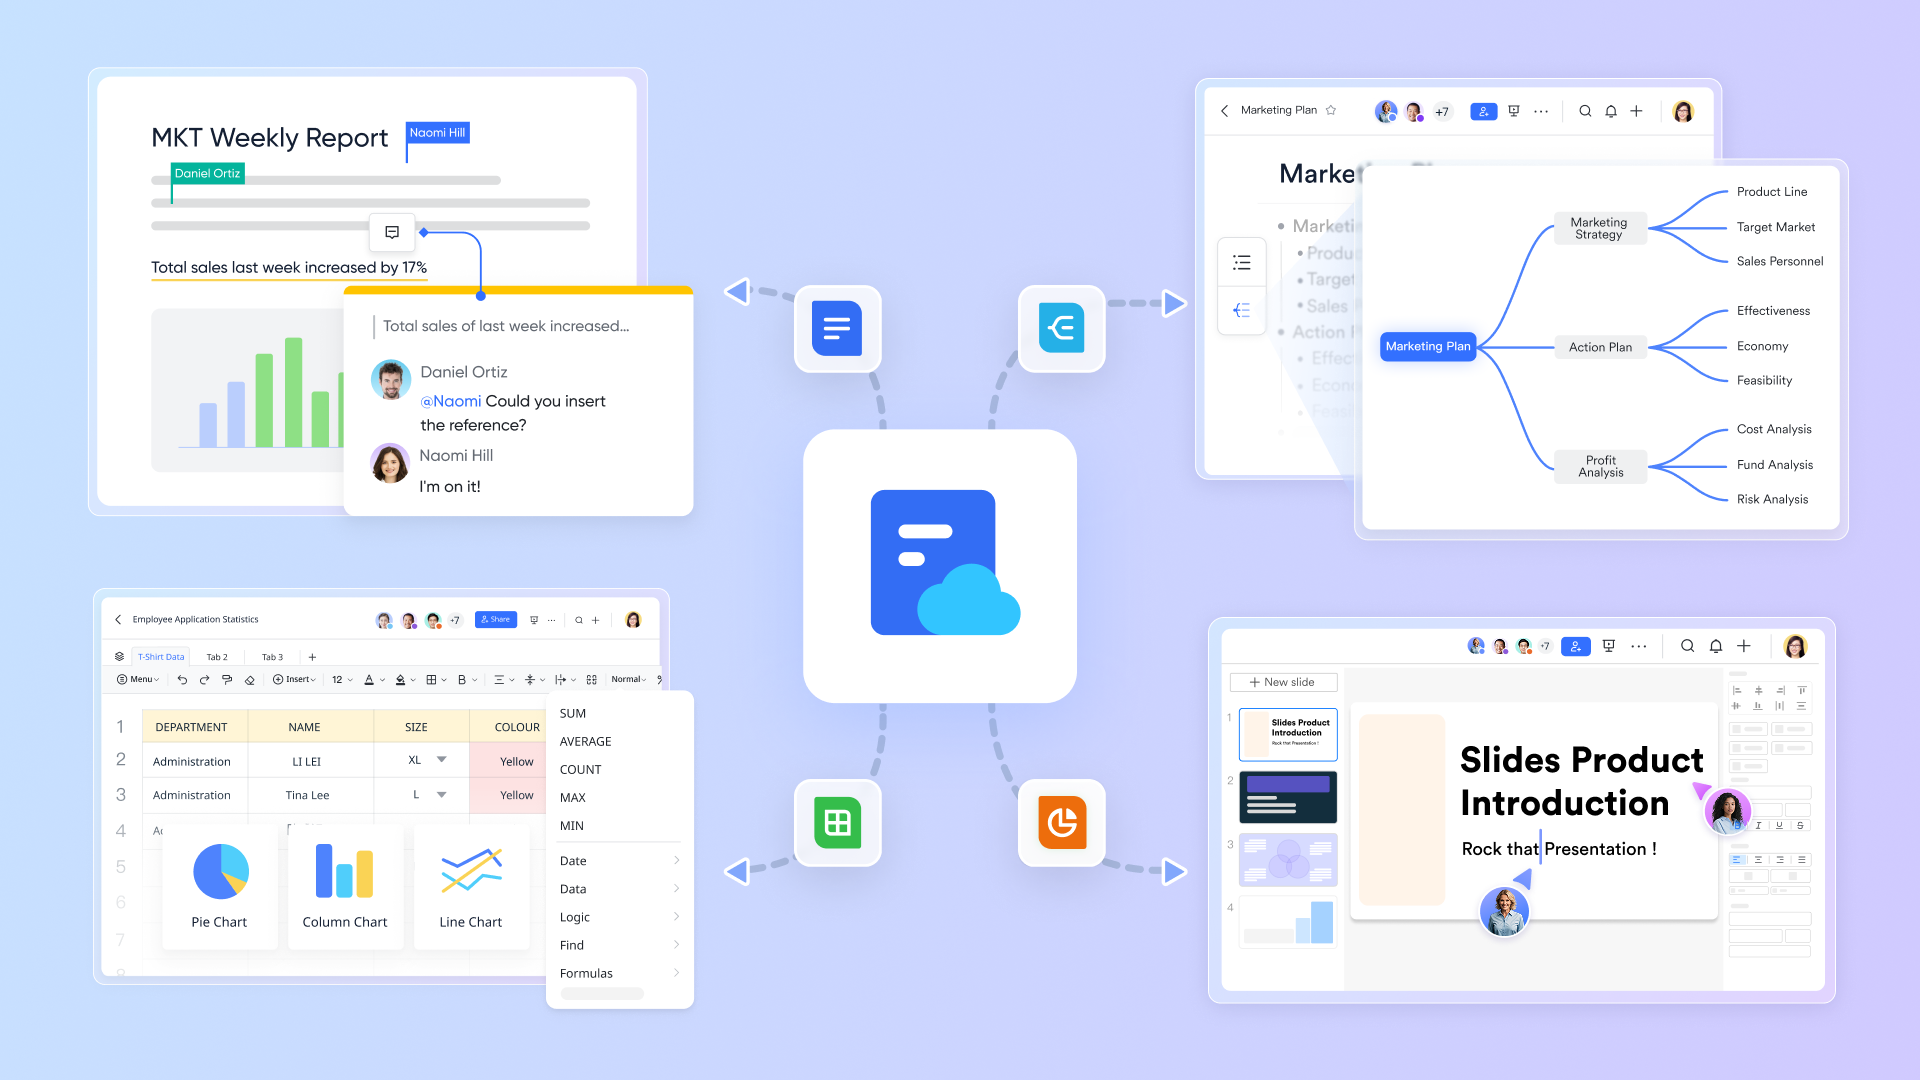
Lark Docs & Lark Sheets for documenting and analyzing KPIs
Lark Docs provides a flexible space to outline KPI frameworks, reporting guidelines, data interpretations, and performance discussions. Meanwhile, Lark Sheets supports more advanced data handling, teams can create tables, formulas, charts, and comparisons that allow deeper KPI analysis. Together, they form a strong toolkit for storing raw KPI data, analyzing trends, documenting insights, and sharing reports across departments. Project managers can create recurring KPI review documents, link related data from Sheets, and maintain a history of performance changes over time. Because both project management tools are collaborative, multiple stakeholders can update metrics, annotate findings, or adjust calculations without version conflicts. This combination gives teams a clear, reliable workspace for KPI management and reporting.
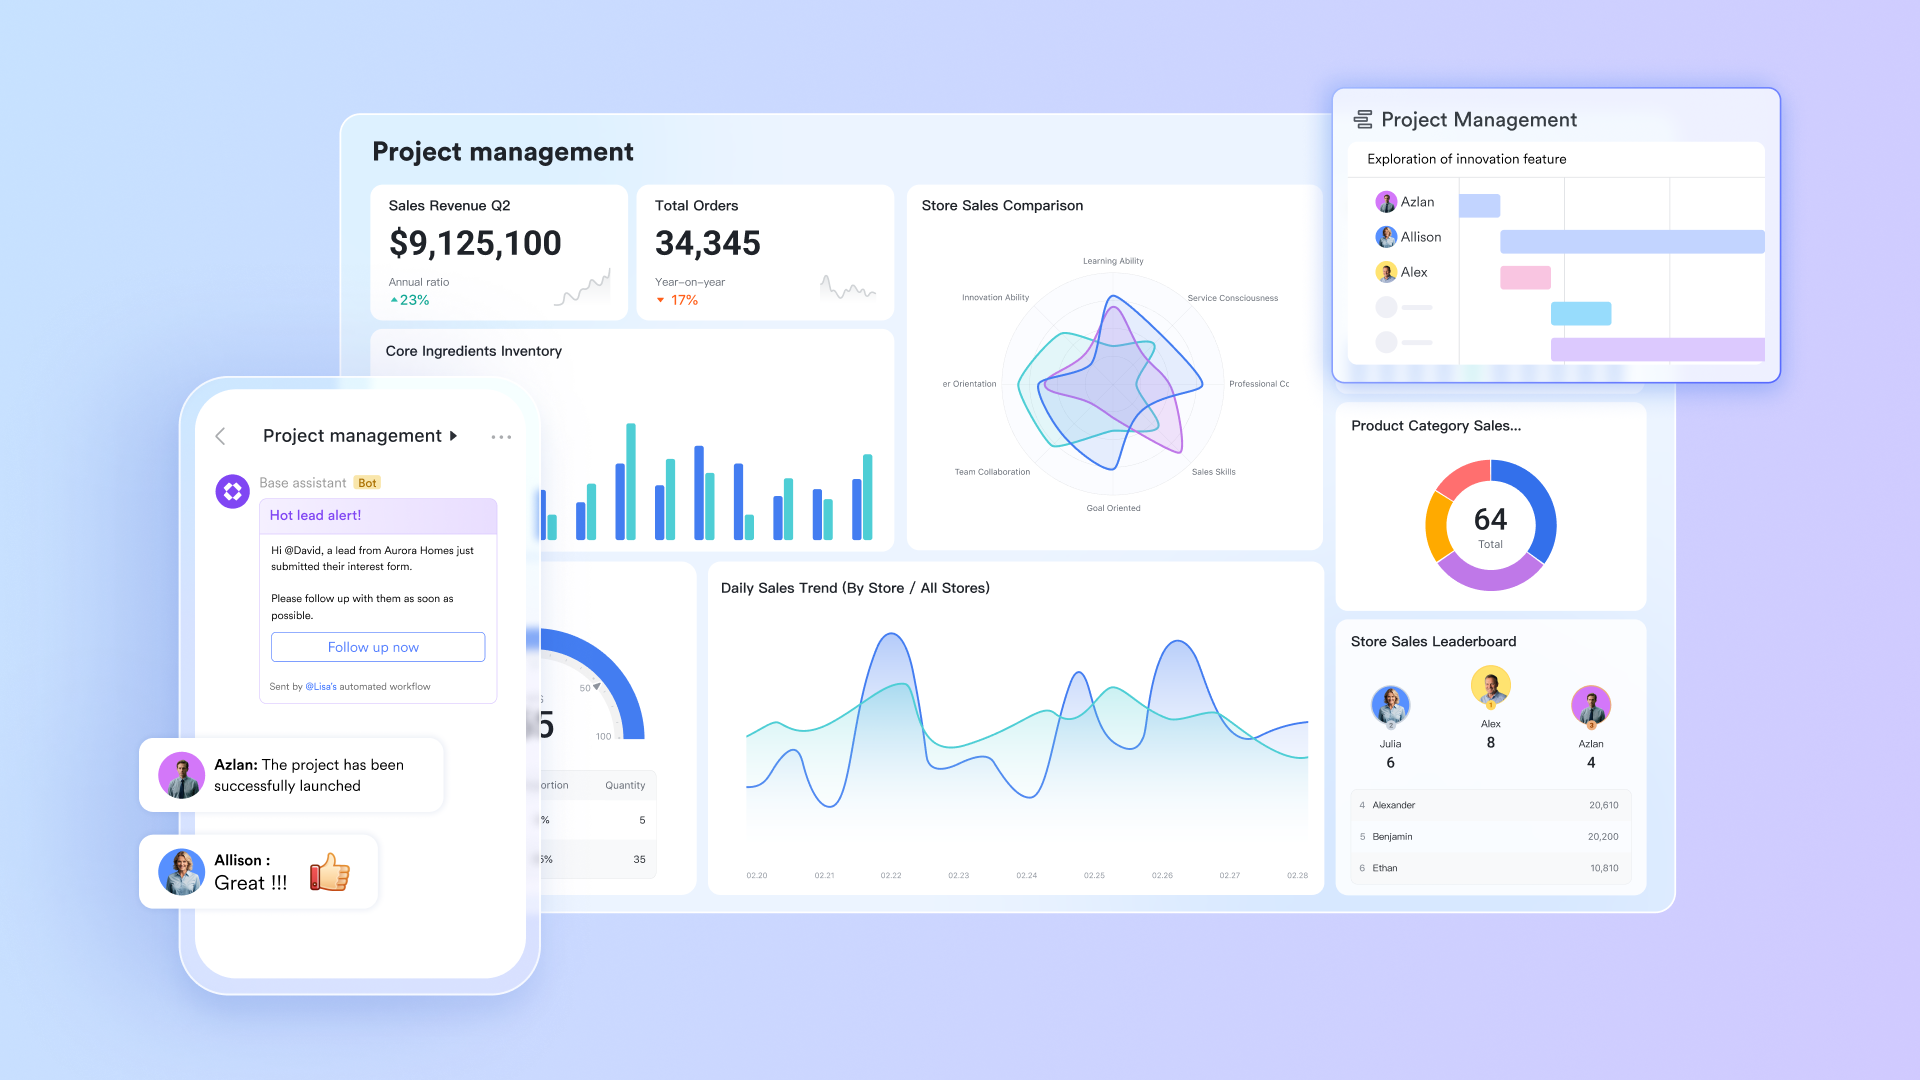
Lark Base for tracking and visualizing KPIs
Lark Base makes KPI tracking simple by giving teams structured tables for goals, metrics, owners, and deadlines. Automated reminders ensure updates are submitted on time, while smart calculations and filters surface trends or gaps instantly. With multiple views, users can organize data by status in kanban view, monitor progress in Gantt charts, and check tasks by objectives for alignment. With everything linked in one place, teams get real-time visibility without manual reporting.
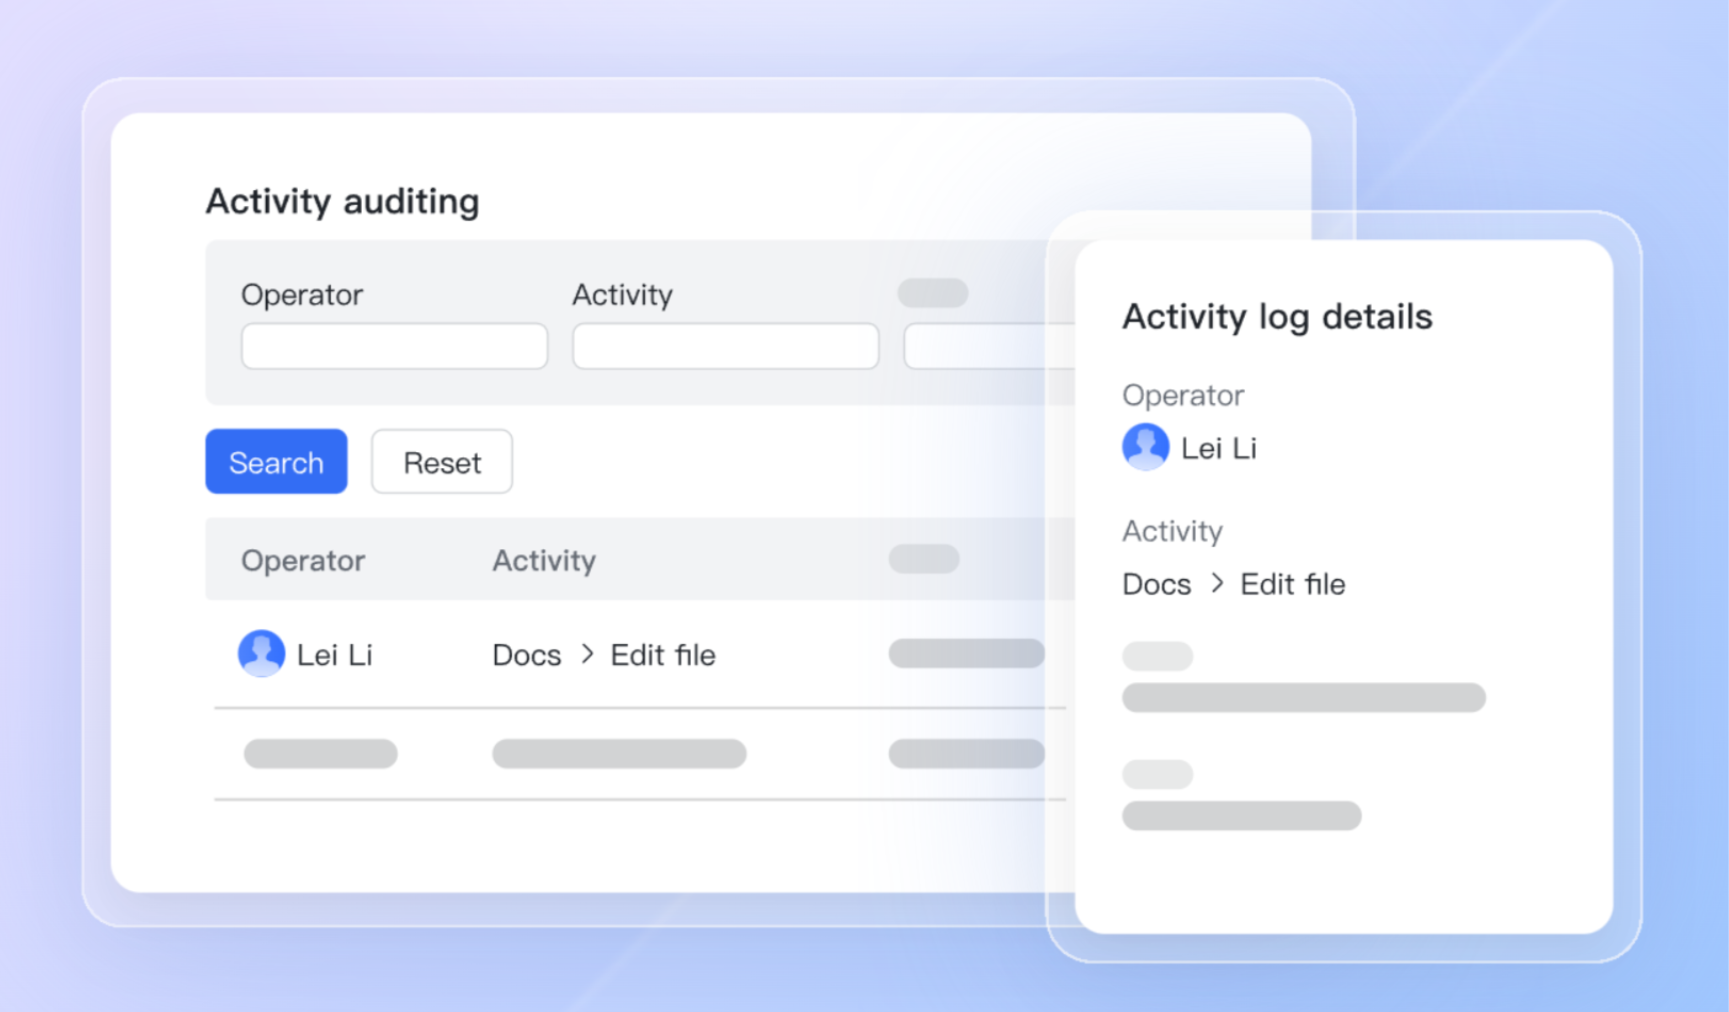
Audit logs for KPI transparency and compliance
Lark's audit logs record key actions taken within the workspace, offering a clear historical trail for KPI-related updates, changes, and decisions. These logs help teams verify when KPI targets were modified, who made adjustments, and how performance metrics evolved over time. This level of traceability supports compliance requirements in industries where accountability is critical, such as construction, finance, or operations. Audit logs also help managers identify inconsistencies or errors in KPI reporting, ensuring data remains accurate and trustworthy. During performance reviews or project retrospectives, teams can reference the audit history to understand the context behind major KPI outcomes.
- Starter plan: Free forever plan that includes 11 powerful tools for up to 20 users. It also comes with 100GB of storage, 1000 automation runs, AI translations, and more.
- Pro plan: $12/user/month (billed annually) for up to 500 users. It includes everything in Starter plus group calling for up to 500 attendees, 15TB of storage, 50,000 automation runs, and more.
- Enterprise plan: Contact sales for custom pricing. Supports unlimited users and includes even more automation runs and advanced security, compliance, and management features.
Bonus help: Ready-to-use KPI templates
KPI evaluation & management template
Kickstart your KPI tracking with a structured, ready-to-use evaluation system. This template helps teams define measurable goals, set performance benchmarks, and monitor progress efficiently. It's ideal for aligning project objectives with measurable outcomes across all departments. Whether managing short-term tasks or long-term initiatives, it keeps every KPI visible and actionable.
KPI performance review system
Evaluate your project and team KPIs with a comprehensive review framework. This template makes it easy to record progress, assess outcomes, and provide constructive feedback. It includes rating scales, analysis sections, and performance summaries for each KPI. Perfect for quarterly reviews or performance audits that drive accountability and improvement.
Financial KPI tracking template
Track your financial performance with precision and clarity. This template captures essential cost KPIs, from budget utilization to ROI and profitability trends. It enables teams to identify spending patterns, optimize resource allocation, and maintain financial discipline. Ideal for project managers, finance leads, or executives overseeing multiple budgets.
Cybersecurity KPI dashboard for IT managers
Gain full visibility into your organization's cybersecurity performance. This dashboard template tracks risk KPIs, threat response times, and compliance metrics in one place. It's designed for IT and operations teams that need real-time insight into security health. Use it to strengthen reporting, minimize risks, and ensure regulatory compliance.
360° performance review template
Get a complete, balanced view of individual and team performance. This stakeholder and team KPI template enables structured feedback from managers, peers, and self-assessments. It encourages transparency, professional growth, and cross-team collaboration. Use it to evaluate both qualitative and quantitative KPIs in a single, unified framework.
Why KPIs matter in project management
In project management, KPIs serve as the foundation for tracking performance, improving collaboration, and ensuring goals stay on course. By using the right project management KPIs, teams gain visibility into progress, detect issues early, and make data-backed decisions that enhance overall project success.
- Aligning teams: Project management KPIs help align teams by defining clear, measurable goals that everyone understands. When each member tracks the same performance indicators, collaboration improves, and efforts stay focused on shared outcomes. This alignment keeps projects on schedule and objectives consistent across departments.
- Detecting risks: By analyzing real-time KPI data, project managers can spot early warning signs such as missed deadlines or cost overruns. These indicators help identify potential risks before they escalate, allowing for faster corrective action. Proactive monitoring reduces project uncertainty and improves delivery reliability.
- Improving planning: Tracking KPIs in project management provides valuable historical data for future planning. Teams can review patterns in cost variance, workload balance, and performance trends to optimize resources. This data-driven approach strengthens forecasting accuracy and helps refine future project timelines.
- Strengthening reporting: With project management metrics and dashboards, teams can communicate results clearly to stakeholders. KPI-based reporting turns complex data into visual insights, improving transparency and decision-making. Regular reporting also builds accountability and helps track progress toward strategic goals.
- Enhancing efficiency and profitability: Effective use of KPIs improves operational efficiency and project profitability. By identifying workflow bottlenecks, resource imbalances, or recurring issues, teams can streamline processes and reduce waste. Continuous KPI tracking ensures that performance improvements translate into measurable financial impact.
Common mistakes when tracking KPIs
Even with the best tools, many teams struggle to get meaningful insights from their project management KPIs. The problem often lies not in the metrics themselves, but in how they're chosen, tracked, or maintained. Avoiding these common pitfalls can make your KPI system far more effective and reliable.
- Tracking too many KPIs: When teams monitor too many indicators, focus gets diluted. It becomes harder to distinguish between what truly drives performance and what's just noise. Instead, prioritize a concise set of project management metrics that directly influence your goals.
- Using only lagging indicators: Lagging KPIs measure outcomes after they occur, like project completion rate or total cost variance. While important, they don't allow early intervention. Always combine them with leading KPIs (like task progress or risk exposure) to predict and prevent issues.
- Assigning KPIs without owners: Every KPI needs a clear owner responsible for tracking, updating, and acting on it. Without ownership, accountability fades, and performance metrics lose relevance. Defined responsibility ensures KPIs translate into measurable improvement.
- Ignoring workload balance: Focusing solely on project output while neglecting team capacity leads to burnout and inefficiency. Including workload and productivity KPIs helps managers maintain balanced resource allocation and sustainable performance.
- Not updating KPI definitions: As projects evolve, KPIs must adapt too. Outdated metrics can misrepresent success or mask emerging issues. Regularly review and refine KPI definitions to ensure alignment with current project objectives and organizational priorities.
Conclusion
Effective project management KPIs turn data into direction, helping teams measure success, detect risks early, and stay aligned with business goals. From tracking schedule performance and budget health to monitoring workload balance and client satisfaction, the right metrics keep projects on course. But KPIs only drive real impact when they're actively measured, reviewed, and refined in a connected workspace. That's where Lark makes the difference. With tools for OKRs, dashboards, reporting, and collaboration, Lark gives teams one powerful place to track KPIs in real time, improve performance visibility, and achieve consistent project success.
FAQs
How many KPIs should a project manager track?
A project manager should typically track 5 to 10 key KPIs that align closely with project goals. Tracking too many metrics can dilute focus and complicate decision-making. The best project management KPIs cover core areas like time, cost, quality, and risk, ensuring that performance measurement stays focused, actionable, and relevant throughout the project lifecycle.
What is the difference between KPIs and OKRs in project management?
KPIs measure performance against specific metrics, while OKRs (Objectives and Key Results) define broader goals and the measurable steps to achieve them. In project management, KPIs track progress and efficiency, whereas OKRs set direction and ambition. Together, they ensure projects remain both strategically aligned and operationally effective.
How often should project KPIs be reviewed?
Project management KPIs should be reviewed regularly, ideally weekly or biweekly, to track real-time progress and detect early warning signs. For long-term projects, monthly reviews work well for strategic evaluation. Frequent reviews help ensure teams stay aligned, make timely adjustments, and maintain visibility into changing risks or performance trends.
What tools are most useful for KPI dashboards?
Effective KPI dashboards use tools that combine data, communication, and visualization in one workspace. Platforms like Lark help teams manage tasks, budgets, and progress metrics in real time. Features such as live charts, workload trackers, and audit logs make KPI tracking transparent, actionable, and accessible for all stakeholders.
How can project teams ensure KPI data accuracy?
Teams can ensure accurate KPI data by using centralized systems, automating data collection, and maintaining clear ownership of each metric. Regular audits and version tracking prevent inconsistencies. Tools like Lark Base and Lark Sheets enhance reliability by updating KPI dashboards in real time, reducing manual entry errors, and ensuring data integrity.
Related reading
Table of contents
Start using Lark today

Manage all your work in one place
Boost team efficiency by 10x
Save up to 70% on software costs
Table of contents
Start using Lark today
Manage all your work in one place
Boost team efficiency by 10x
Save up to 70% on software costs
Keep reading







2026 Lark Technologies Pte. Ltd.
Headquartered in Singapore with offices worldwide.






Explore: