Modern sales teams rely heavily on structured reporting to track sales performance, forecast revenue, and guide decision-making. A sales report in Excel remains one of the most widely used methods for organizing and analyzing sales data across industries. Its flexibility, familiarity, and accessibility make Excel a practical choice for businesses of all sizes looking to monitor total revenue and average deal size.
However, as sales operations grow more complex, teams often struggle to maintain accuracy, consistency, and collaboration using spreadsheets alone. Understanding how to build, format, and maintain a sales report in Excel is essential before deciding whether to scale beyond spreadsheets. This guide explains formats, sales report templates, and examples while gradually exploring how teams evolve past Excel over time.
What is a sales report in Excel?
A is a structured spreadsheet used to record, summarize, and analyze sales activity over a defined period. It helps teams track revenue generated, sales performance trends, product movement, and progress toward targets using tabular sales data. Excel allows users to calculate totals, averages, and comparisons using built-in formulas, transforming raw data into clear insights about your sales strategy.
Most organizations use a sales report format in Excel because it is easy to customize. Columns, formulas, and charts can be adjusted based on business goals. Excel also supports historical comparisons, which makes it useful for and forecasting.
5 key elements of a compelling sales report in Excel
A clear sales report format in Excel ensures consistency, accuracy, and easy interpretation of sales data. These core elements help teams track performance, compare results, and communicate insights effectively.
- Sales period and region: The sales period and region define the scope of the report, such as daily, weekly, or monthly performance by location or territory. Clearly specifying timeframes prevents confusion and ensures fair comparisons across periods. Regional breakdowns help managers identify geographic trends and allocate resources effectively.
- Product or service details: Product or service details list what was sold, including item names, categories, or . This data helps teams understand which offerings contribute most to revenue and volume. Product-level visibility supports pricing strategies, inventory planning, and promotional decisions.
- Revenue and quantity sold: Revenue reflects financial performance like total revenue, while quantity sold shows units sold and demand. Tracking both together provides a balanced view of sales health and efficiency. High revenue with low volume may indicate premium pricing, while high volume with low revenue highlights margin considerations.
- Targets vs actual sales: Targets versus actuals compare planned goals with achieved results. This comparison highlights overperformance, underperformance, and trend shifts clearly. Managers use this data to guide coaching, incentives, and strategy adjustments.
- Notes and observations: Notes and observations add qualitative context to numerical data. Teams use this section to explain anomalies, market conditions, or campaign impacts. Context improves interpretation and reduces misinformed conclusions.
How to create a sales report in Excel
Creating a sales report in Excel involves structuring data carefully and applying consistent formatting. Following a step-by-step process reduces errors and improves report usability.
Step 1: Setting up the worksheet
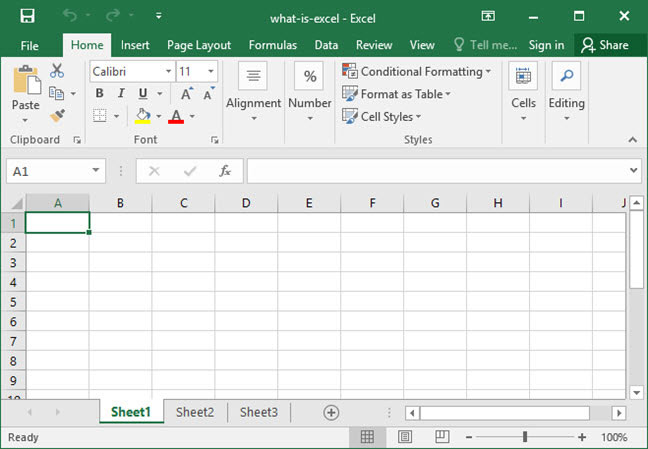
Start by naming the worksheet clearly and displaying the at the top. A well-organized template typically has core sheets: Raw Data, KPIs, and a Monthly Summary. Use frozen header rows so column labels remain visible while scrolling. A clean worksheet layout improves navigation and reduces confusion. This setup also supports easier sharing and review.
Step 2: Defining columns and data types
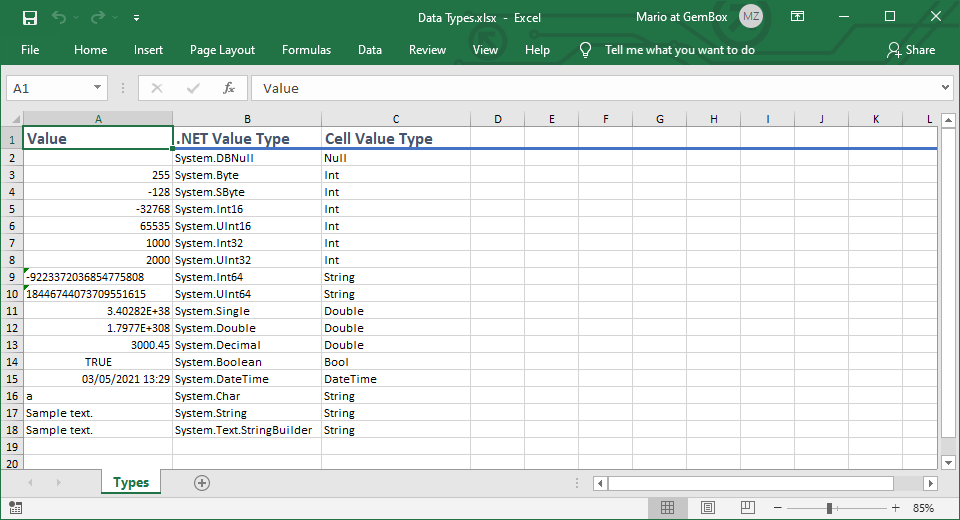
Define columns for dates, products, regions, revenue, and quantities. Assign correct data types, such as currency, numbers, or dates, to ensure formulas work correctly. Proper data typing prevents calculation errors and formatting issues. Organizing sales data into a single table with consistent column headers is important for accurate analysis and PivotTable creation.
Step 3: Applying formulas and basic calculations
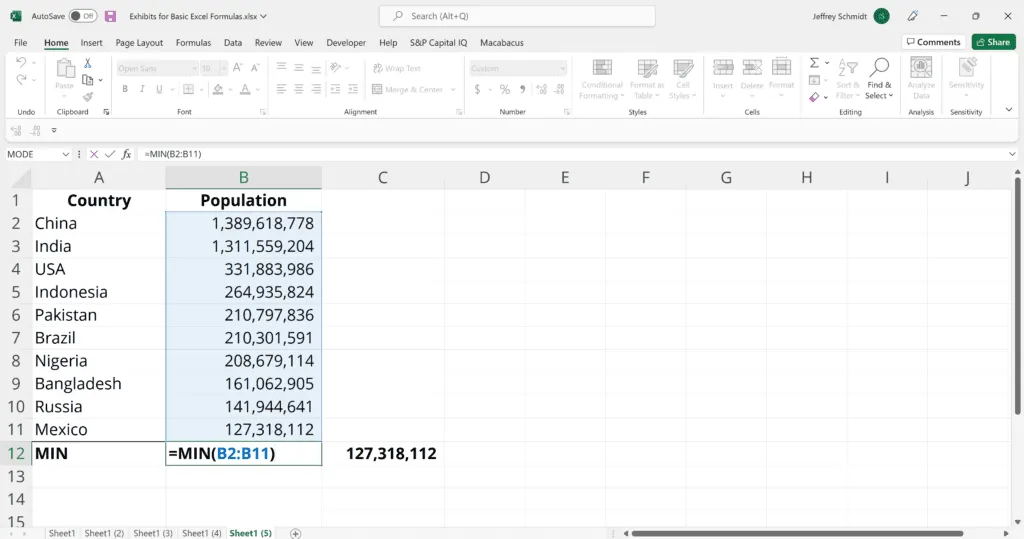
Use formulas to automate calculations and reduce manual errors. Common formulas include totals, averages, growth rates, and percentage contributions. For example, using SUMIFS to calculate total sales or COUNTIFS for closed deals ensures consistency across rows.
Step 4: Analyzing data with filters and pivot tables
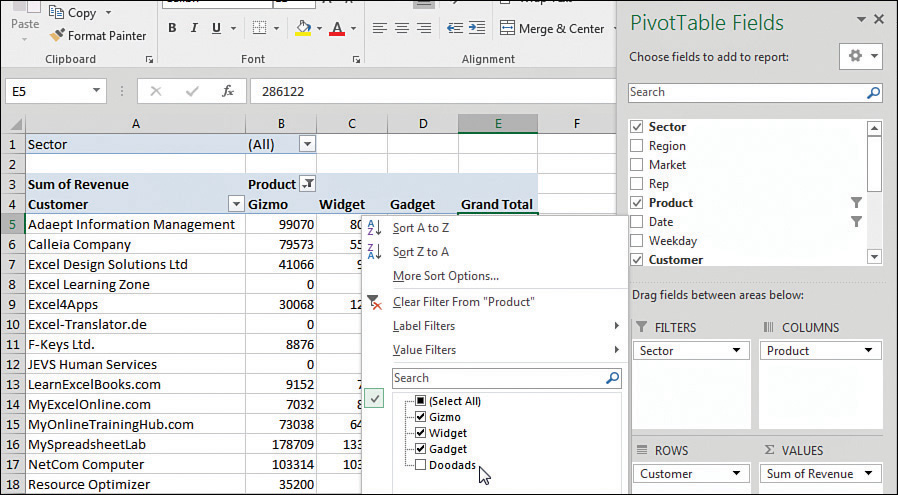
Filters allow users to focus on specific products, regions, or time periods without altering the underlying data. Pivot tables allow you to slice and dice large datasets effectively, taking analysis further by summarizing large datasets into meaningful views, such as sales by region or performance by product category.
Step 5: Formatting for readability
Apply consistent formatting with bold headers, alignment, and conditional formatting to highlight important values automatically. Use colors sparingly to draw attention to key metrics without cluttering the report. Well-formatted reports are easier to read and interpret. This improves adoption across teams.
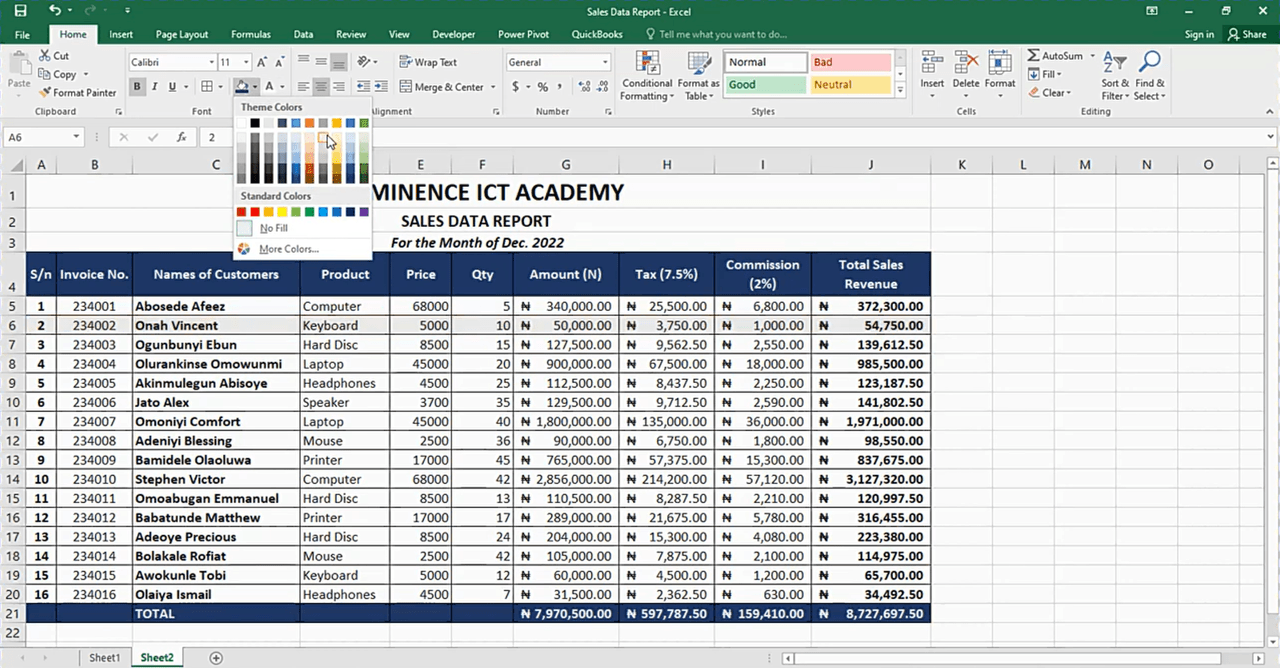
Step 6: Reviewing and sharing the report
Before sharing the sales report, review it for accuracy, consistency, and clarity. Check formulas, verify totals, and ensure formatting remains consistent throughout. Avoid common mistakes like hard-coding dates in formulas or mixing raw data and summaries on the same sheet. Add brief notes or a summary section to explain key insights or unusual trends.
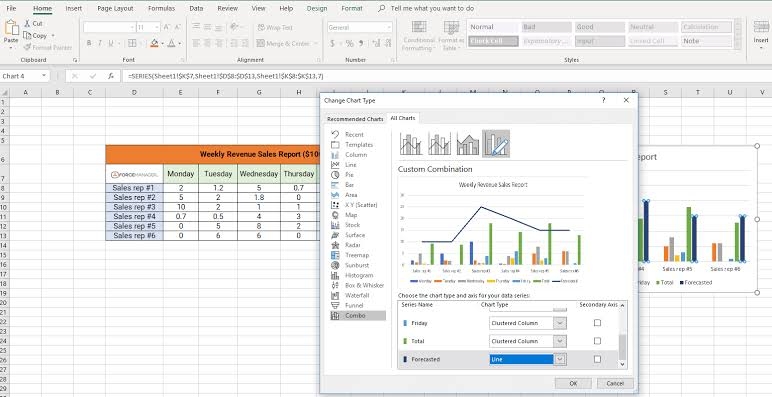
4 common sales report templates in Excel
Excel offers several ready-made sales report templates that help performance consistently and reduce manual reporting effort.
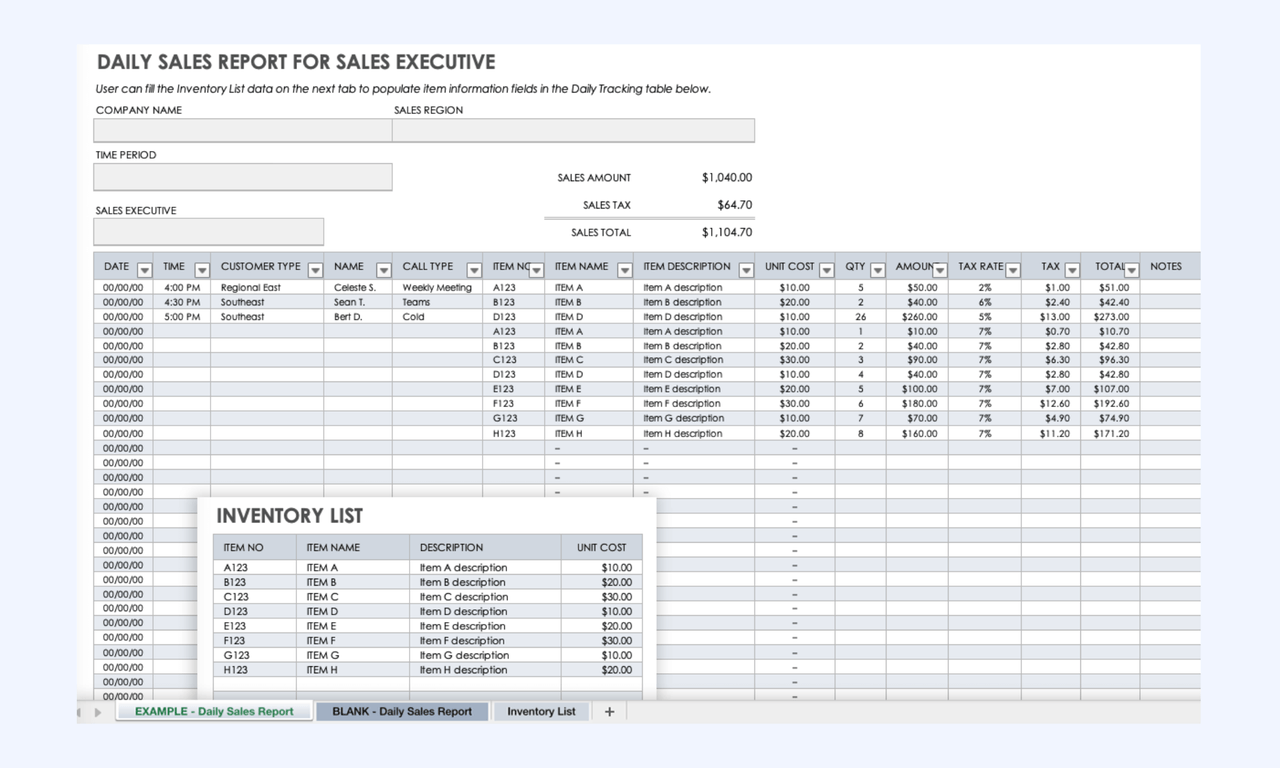
Daily sales report template
This template helps teams record and review on a daily basis by providing a clear snapshot of revenue and transactions for immediate monitoring and decision-making. A daily sales report template fits retail or high-volume businesses that need to track units sold and revenue generated each day. It offers a low-effort setup to track high-frequency sales activity.
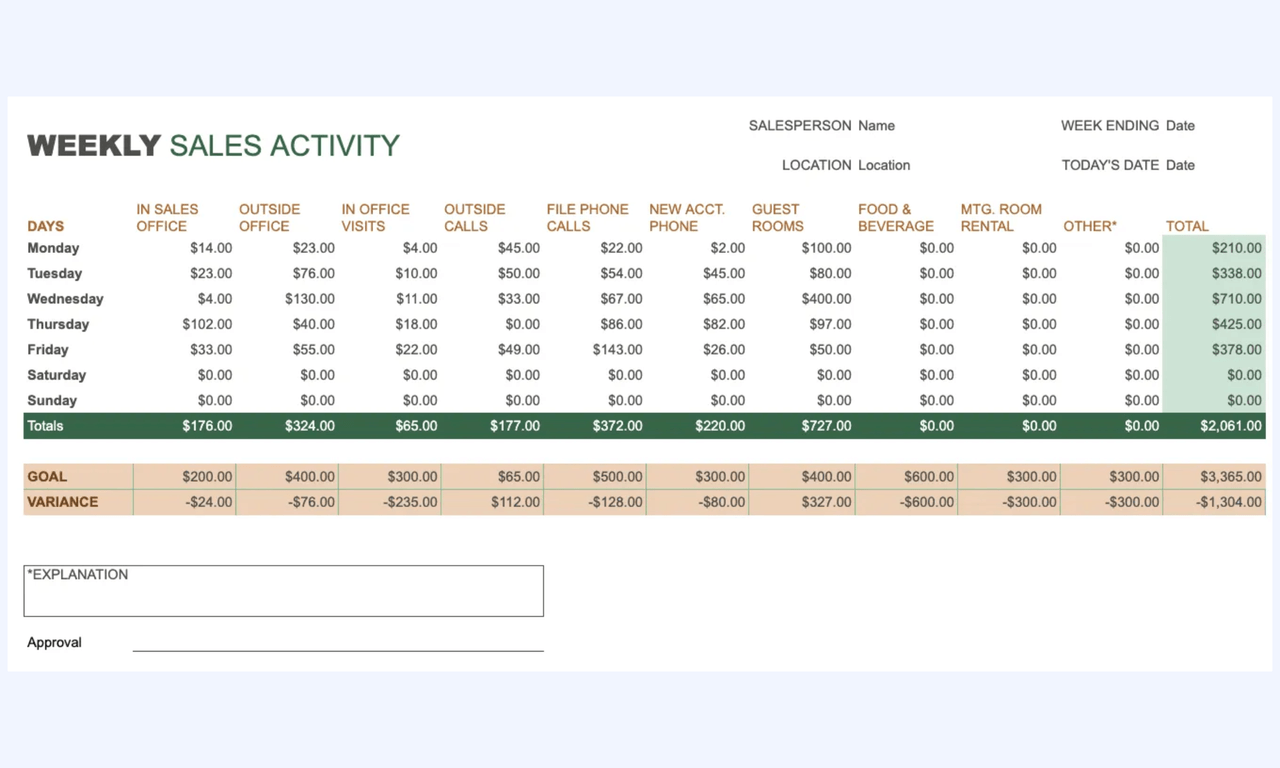
Weekly sales report template
This template summarizes weekly sales performance to facilitate clearer trend analysis, helping teams compare daily results and identify emerging short-term patterns. A weekly sales report template suits B2B sales teams reviewing pipeline movement and deals closed. By highlighting momentum shifts and specific product drivers, it serves as a practical way for sales managers to conduct data-backed weekly reviews and check-ins.
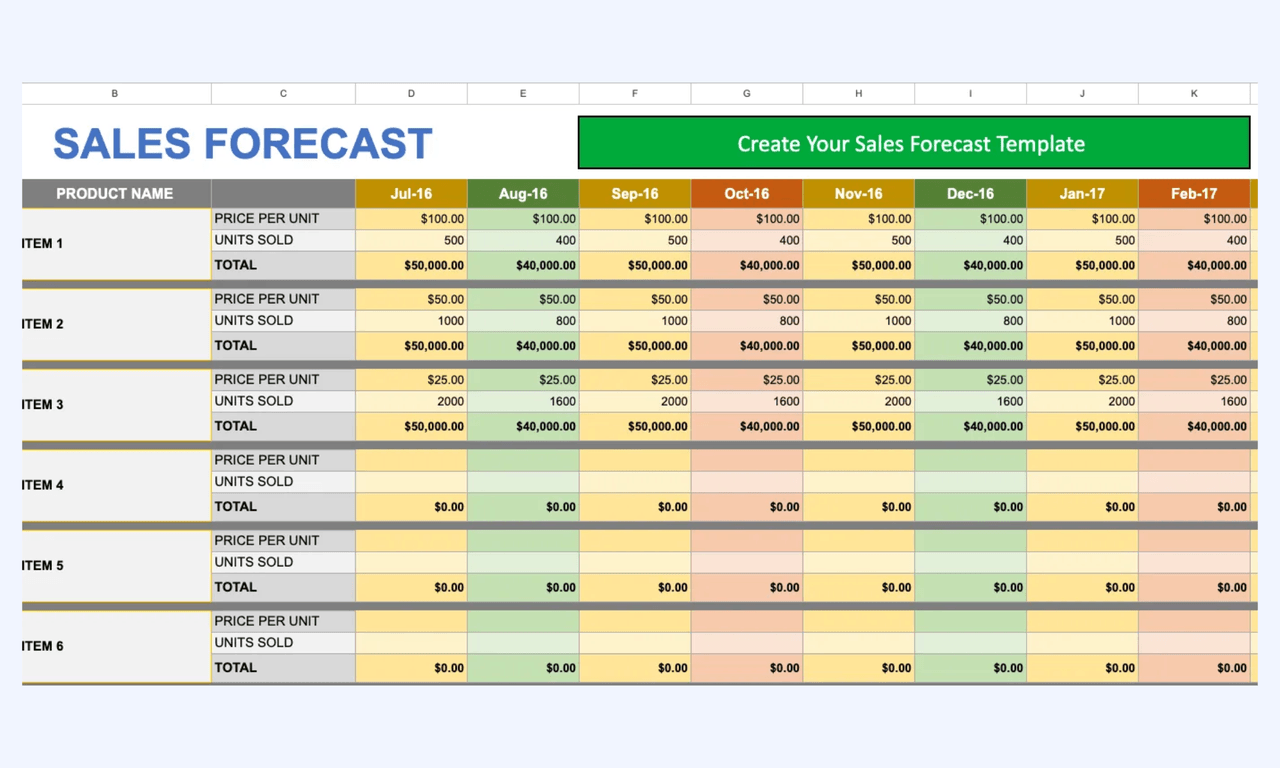
Sales forecast report template
This template projects future sales by aggregating historical data, revenue targets, and growth metrics to support strategic planning, budgeting, and goal setting. Primarily used by managers for stakeholder updates, it provides a forward-looking view of performance that helps align teams around expected results.
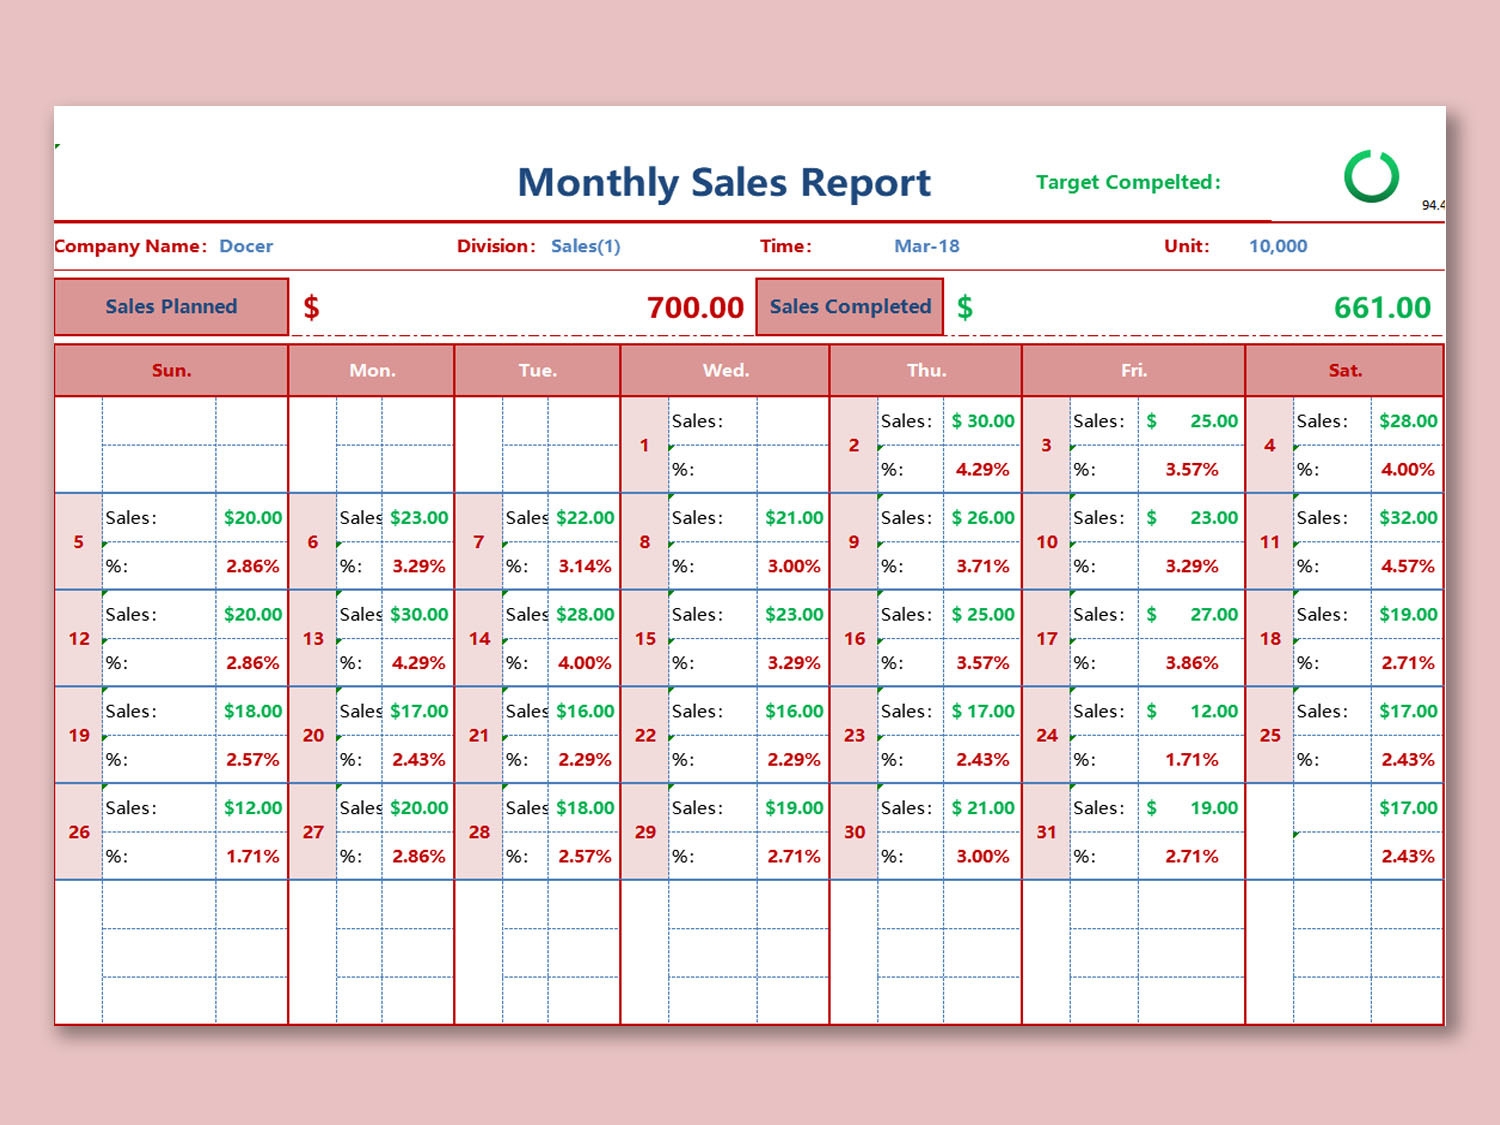
Monthly sales report template
This template consolidates extensive sales datasets into high-level summarized views, utilizing pivot tables to enable instant analysis by product, region, or time period. Designed for advanced reporting and executive reviews, it allows users to slice and filter complex data without manual calculations.
When teams outgrow Excel sales reporting
Excel works well for basic , but its limitations become more apparent as sales operations grow in size and complexity. As more data, users, and reporting requirements are added, spreadsheets become harder to manage consistently. Teams begin to experience delays, errors, and visibility gaps that impact decision-making.
- Increasing data volume: As sales data accumulates across products, regions, and time periods, Excel files grow large and slow. Heavier spreadsheets increase the likelihood of broken formulas, duplicate entries, and accidental overwrites. Managing and validating large datasets also takes more time, reducing reporting efficiency.
- Need for real-time collaboration: Sales reporting often requires input from multiple teams, such as sales, finance, and operations. Excel struggles to support real-time collaboration at scale, often leading to version chaos when multiple sales reps update files. Excel struggles to support real-time collaboration at scale, leading to locked files and outdated versions being shared. This creates misalignment and slows down the reporting .
- Automation and accuracy requirements: Manual calculations, copy-paste workflows, and static formulas increase the risk of human error. Manual copy-paste refreshes are time-consuming and prone to duplication. As metrics become more complex, maintaining accuracy in Excel becomes difficult. Teams eventually need automated reporting systems that update data reliably without constant manual intervention.
See how Lark streamlines sales reports workflows
Beyond spreadsheets: Try Lark to create sales reports with live data
As sales operations grow, teams need more than static spreadsheets to track sales performance accurately. Modern sales reporting requires real-time visibility, automation, and . helps teams move beyond Excel by turning sales data into connected, always-updated reports where work actually happens.
Many organizations have already made the leap from static spreadsheets to a unified platform, experiencing immediate improvements in their sales workflows and team transparency. By consolidating their tools, they can focus more on driving revenue rather than formatting cells. Here is how one of our customers transformed their sales operations using Lark:

"Lark has changed how we uplevel sales and customer success. The month I shared our sales boards in Lark Base with our teams, I saw a real lift in digital advertising sales. These boards are where our race to the top can happen, and we finally have the transparency to do so efficiently."

Mona Abisourour
Chief Growth Officer
As demonstrated above, moving your sales data into a collaborative ecosystem like Lark Base not only saves time but directly impacts your bottom line. Let's dive deeper into the specific features that make this transformation possible:
Relational data tables for account mapping
Lark Base uses tables to create a relational database structure for complex sales cycles. By using the two-ways link field function, you can connect a single record in the "Accounts" table to multiple records in the "Opportunities" or "Contacts" tables. This ensures that all sales intelligence is centralized, allowing any team member to see the full history of an account without duplicating data. 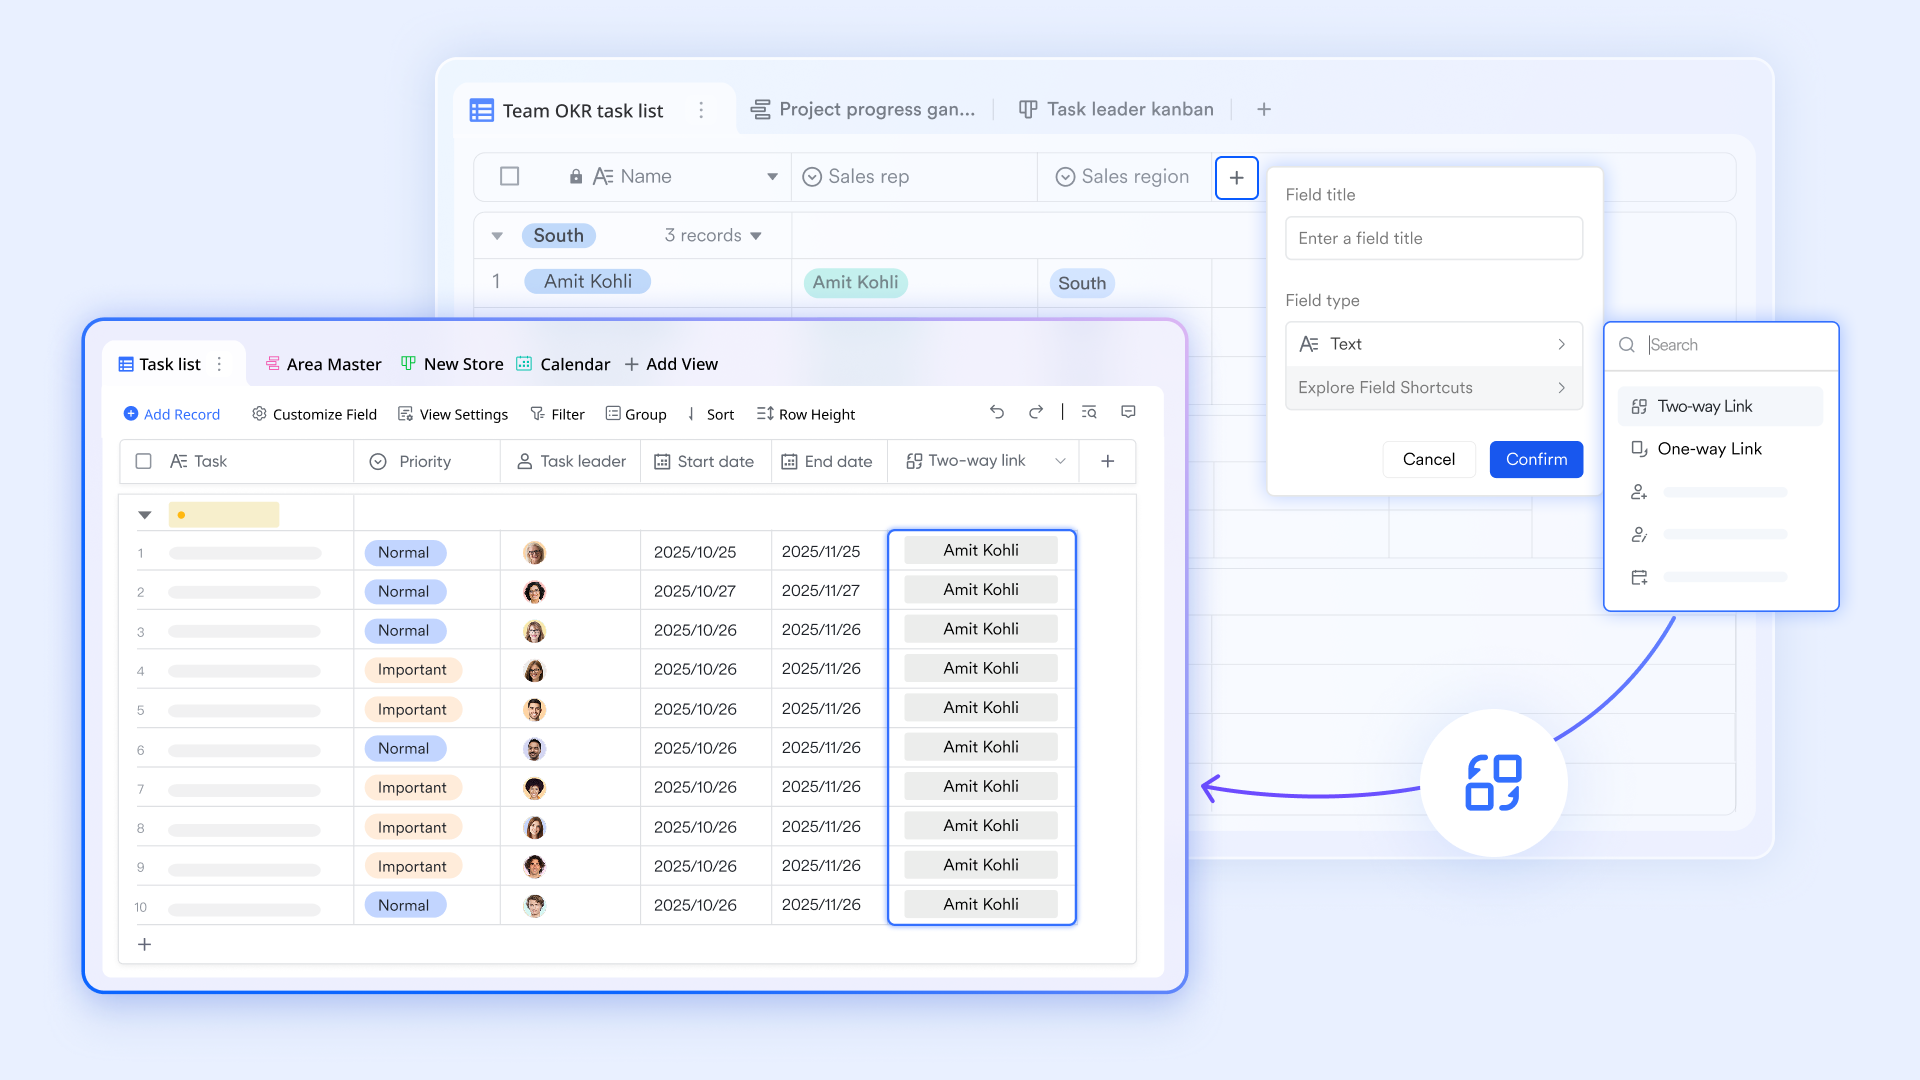
AI-driven sales data reprocessing
While reprocessing sales data is often a major headache, Lark AI field shortcuts provide a toolkit to avoid the manual grind. Its "Categorization" and "Smart Extraction "functions automate lead prioritization and pull key deal values directly from raw notes into your report. Meanwhile, the "Summary" and "Smart Tags" features condense lengthy account histories into digestible snapshots, saving your valuable time for deep analysis of your sales performance. 
Multiple pipeline views (Kanban & Gantt)
Sales data in Lark isn't restricted to a single grid. The views function allows teams to toggle between a Kanban view for tracking deal stages and a gallery view for a visual lead deck. This flexibility ensures that reps can manage their day-to-day tasks in a board format while managers can switch to a table view for deep-dive data cleaning and sorting. 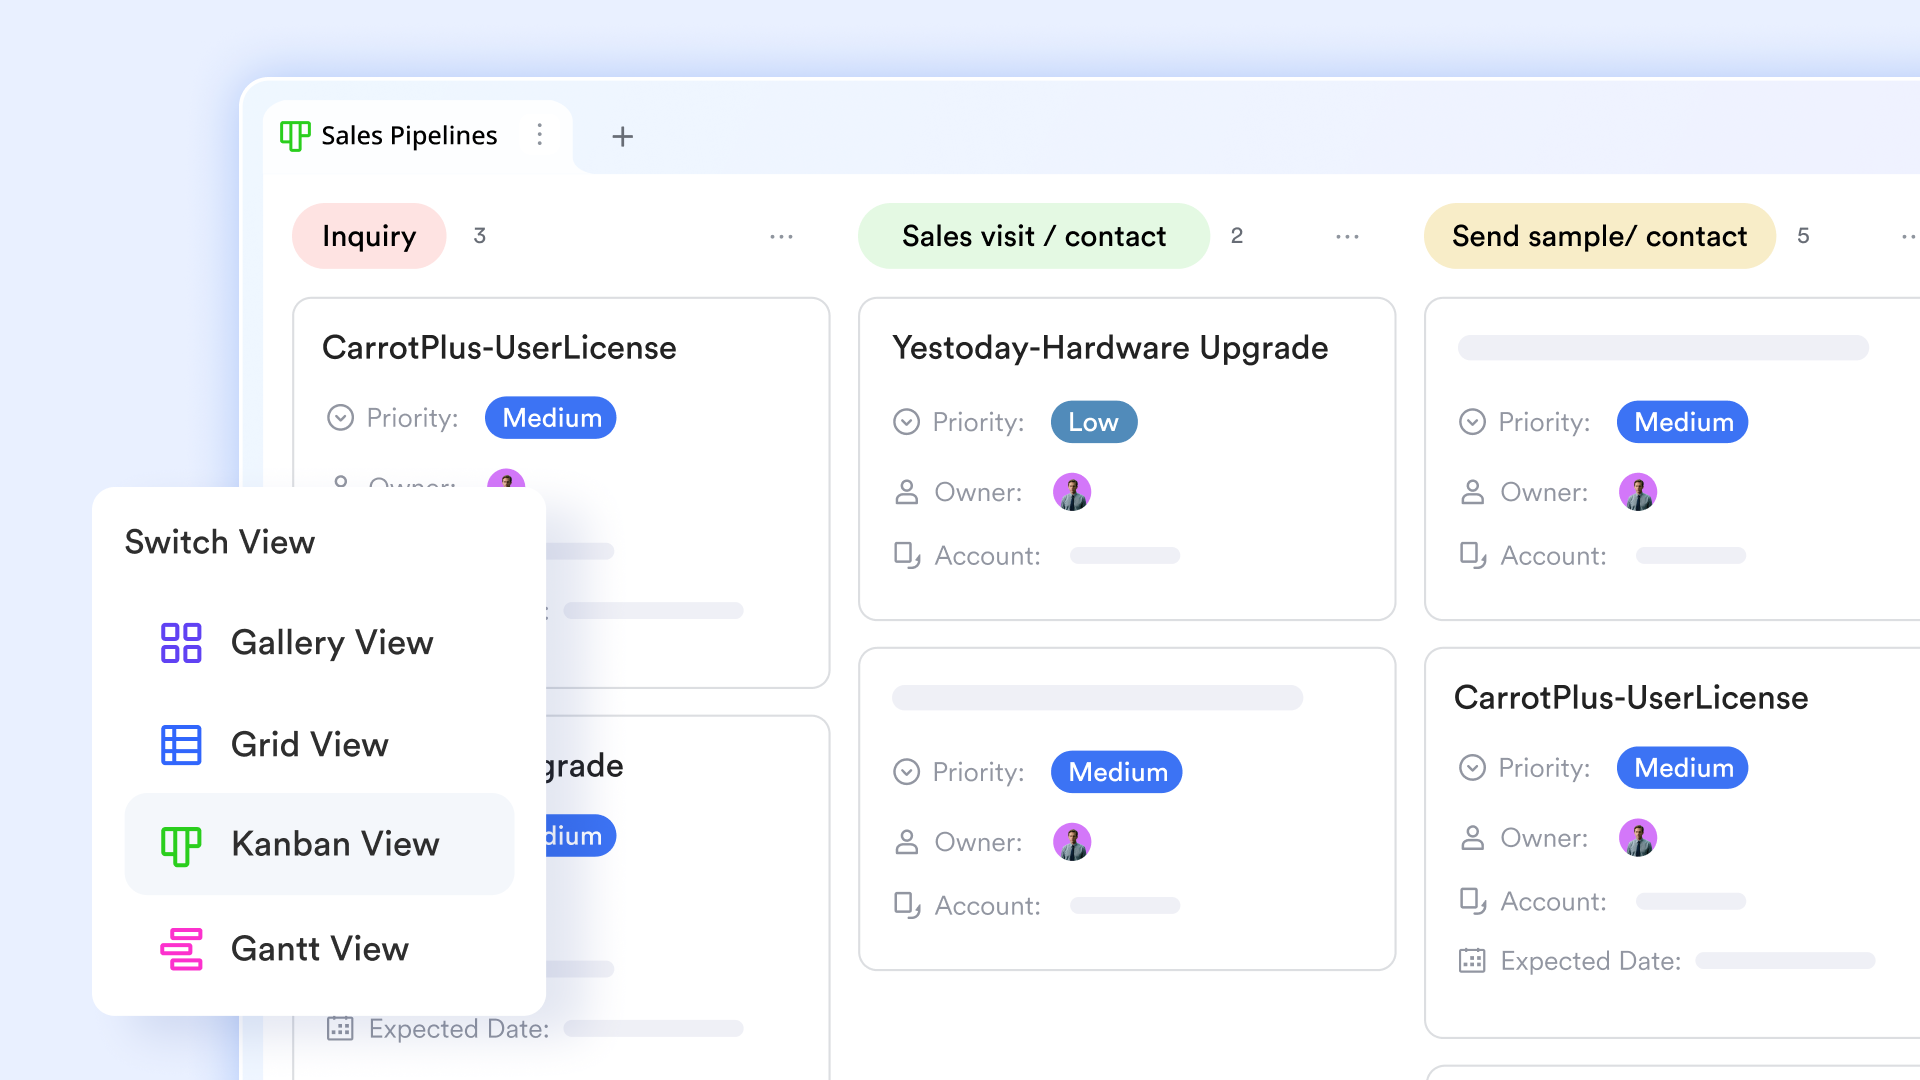
Sales performance dashboards
The dashboard function in Lark Base provides a real-time command center for sales leadership. With blocks like and ranking blocks, managers can visualize team metrics, deal progress, and revenue forecasts. To streamline the review process, the "smart analysis" and "dashboard summary" features leverage AI to automatically analyze data trends and generate concise snapshots. 
Automated deal signals
Lark eliminates manual pipeline monitoring through base automations. By setting a trigger for "When a record matches certain conditions" (such as a high-value deal remaining in the same stage for too long), the system automatically executes a "Send a message" action to the owner. These proactive "deal signals" ensure that momentum is maintained and no opportunity is forgotten. 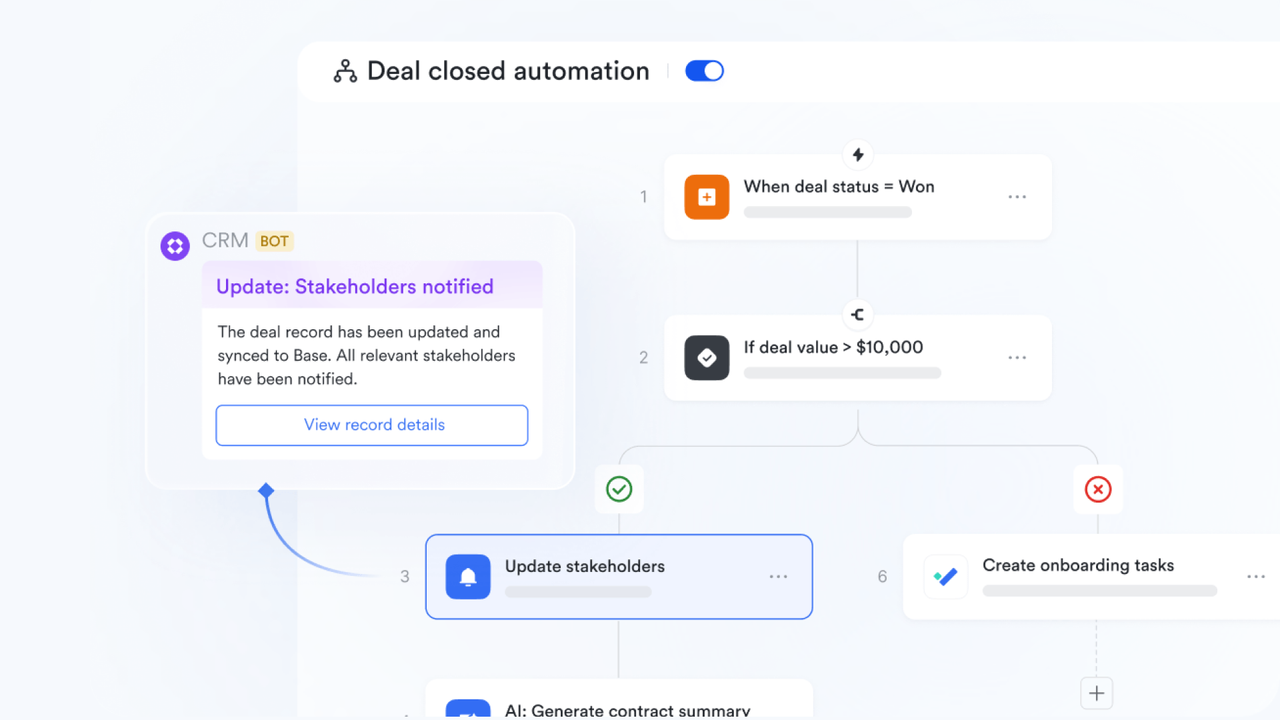
:
- Starter plan: Free forever plan that includes 11 powerful tools for up to 20 users. It also comes with 100GB of storage, 1000 automation runs, AI translations, and more.
- Pro plan: $12/user/month (billed annually) for up to 500 users. It includes everything in Starter plus group calling for up to 500 attendees, 15TB of storage, 50,000 automation runs, and more.
- Enterprise plan: for custom pricing. Supports unlimited users and includes even more automation runs and advanced security, compliance, and management features.
For small teams with simple communication needs

18 months message history
1000 Base automation runs/month
2000 rows per table in Base
Most POPULAR
For companies with comprehensive collaboration and management needs
Unlimited message history
500-participant video meetings
50k Base automation runs/month
20k rows per table in Base
For large companies with advanced security and organizational management needs
Get a personalized demo and pricing
Unlimited message history
500-participant video meetings
15 TB storage + 30 GB storage/user
500k Base automation runs/month
50k Base automation runs/month
Most POPULAR
For companies with comprehensive collaboration and management needs
Unlimited message history
500-participant video meetings
50k Base automation runs/month
20k rows per table in Base
Ready-to-use sales report templates
These ready-made sales report templates help teams move faster from setup to insights. Each template is designed for a specific sales reporting need, making it easy to track sales performance, forecasts, and without building reports from scratch.
Daily sales forecast report
This template helps sales teams estimate near-term revenue by tracking open opportunities, expected close dates, and deal probability. It gives managers a forward-looking view of rather than just past performance. Because forecasts update as deal stages change, teams can react quickly to risks or upside. It is especially useful for weekly planning, revenue calls, and short-term goal adjustments.
Daily sales amount summary
This template provides a high-level snapshot of total revenue daily. It removes unnecessary detail to keep the focus on overall performance. Managers use it to monitor revenue flow and spot sudden changes quickly. It works well as a quick-reference report for leadership check-ins.
Daily sales report
This template captures daily sales activity, revenue totals, and deal updates in one centralized view. It gives teams immediate visibility into execution performance without waiting for weekly summaries. Daily tracking helps spot issues early, such as stalled deals or missed follow-ups. It is ideal for fast-paced sales environments that require constant monitoring.
Sales tracker: lead analysis and follow-up
Built to improve conversion rates, this template helps teams evaluate lead quality and track follow-up activity. It highlights which prospects need immediate attention and which may require nurturing. Clear follow-up tracking reduces the risk of missed opportunities. Sales managers use it to improve response speed and engagement consistency.
Sales daily report
Focused on operational execution, this template tracks daily progress, follow-ups, and next actions for each deal. It helps managers maintain accountability across the sales team. Reps stay aligned on priorities by clearly seeing what needs attention each day. This format works well for stand-ups, daily check-ins, and activity reviews.
Monthly sales report for analysts
Designed for deeper analysis, this template summarizes monthly revenue, performance trends, and variance against targets. It helps analysts identify patterns, seasonal shifts, and underperforming segments. By consolidating data into a structured format, it supports accurate comparisons across time periods. Leadership teams often rely on this report for strategic reviews and planning discussions.
Best practices for using Excel sales templates
Using Excel effectively requires consistency, accuracy, and disciplined data management. Following best practices helps teams avoid errors, improve reporting clarity, and maintain reliable sales records over time.
- Standardizing formats: Ensures that every sales report in Excel follows the same structure, column order, and naming conventions. This makes reports easier to read, compare, and consolidate across teams or time periods. Consistency also reduces confusion when reports are shared with stakeholders.
- Maintaining data accuracy: Accurate data entry is critical for trustworthy sales analysis and forecasting. Teams should use data validation, controlled inputs, and regular checks to prevent errors or duplicates. Clean data ensures that insights drawn from sales report formats in Excel reflect real performance.
- Archiving older reports: Archiving older sales reports keeps active worksheets clean and improves Excel performance. Historical reports should be stored in organized folders with clear naming for future reference. Proper archiving supports audits, trend analysis, and long-term sales planning without cluttering current files.
Conclusion
Excel remains a practical and accessible tool for creating structured sales reports, especially for teams that need flexibility and familiar workflows. With the right sales report format in Excel, teams can track sales performance, compare targets versus actual sales, and maintain clear visibility into daily, weekly, or monthly results. Applying consistent sales report templates and best practices helps ensure that Excel sales reports remain accurate, readable, and useful for decision-making.
However, as sales operations grow more complex, many teams begin to outgrow manual spreadsheet-based reporting. Increasing data volume, collaboration needs, and automation requirements often demand more advanced solutions. At this stage, platforms like provide a natural next step by extending Excel-style reporting into a collaborative, real-time environment that supports dashboards, automation, and scalable without sacrificing structure or control.
Build scalable sales reports as teams grow
FAQs
How do I write a sales report?
To write a sales report, start by defining the reporting period and objectives, then collect accurate sales data such as total revenue, units sold, and performance by product or region. Organize this data in a clear sales report format in Excel using tables, summaries, and charts. As reporting needs grow, teams often move these structured reports into collaborative platforms like Lark to streamline updates and sharing.
What are the most important metrics to include in a sales report?
Key metrics typically include total revenue, units sold, targets versus actual sales, growth rate, and performance by product, region, or salesperson. These metrics help teams understand trends and identify gaps quickly. Many teams later connect these metrics to live dashboards in tools such as Lark to gain real-time visibility without manual recalculation.
Which Excel formulas are commonly used in sales reports?
Common Excel formulas include SUM for total sales, AVERAGE for performance analysis, IF for target comparisons, and VLOOKUP or XLOOKUP for pulling related data. Pivot tables are also widely used to summarize large datasets. When formulas become complex or error-prone, platforms like Lark help automate calculations while preserving spreadsheet-style logic.
How often should a sales report in Excel be updated?
The update frequency depends on business needs, ranging from daily updates for retail teams to weekly or monthly sales updates for management reporting. Regular updates ensure decisions are based on current data. As update frequency increases, many teams adopt systems like Lark to reduce manual effort and keep reports continuously up to date.
Related reading