Modern teams don't struggle because they lack tools—they struggle because their processes aren't always clear or easy to follow. That's why flow chart examples have become a practical way to turn everyday complexity into something people can actually see, understand, and act on.
Flow charts transform abstract ideas into clear visual roadmaps. They show how tasks move from start to finish, who owns each step, and where decisions change the path forward. Whether you're mapping a simple onboarding process, designing a website structure, or managing a multi-phase project, the right flow chart can replace confusion with confidence.
In this guide, you'll explore practical examples across business, technology, and team collaboration—and learn how to turn static diagrams into real, automated workflows using tools like Lark.
What is a flow chart?
A flow chart is a visual diagram that shows how a process, system, or decision moves from a starting point to an outcome through a series of connected steps. It uses standardized symbols—such as ovals for start and end points, rectangles for actions, diamonds for decisions, and arrows to indicate direction—to make complex ideas easier to understand at a glance.
Teams use flow charts to clarify responsibilities, identify bottlenecks, and improve consistency across tasks. For beginners, flowchart examples often include simple activities such as approving a request or onboarding a new employee. In more , process flow chart examples map out manufacturing stages, service delivery, or compliance procedures. Meanwhile, workflow chart examples focus on how work moves between people, departments, or systems, highlighting handoffs and approvals.
By turning written procedures into visual paths, flow charts help , reduce errors, and make better, faster decisions.
Build process visuals that keep teams aligned
5 key characteristics of a flowchart
A well-designed flowchart makes complex ideas easier to follow, share, and improve. These five key characteristics help ensure your diagrams stay clear, practical, and effective for any team or project.
- Clarity and simplicity: A good flowchart presents steps in a clean, logical sequence that anyone can understand at a glance. This is especially important when creating flowchart examples for training, onboarding, or .
- Logical decision points: Each choice should clearly branch into defined outcomes, avoiding vague or overlapping paths. Strong decision flow chart examples show how every "yes" or "no" leads to a meaningful next step.
- Consistency in symbols and layout: Using the same shapes, colors, and direction throughout improves readability and professionalism. This consistency is crucial in PowerPoint flowchart examples, where visual polish affects presentations and stakeholder buy-in.
- Process-focused structure: Every step should reflect a real action, owner, or system input to keep the chart grounded in reality. Well-designed flowchart examples help teams identify gaps, delays, and .
- User-oriented navigation: The flow should mirror how people actually navigate information or tasks. This principle is essential in website flowchart examples, where intuitive paths improve the user experience and conversion rates.
18 types of flow charts
Flowcharts come in many forms, each designed to solve a specific type of problem or to represent a particular way work moves through a system. From simple step-by-step diagrams to complex, role-based, data-driven models, the right flowchart can make even the most complex processes easier to understand. Below are 15+ common types of flow charts you can use across business, technology, and team collaboration.
1. Simple decision flow chart example
A simple decision flowchart example illustrates how a single choice can change the course of a process. For example, an expense approval flow may start with submitting a request, followed by a decision point that asks whether the amount exceeds a set limit. If the answer is "yes," the request moves to a manager for review; if "no," it is . This clear branching helps teams maintain consistency and fairness in everyday decisions.
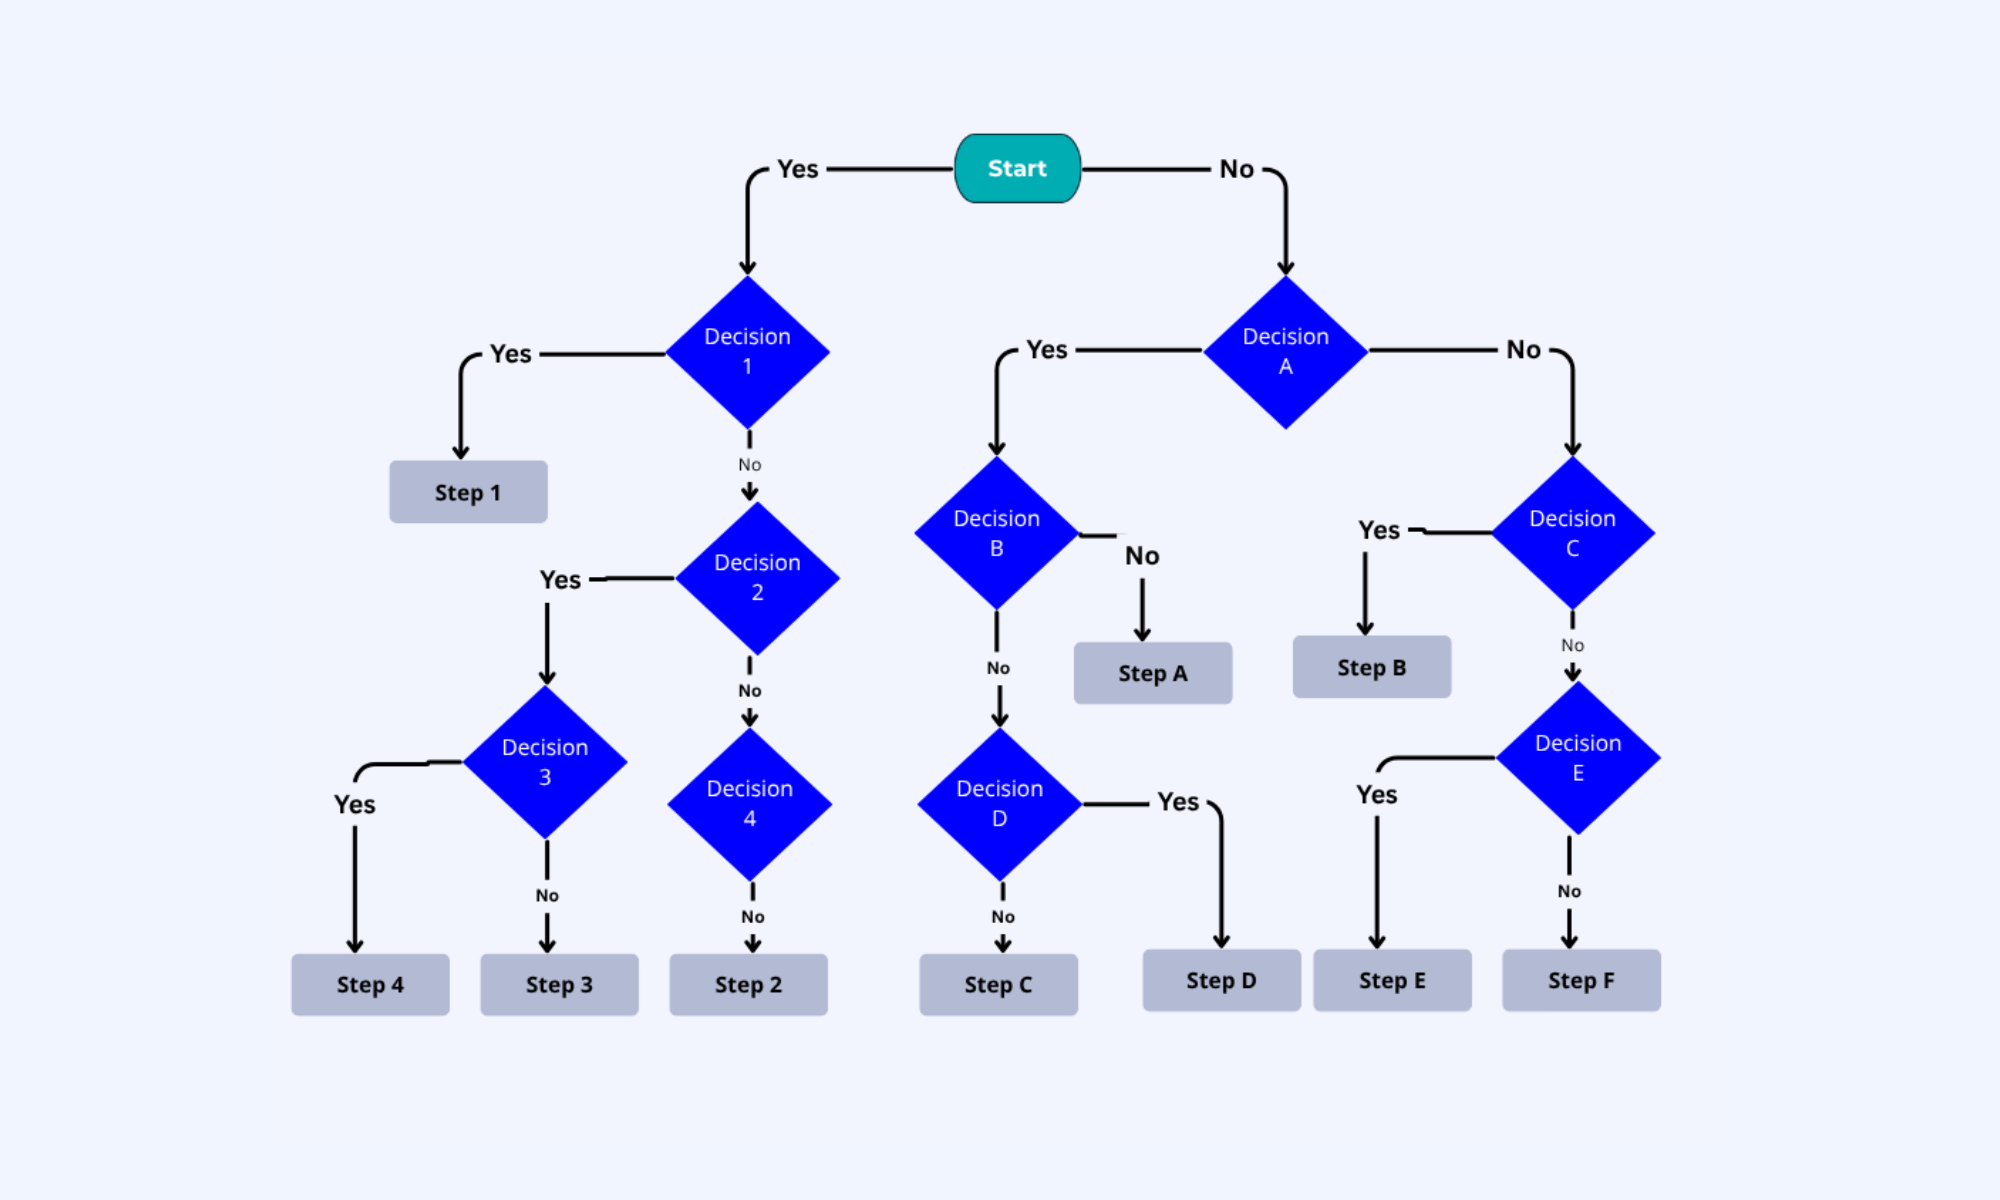
Image source: invensislearning.com
2. Process flow chart
A process flowchart is a visual map that shows how a task or operation progresses through a defined series of steps, from initial input to final output. For example, in a , the flow may begin with a purchase request, move through approval and vendor selection, and end with order fulfillment and payment. By clearly outlining each stage, teams can improve accountability, reduce delays, and maintain consistent quality across repeated processes.
3. Production flow chart
A production flow chart illustrates how raw materials or inputs are transformed into finished products through a structured sequence of activities. It may begin with material sourcing and inspection, proceed through assembly, quality control, and packaging, and conclude with distribution or delivery.
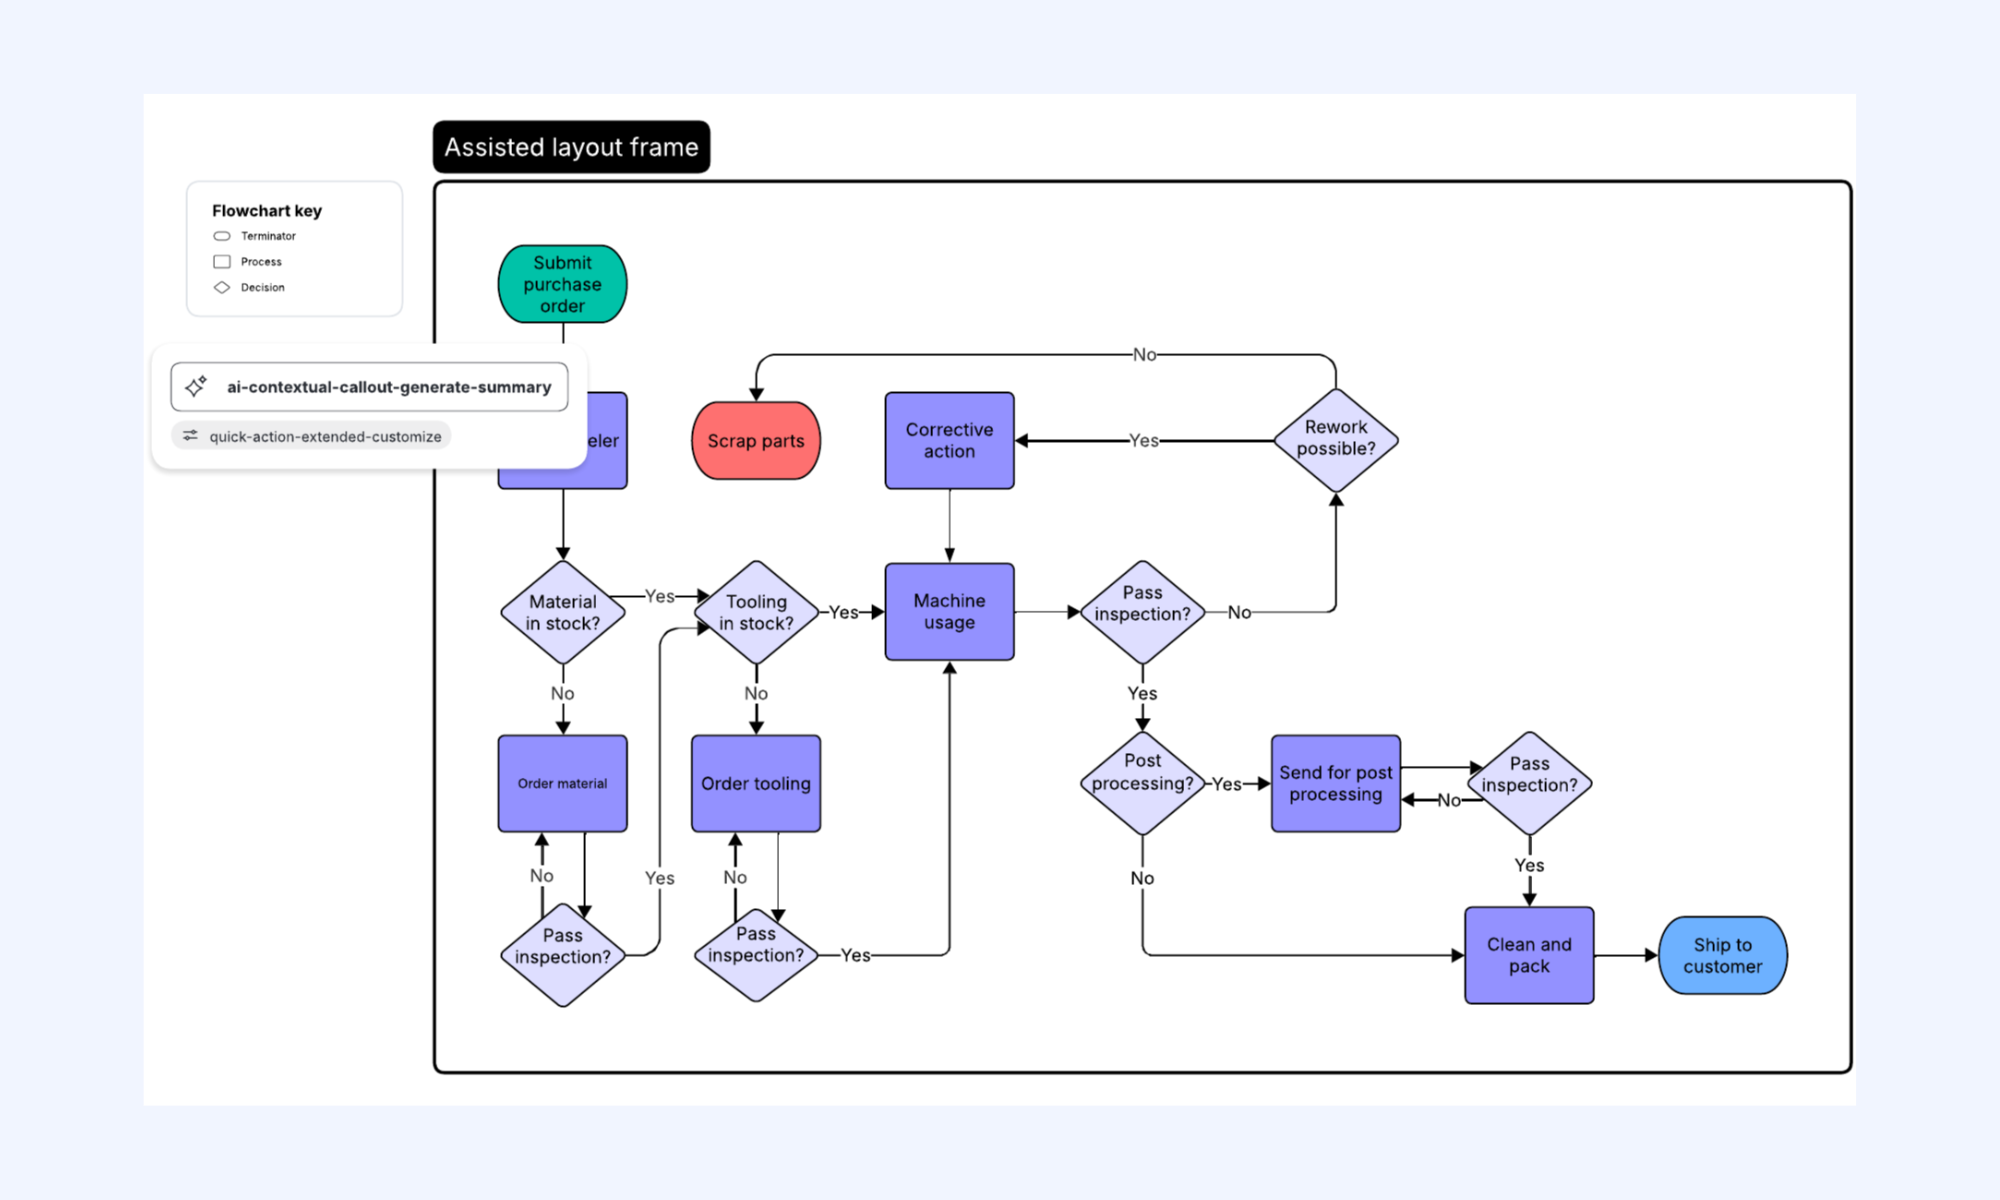
Image source: figma.com
4. PERT chart
A PERT chart (Program Evaluation and Review Technique) is a planning-focused flowchart that maps a project's tasks over a timeline, showing their dependencies and estimated durations. It highlights which activities must be completed before others can begin, helping teams identify the critical path that determines the overall project timeline. By visualizing task relationships and potential delays, a PERT chart supports better scheduling, resource allocation, and risk management throughout complex projects.
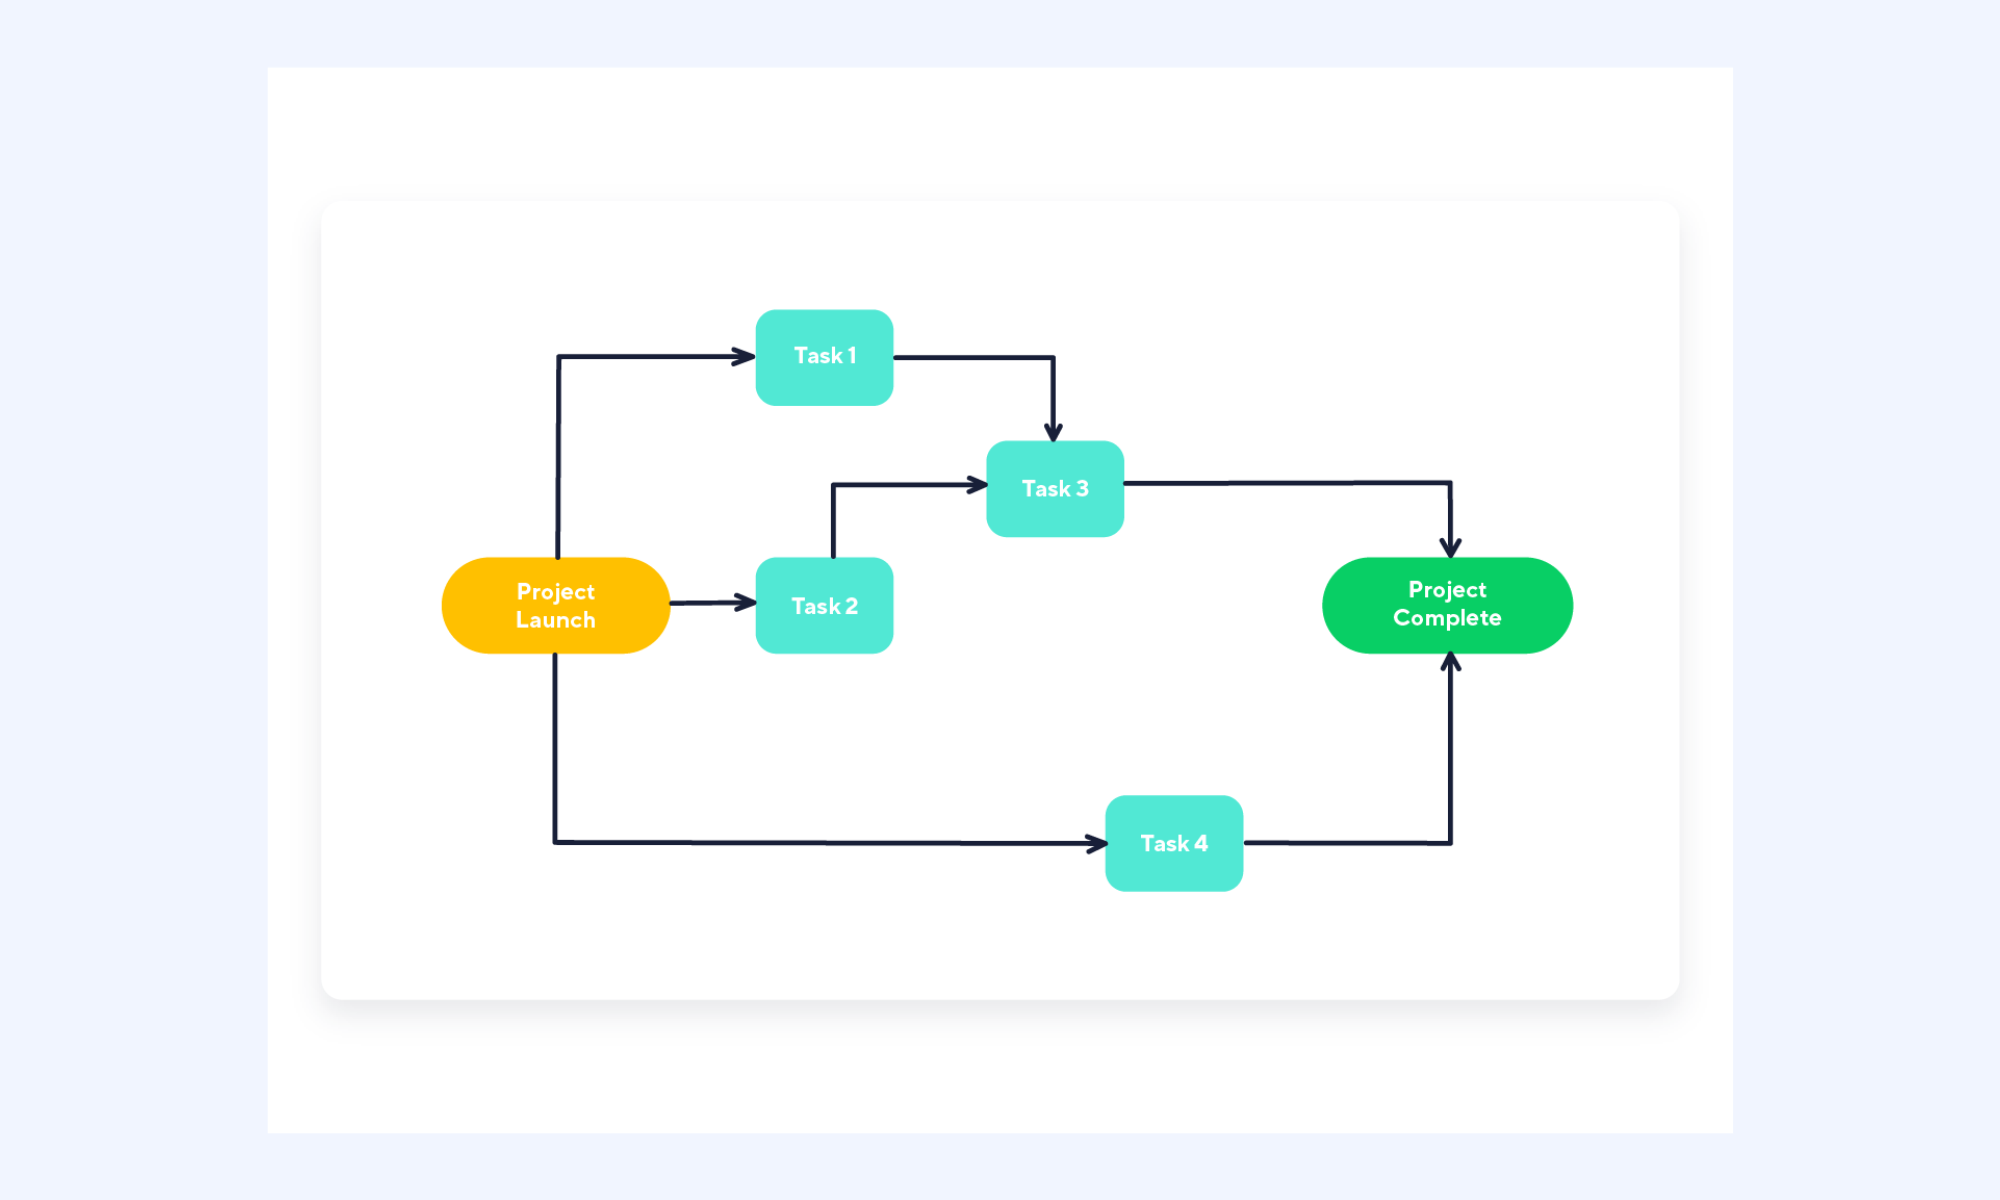
Image source: wrike.com
5. Workflow flow chart
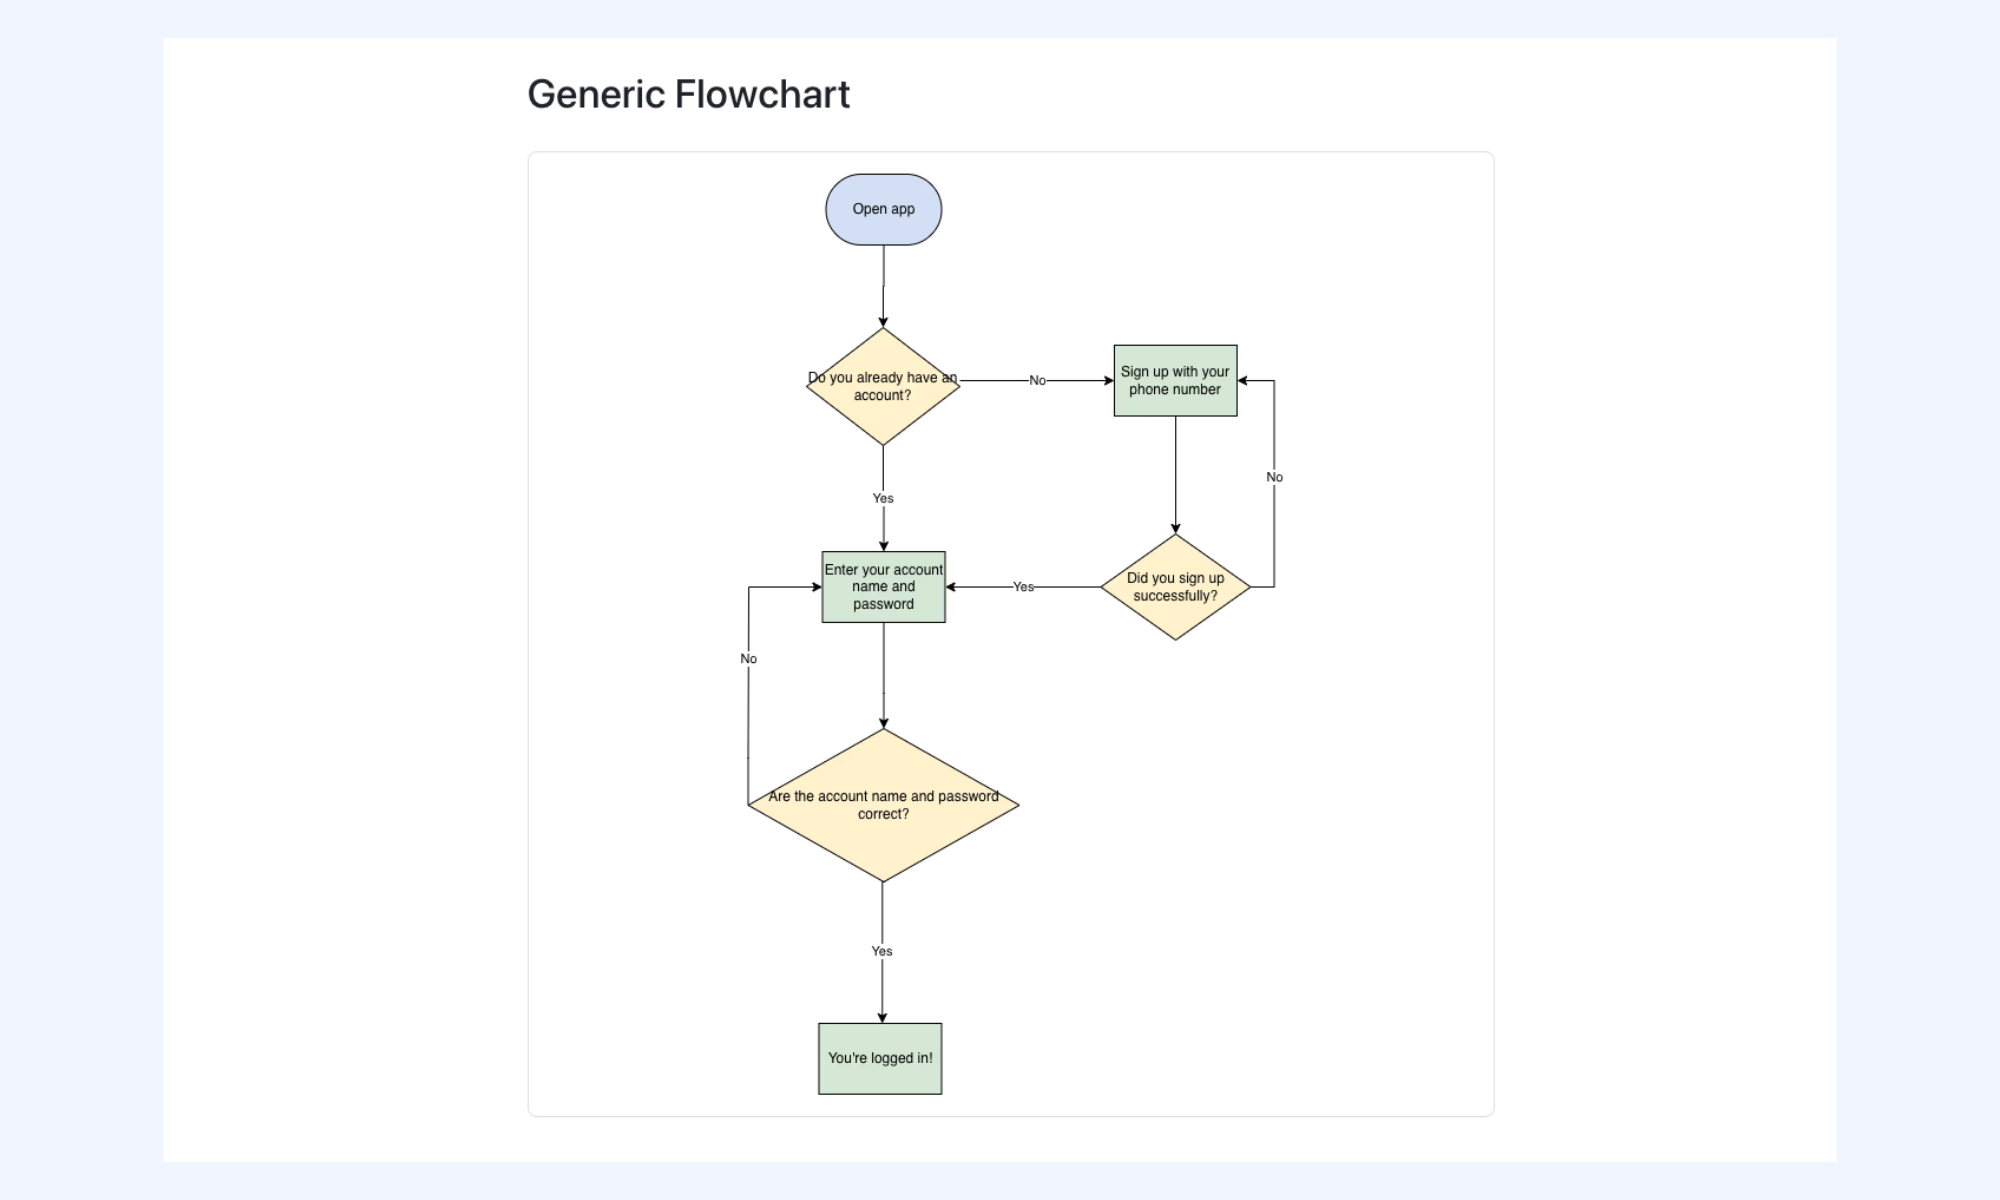
A workflow flow chart visualizes how tasks or processes move across individuals, teams, or systems from initiation to completion. For example, it provides a clear, step-by-step diagram that maps out actions and decision points, making it ideal for identifying bottlenecks or explaining workflows to stakeholders.
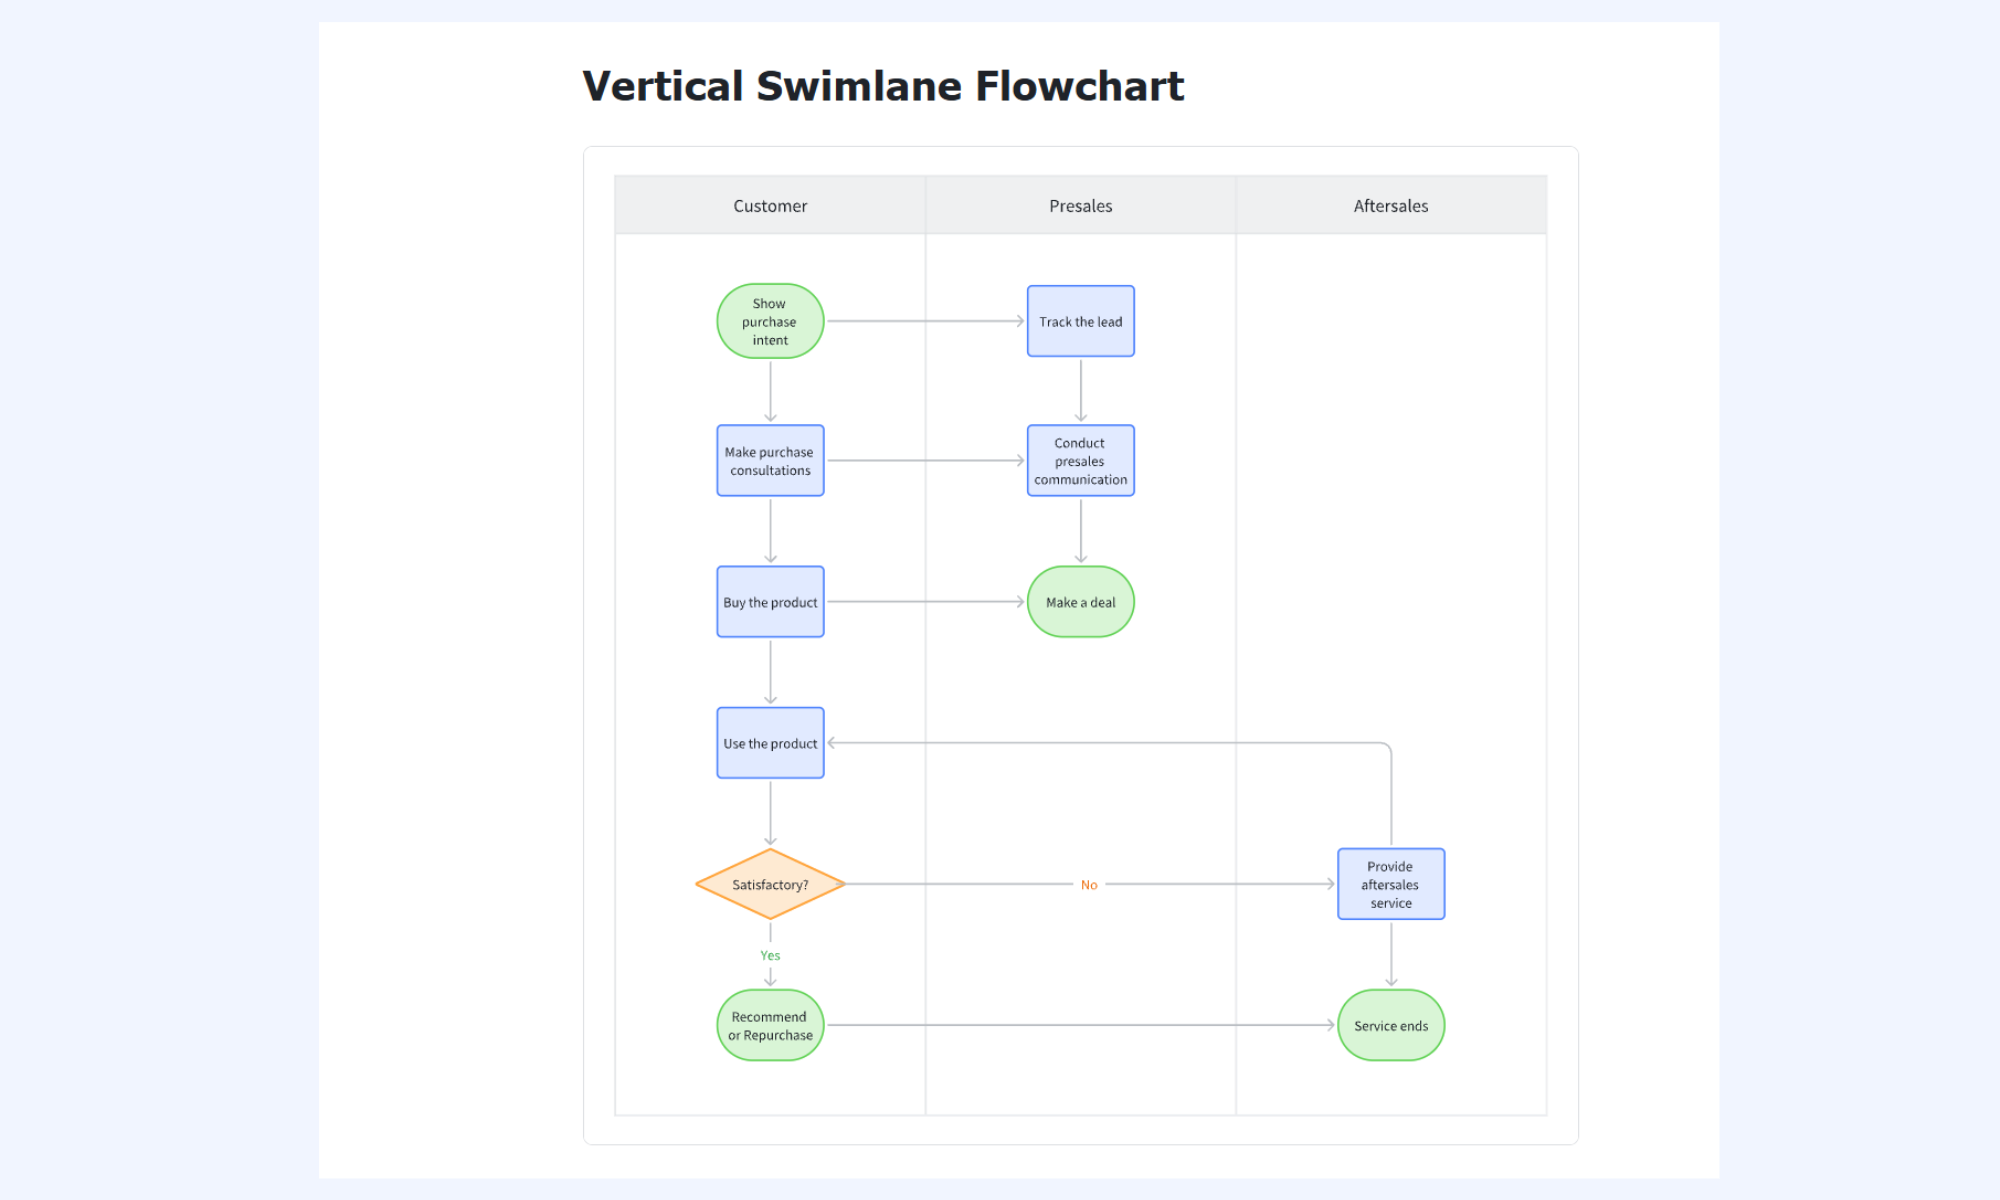
6. Swimlane flow chart
A swimlane flow chart organizes a process into horizontal or vertical "lanes," with each lane representing a specific role, team, or system. Actions are assigned to the responsible person or department, making it easy to see how work moves across stakeholders.
7. Decision tree flow chart
A decision tree flow chart breaks down a complex choice into a series of smaller, logical steps that branch into multiple possible outcomes. It typically starts with a single question and expands into "yes" or "no" paths, each leading to further decisions or final actions.
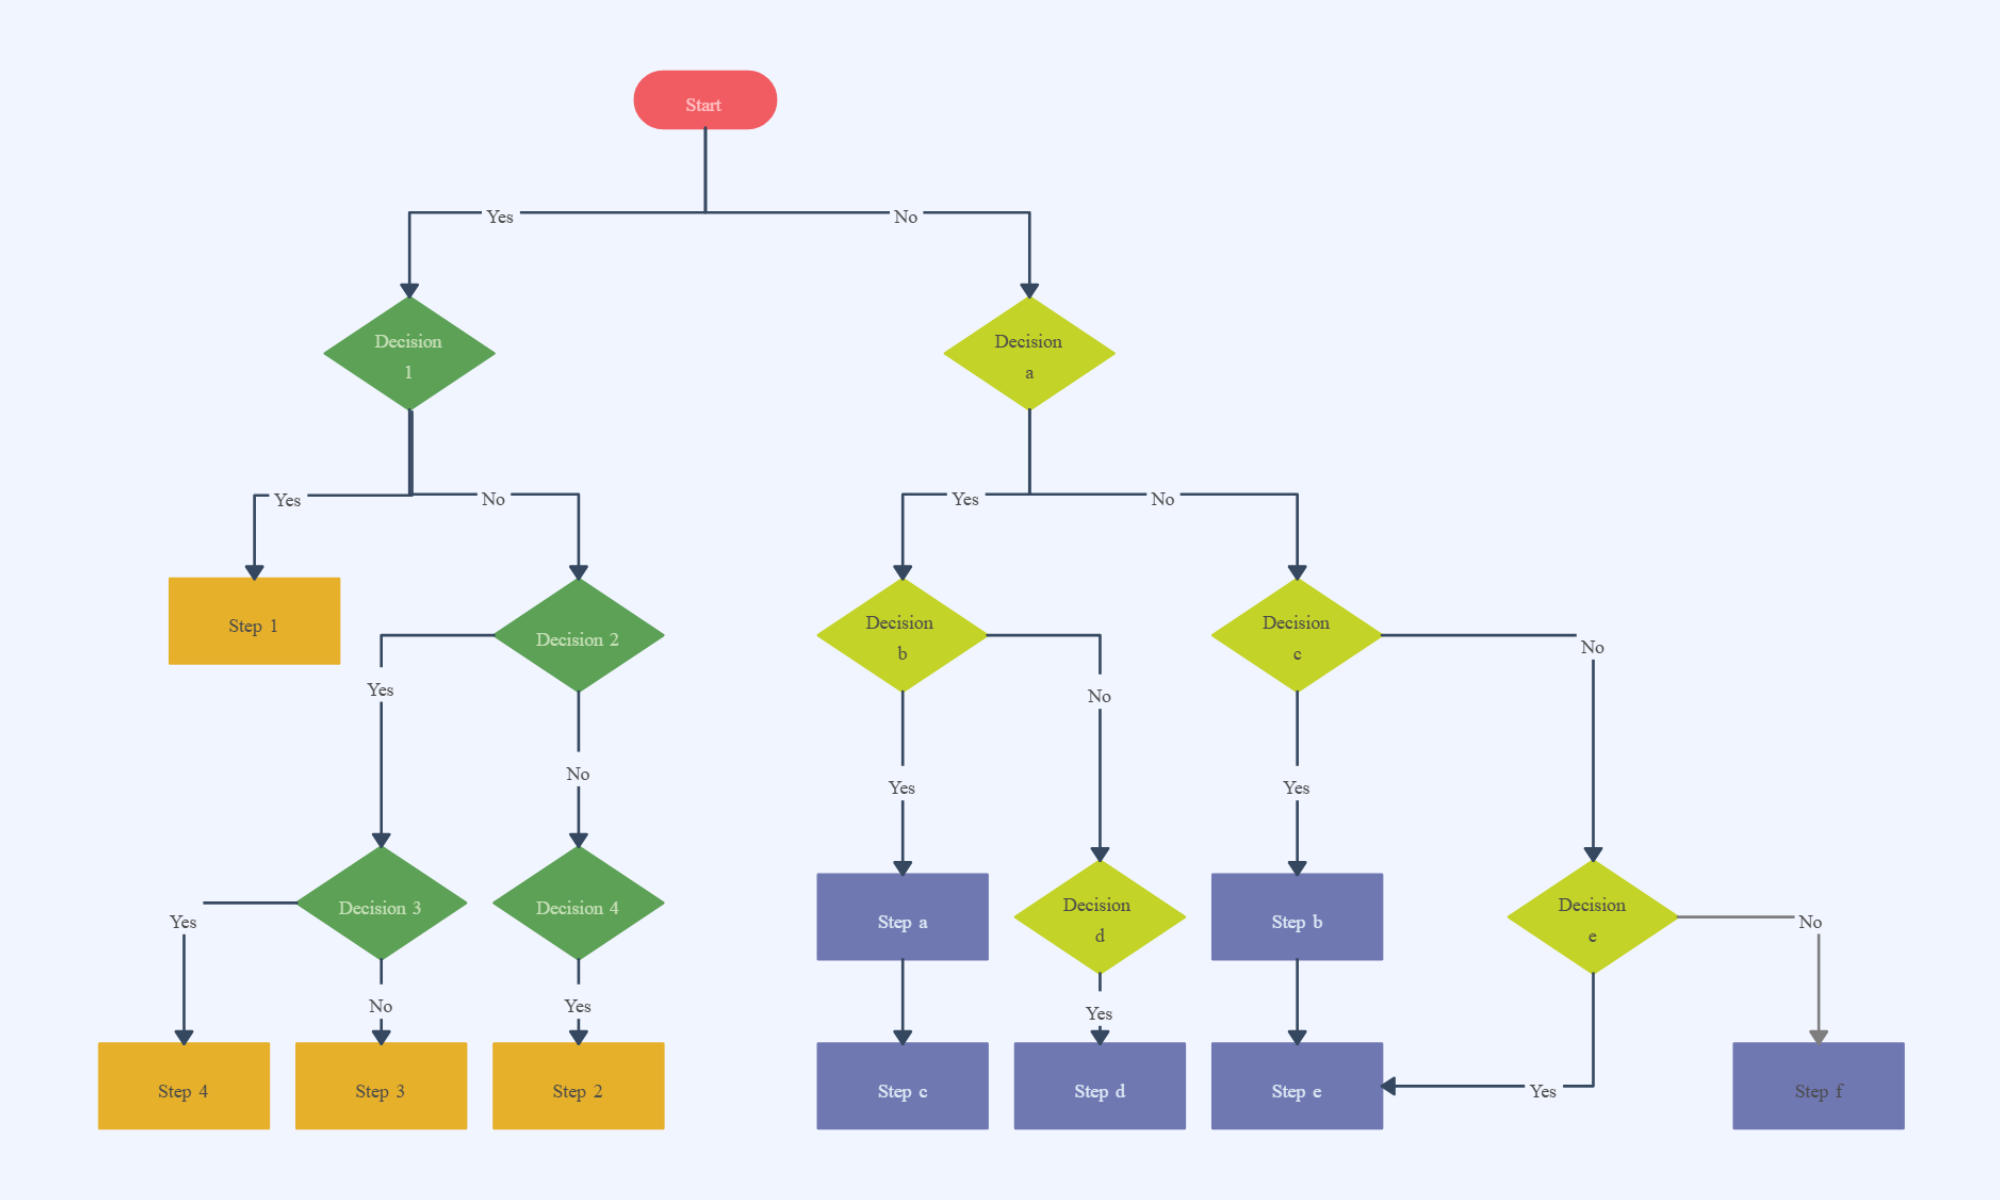
Image source: creately.com
8. Use case flow chart
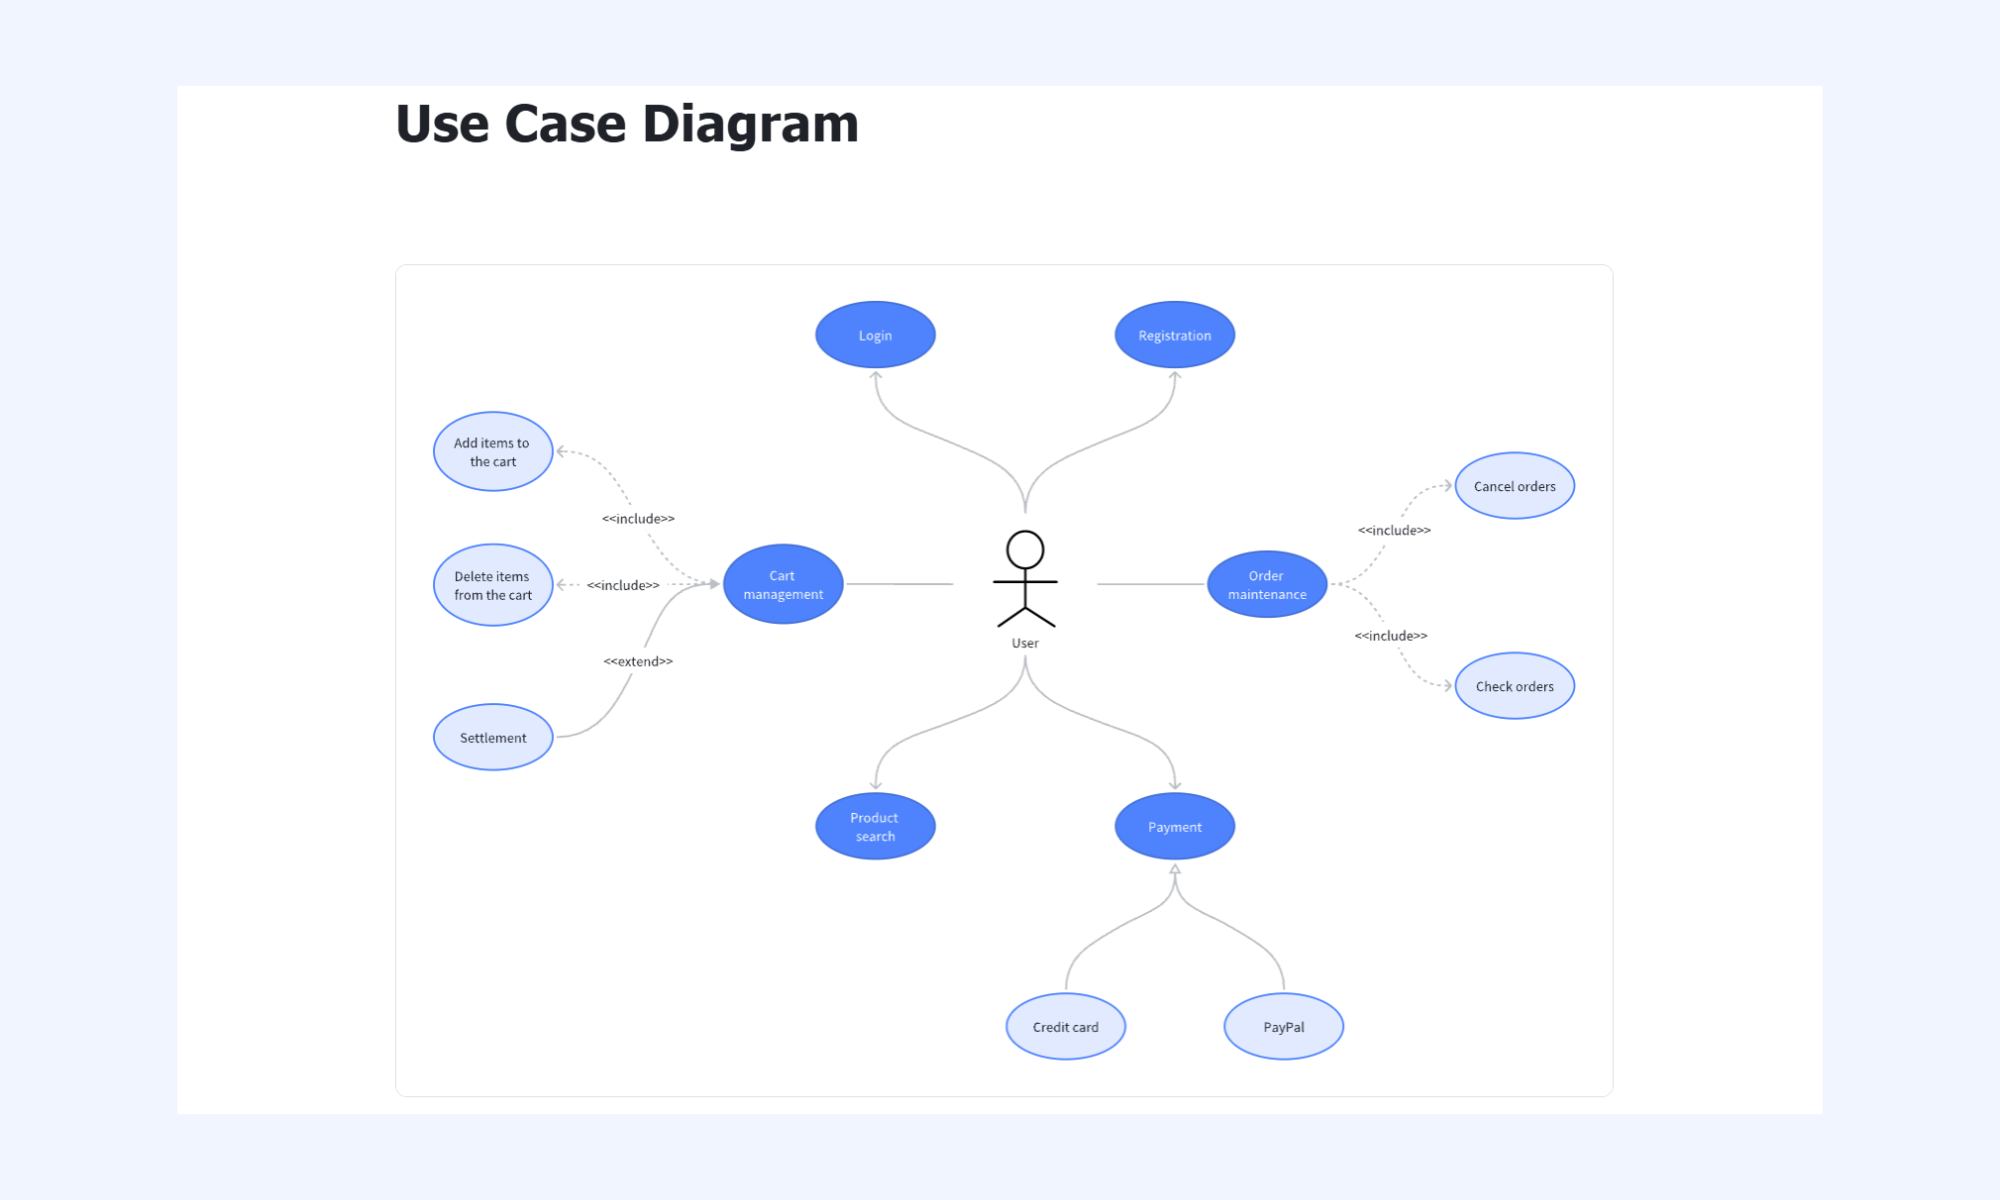
A use case flow chart illustrates how a user or system interacts with a product, service, or application to achieve a specific goal. It maps the primary success path, along with alternative and exception flows, showing what happens when something doesn't go as planned. This type of chart is especially helpful in and service design, as it aligns technical processes with real user behavior and expectations.
9. Event-driven flow chart
An event-driven flow chart shows how a process is triggered by a specific action or condition and how the system responds step by step. It typically begins with an event such as a form submission, system alert, or status change, and is then followed by automated or manual actions. This format is useful for mapping real-time workflows, notifications, and integrations, helping teams understand how different systems and people react to key events.
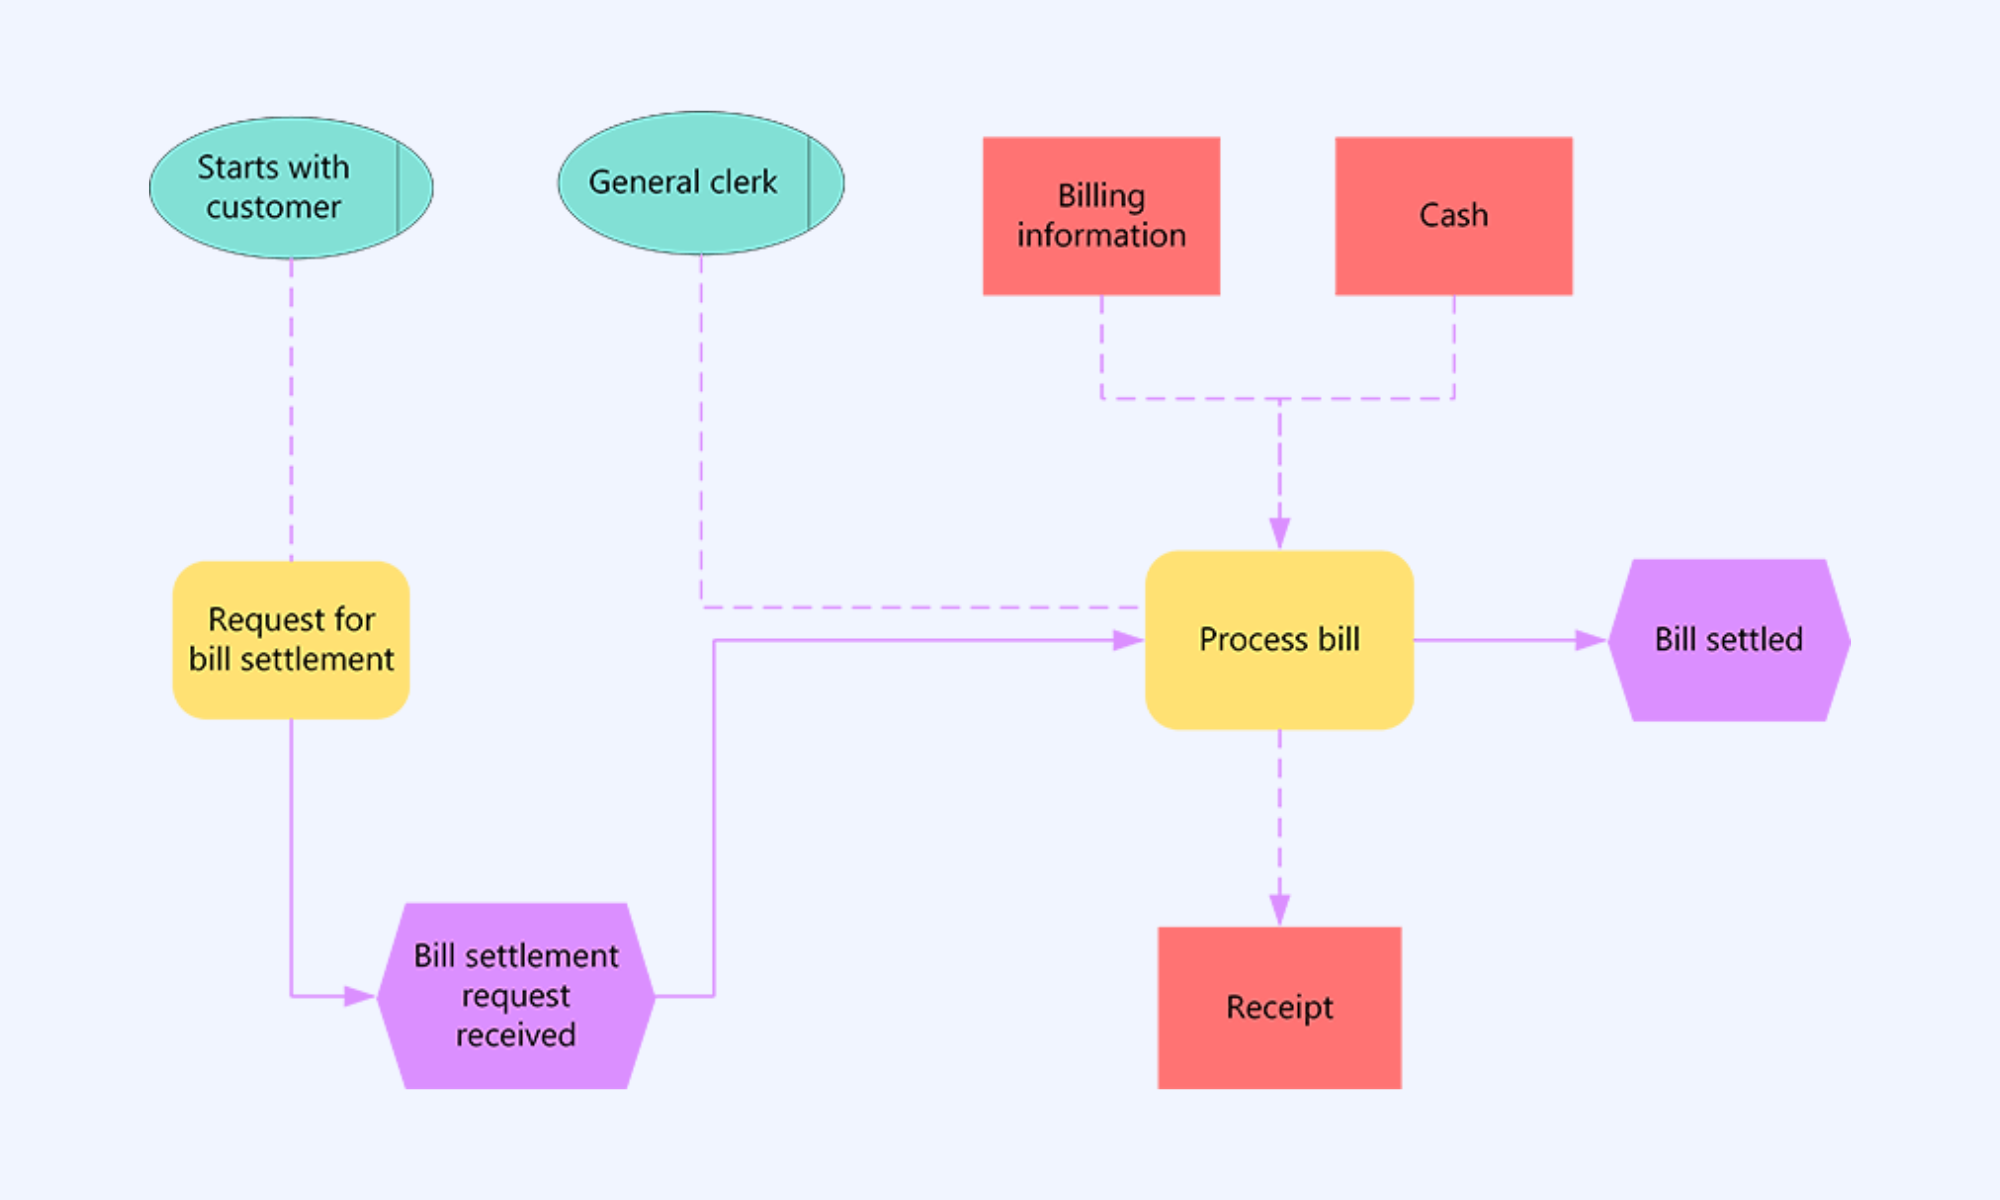
Image source: figma.com
10. Data flow chart (DFD)
A data flow chart, often called a Data Flow Diagram (DFD), illustrates how information enters, moves through, and exits a system. It highlights key elements such as data sources, processing steps, storage points, and final outputs, making complex systems easier to understand. By visualizing these pathways, teams can identify gaps, reduce redundancy, and ensure accurate, across applications and departments.
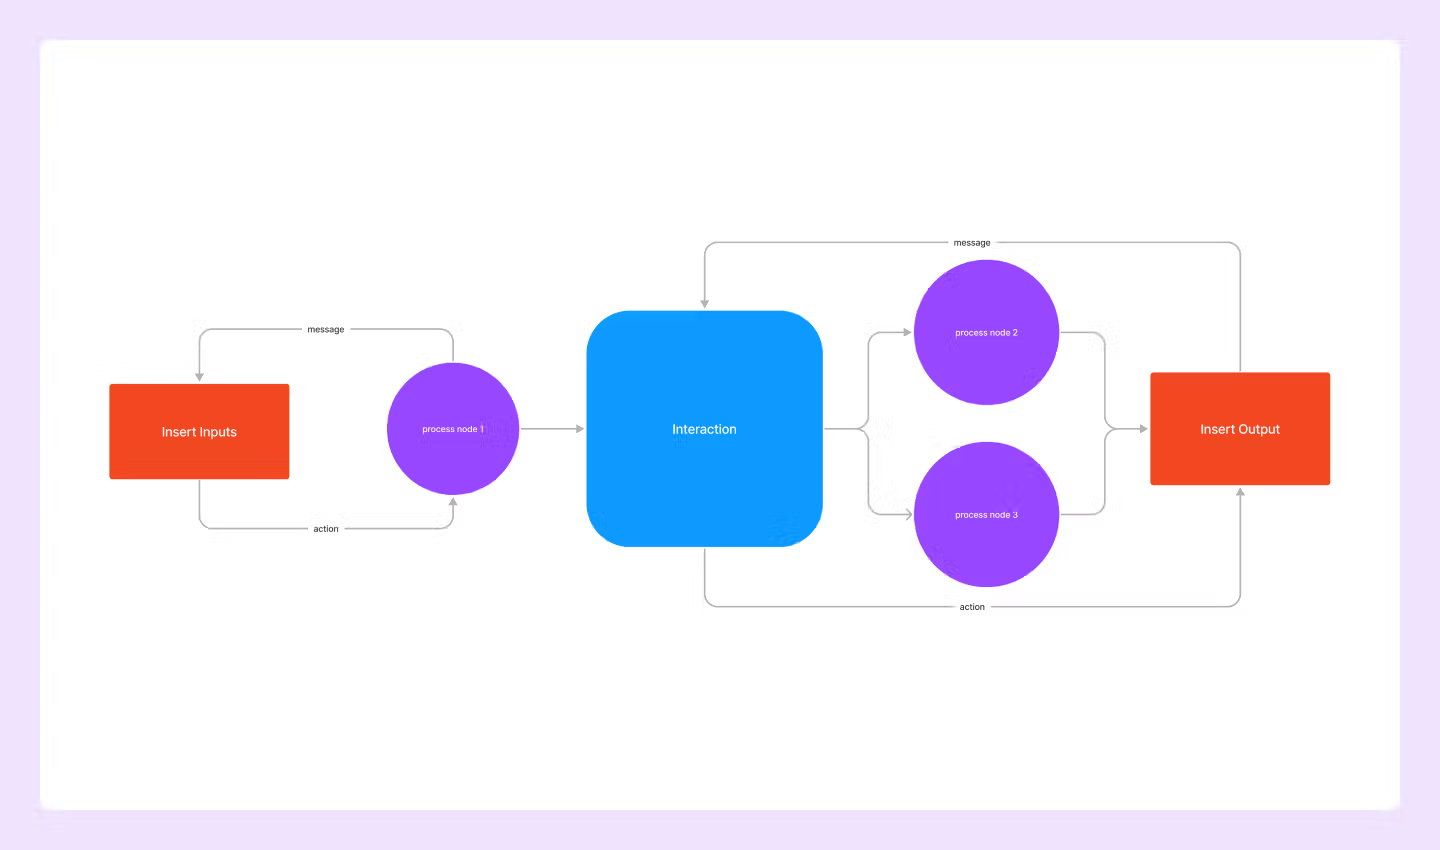
Image source: figma.com
11. System flow chart
A system flowchart shows how the components of a technical system work together to complete a process. It maps the interaction among hardware, software, databases, and users, illustrating how data and commands flow through the system. This type of chart is especially useful for IT teams and developers, as it supports system design, troubleshooting, and seamless integration across multiple platforms and applications.
12. Logical model flow chart
A logical model flow chart represents the reasoning and relationships behind a process rather than the physical steps or system components. It focuses on inputs, rules, conditions, and outcomes, showing how one decision or variable logically leads to another. This type of chart is useful for policy planning, research frameworks, and complex problem-solving, as it helps teams clearly understand the cause-and-effect structure that drives results.
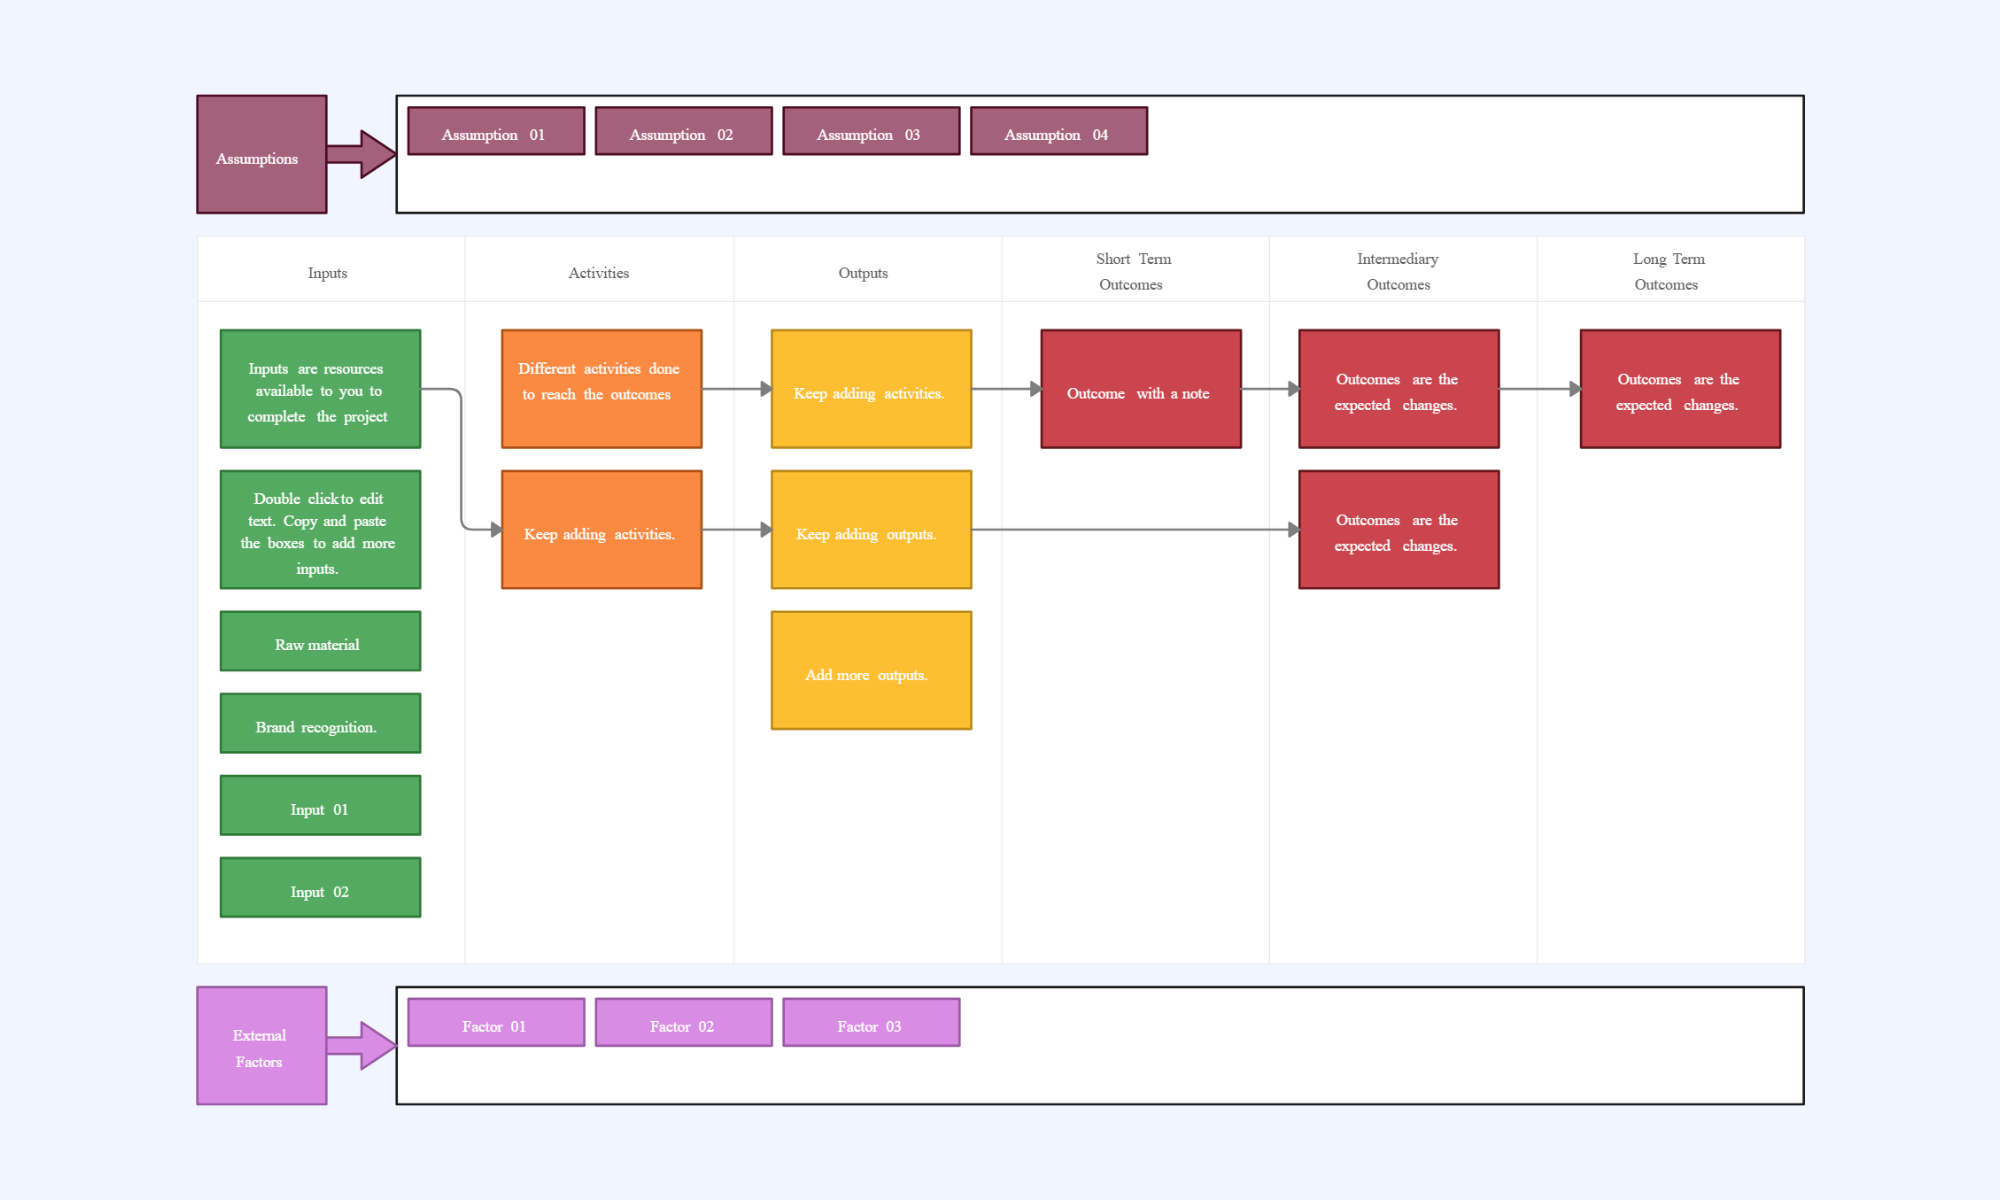
Image source: creately.com
13. Website structure flow chart
A website structure flowchart visualizes how a site's pages are organized and connected. It shows the hierarchy from the homepage to main sections, subpages, and supporting content, helping designers plan clear navigation paths. By mapping this structure early, teams can improve user experience, ensure important pages are easy to find, and keep the site scalable as new content or features are added.
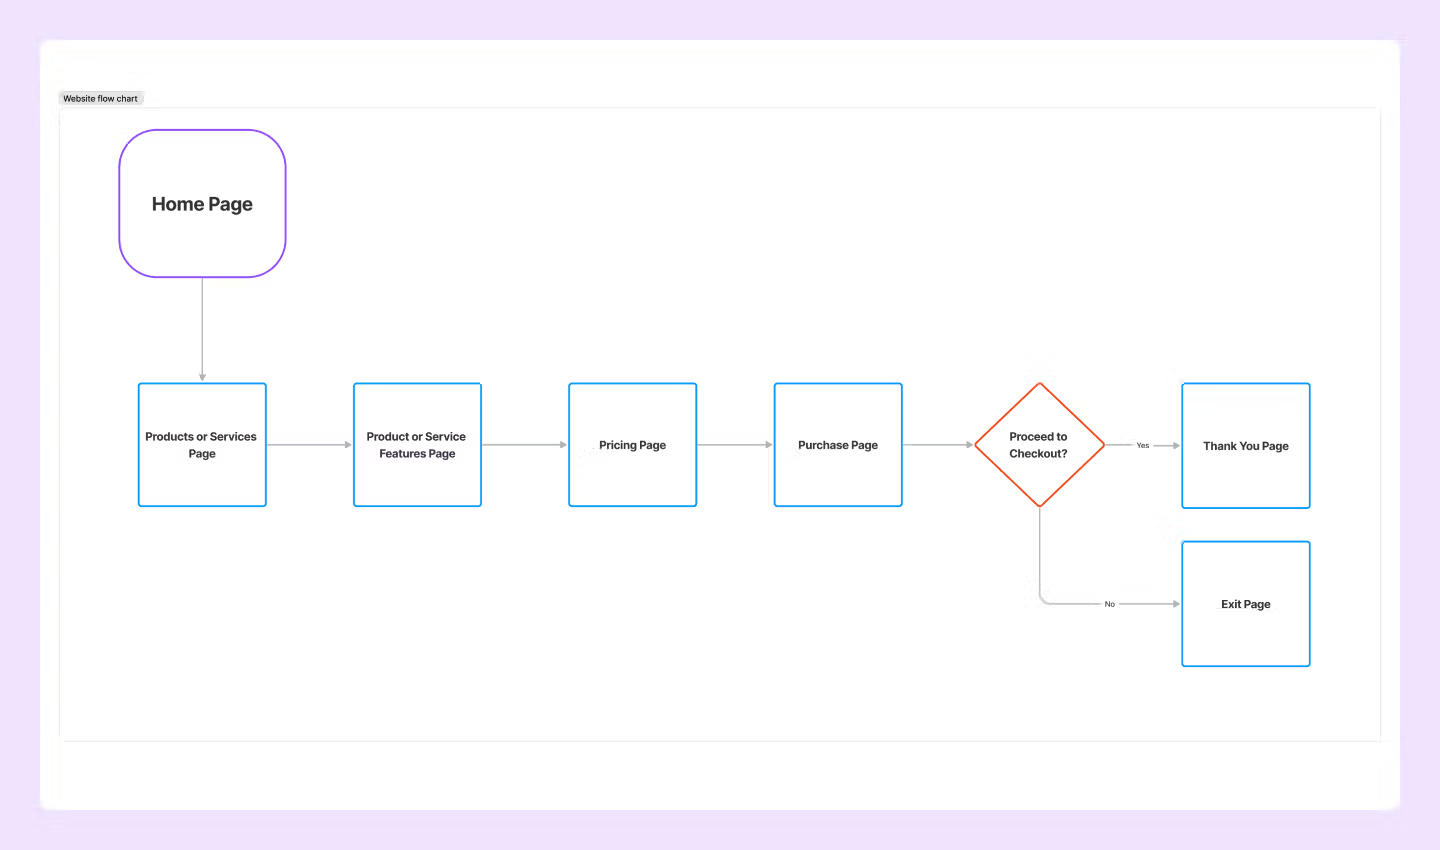
Image source: figma.com
14. Project lifecycle flow chart
A project lifecycle flow chart maps the full journey of a project from its initial idea to final completion and review. It typically begins with initiation and requirement definition, moves through planning and execution, and then highlights monitoring, quality checks, and formal closure. By and its dependencies, teams can maintain better control over timelines, manage risks more effectively, and ensure that every deliverable meets agreed expectations.
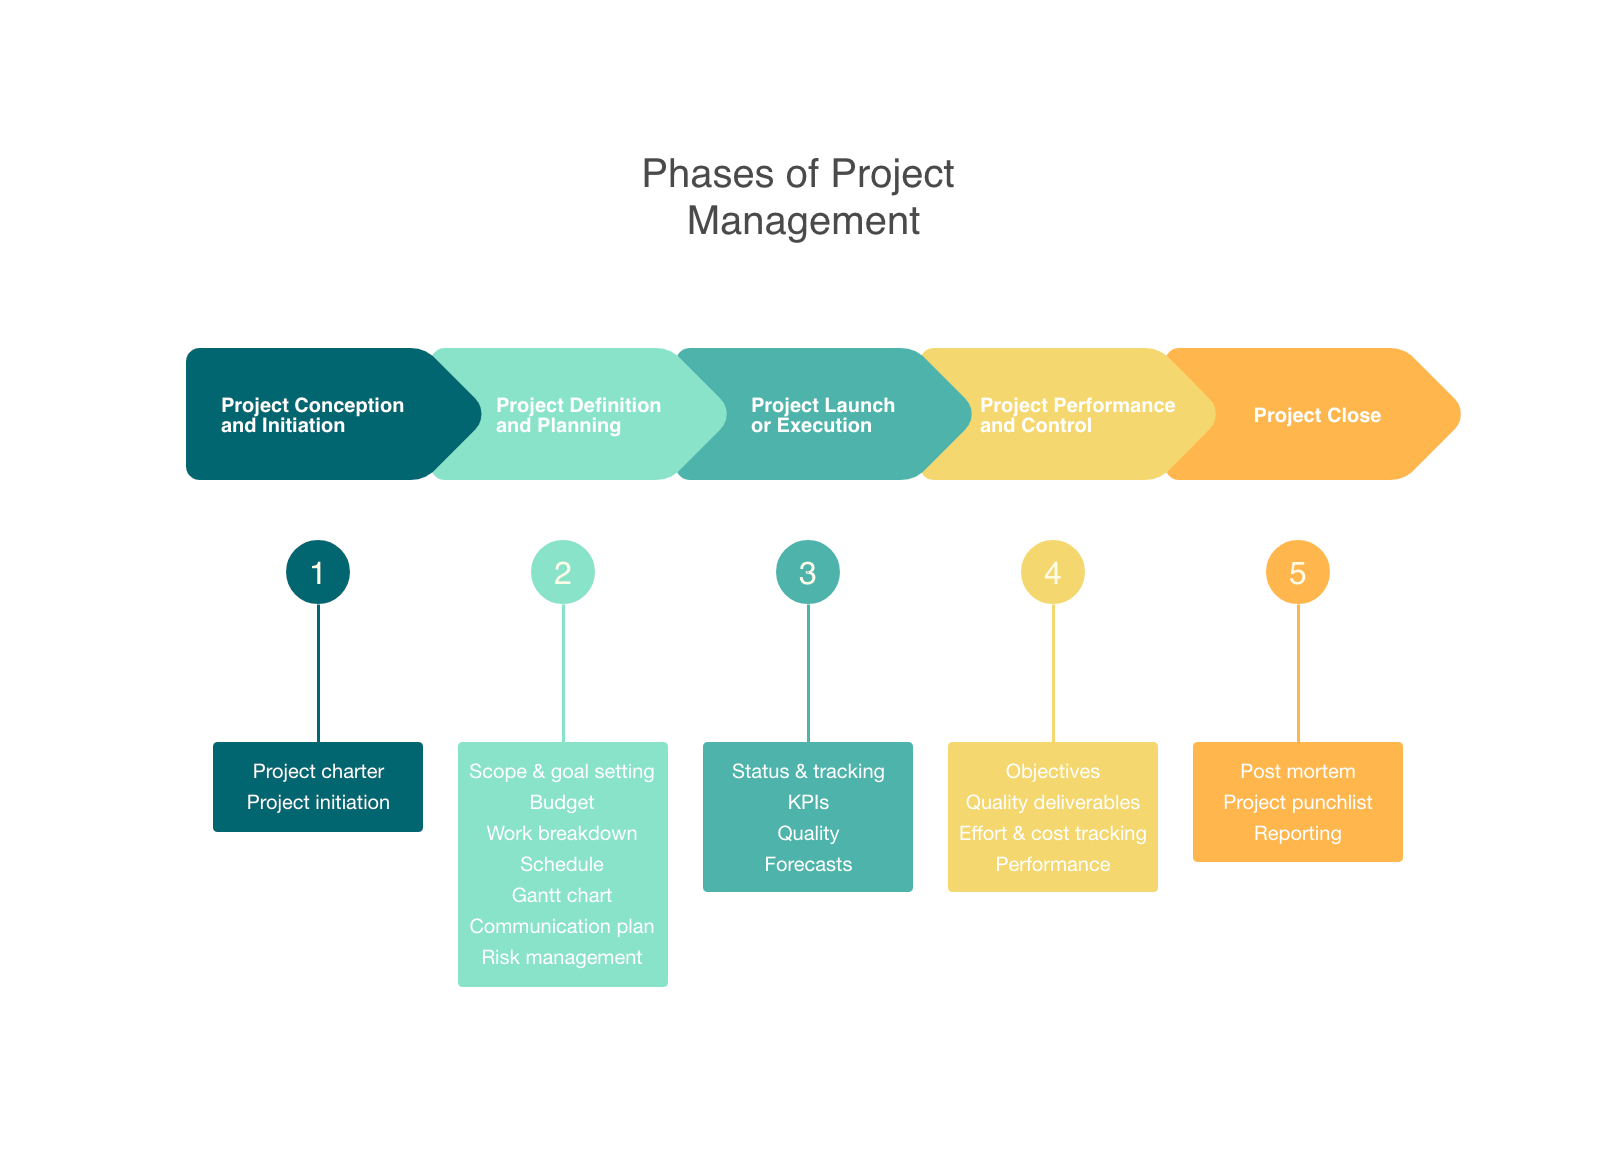
Image source: nulab.com
15. Change and issue management flow chart
A change and issue management flow chart outlines how requests, problems, or unexpected challenges are identified, evaluated, and resolved within a project or organization. It usually starts with reporting an issue or proposing a change, followed by assessment, approval or rejection, and implementation. By visualizing this path, teams can ensure accountability, maintain documentation, and prevent disruptions by handling changes in a structured, transparent, and consistent way.
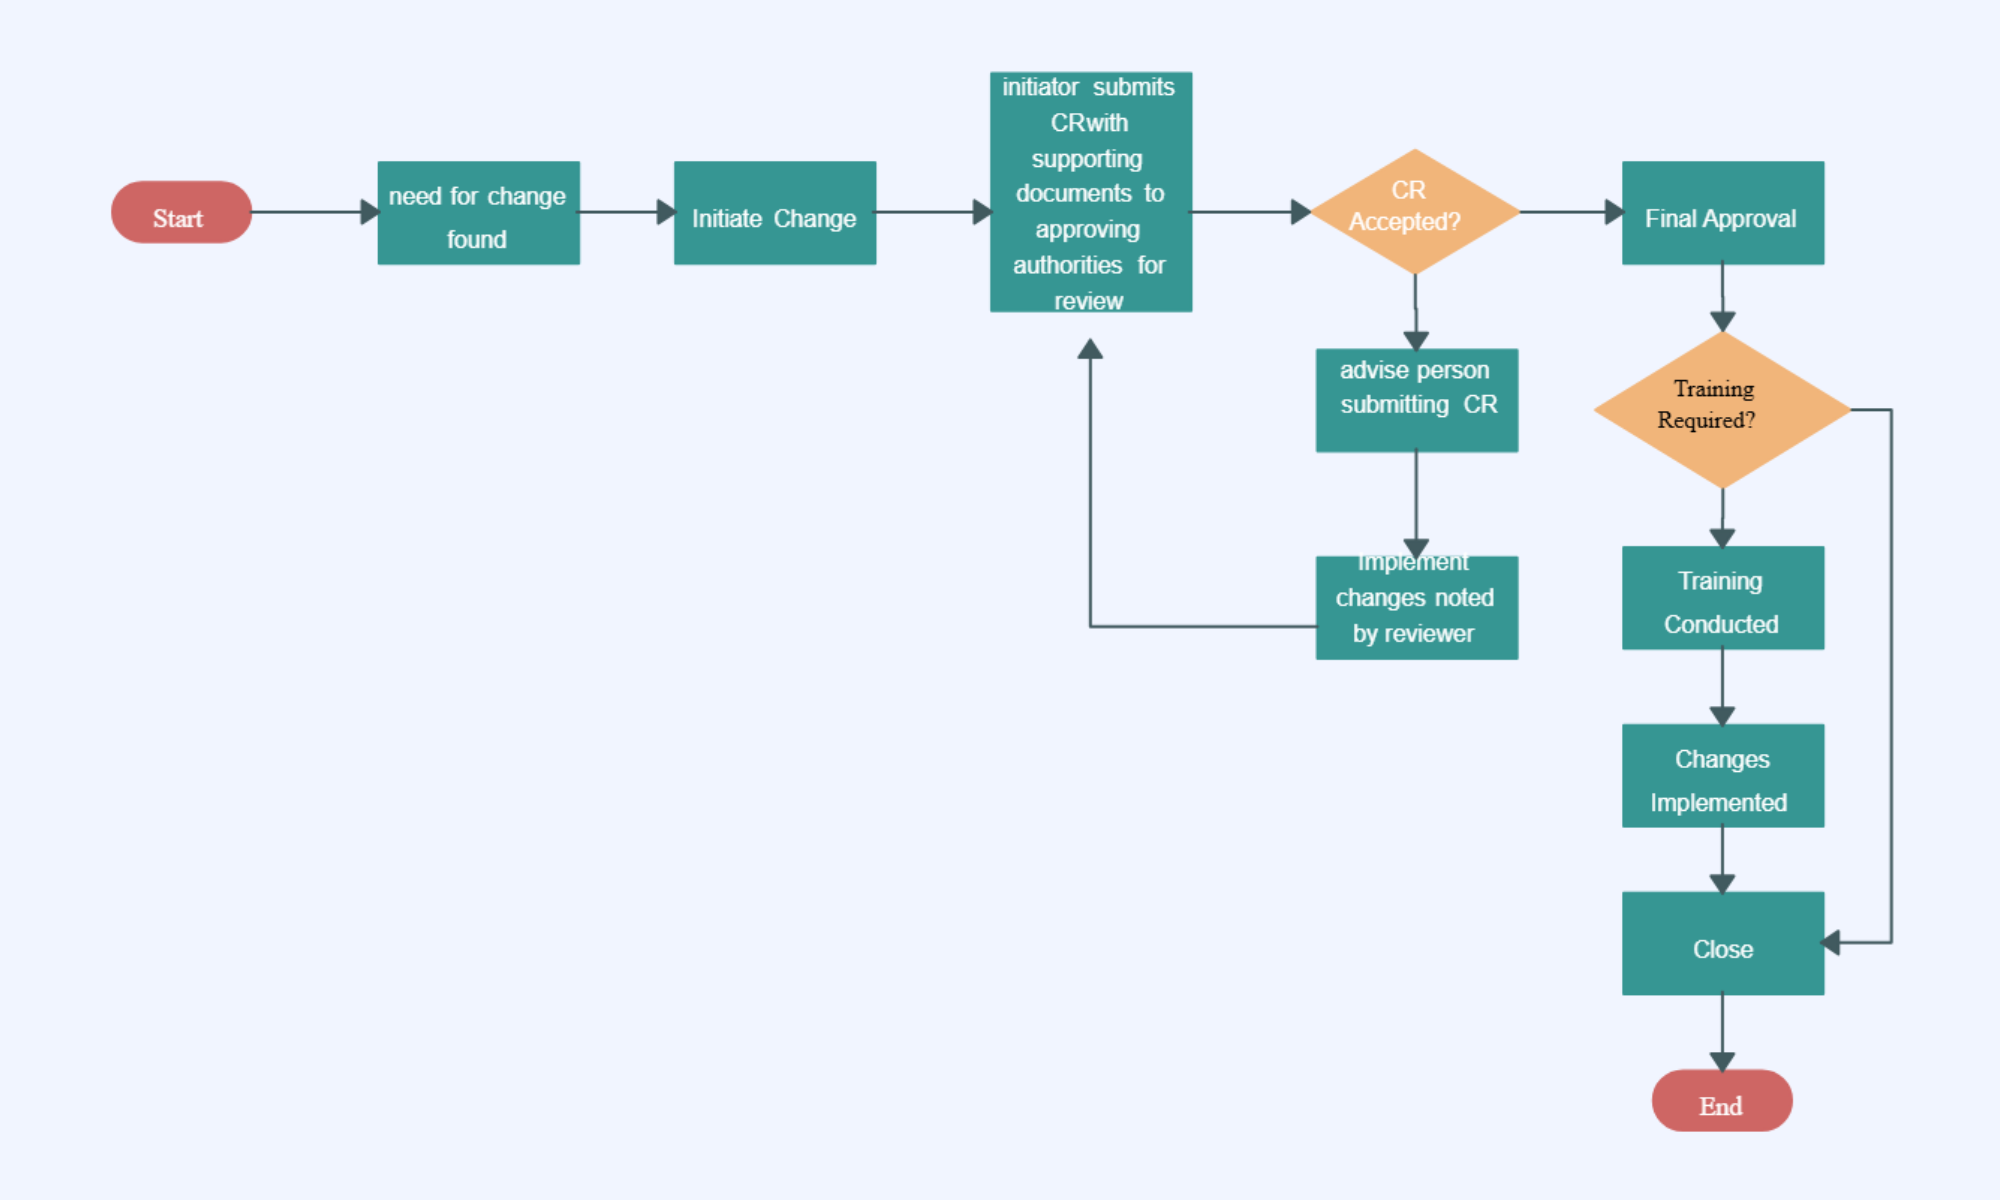
Image source: creately.com
16. Text-defined (Mermaid-style) flow charts
Text-defined (Mermaid-style) flow charts use simple, readable code syntax to create diagrams directly from text. Instead of dragging shapes, users write structured statements that define nodes, connections, and decision paths, which are then rendered into . This approach is popular in technical documentation and software projects because it allows flow charts to be version-controlled, easily updated, and embedded into markdown files, wikis, or code repositories for collaborative editing.
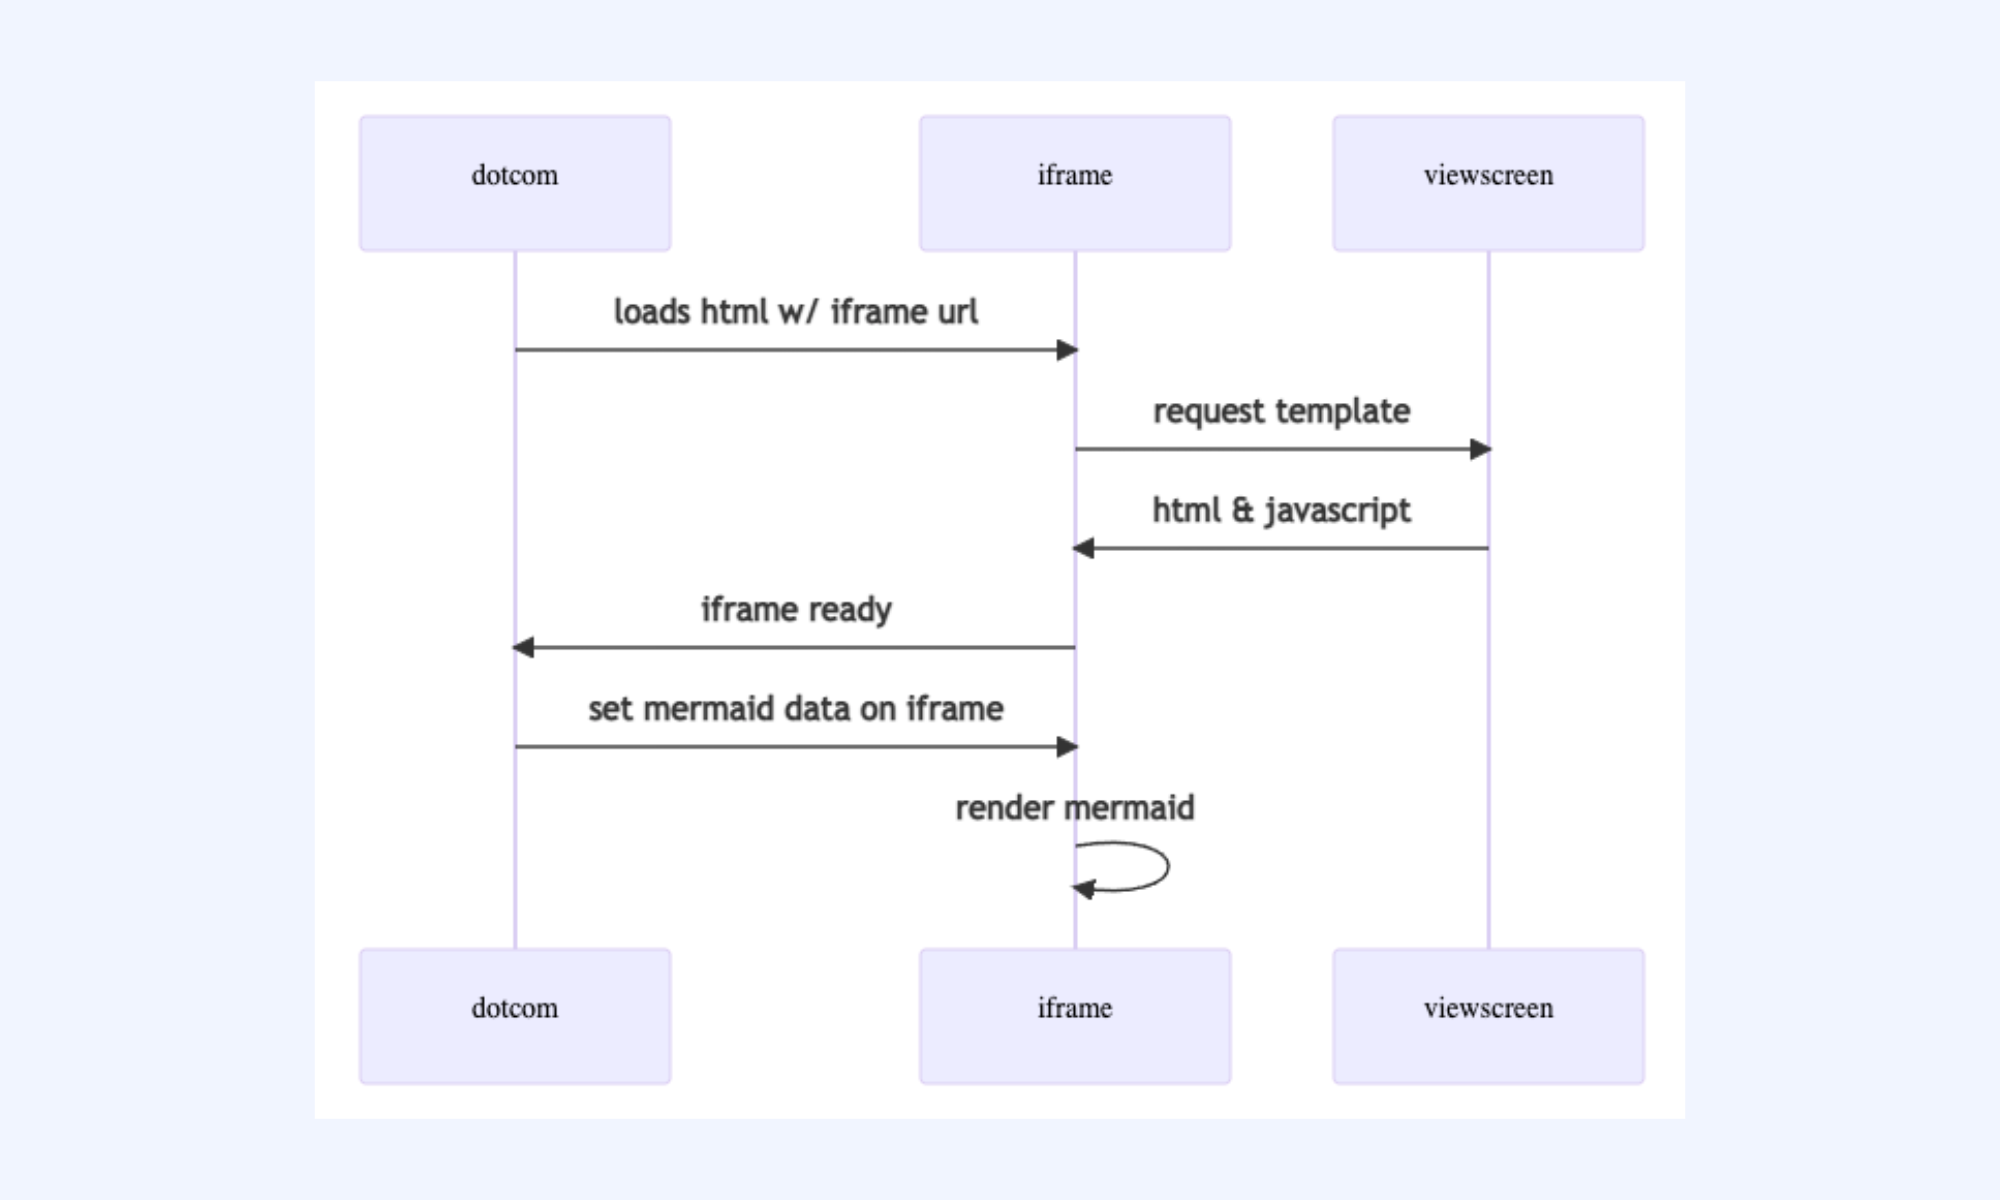
Image source: github.com
17. Code logic flow charts
Code logic flow charts illustrate how a program's instructions, conditions, and loops work together to produce an outcome. They map out sequences such as input handling, conditional checks, function calls, and error paths in a clear, step-by-step format. Developers use these charts to plan algorithms, debug complex logic, and explain how a piece of code behaves to team members who may not be familiar with the underlying programming language.
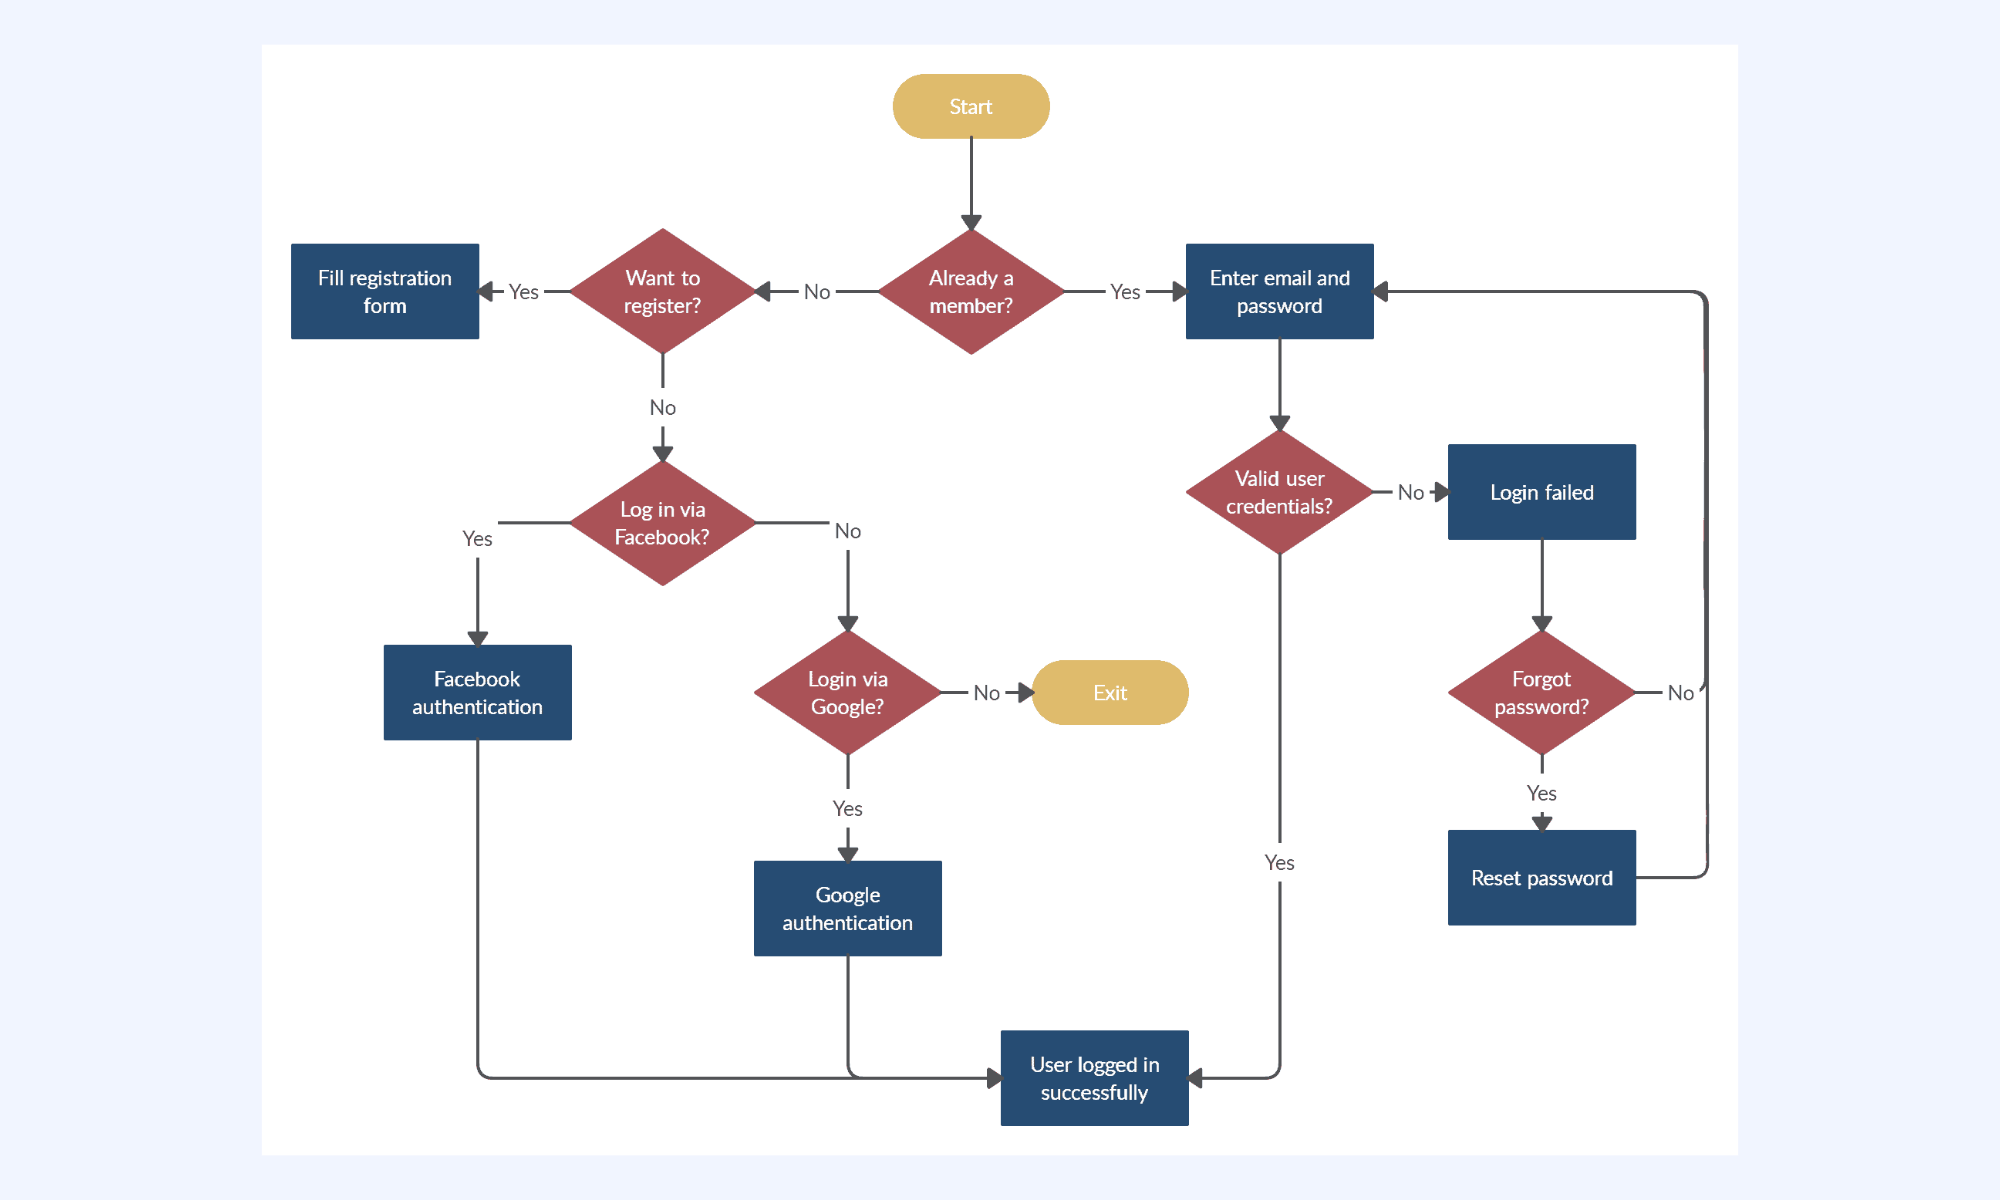
Image source: figma.com
18. PowerPoint flow chart example
Flow chart examples you can create in PowerPoint range from simple process diagrams to detailed decision trees and . Using built-in shapes, connectors, and SmartArt, teams can quickly design charts for presentations, training materials, or project reviews. These examples are especially useful for visual storytelling, as they combine clear structure with professional formatting to help stakeholders easily follow processes, roles, and key decision points.
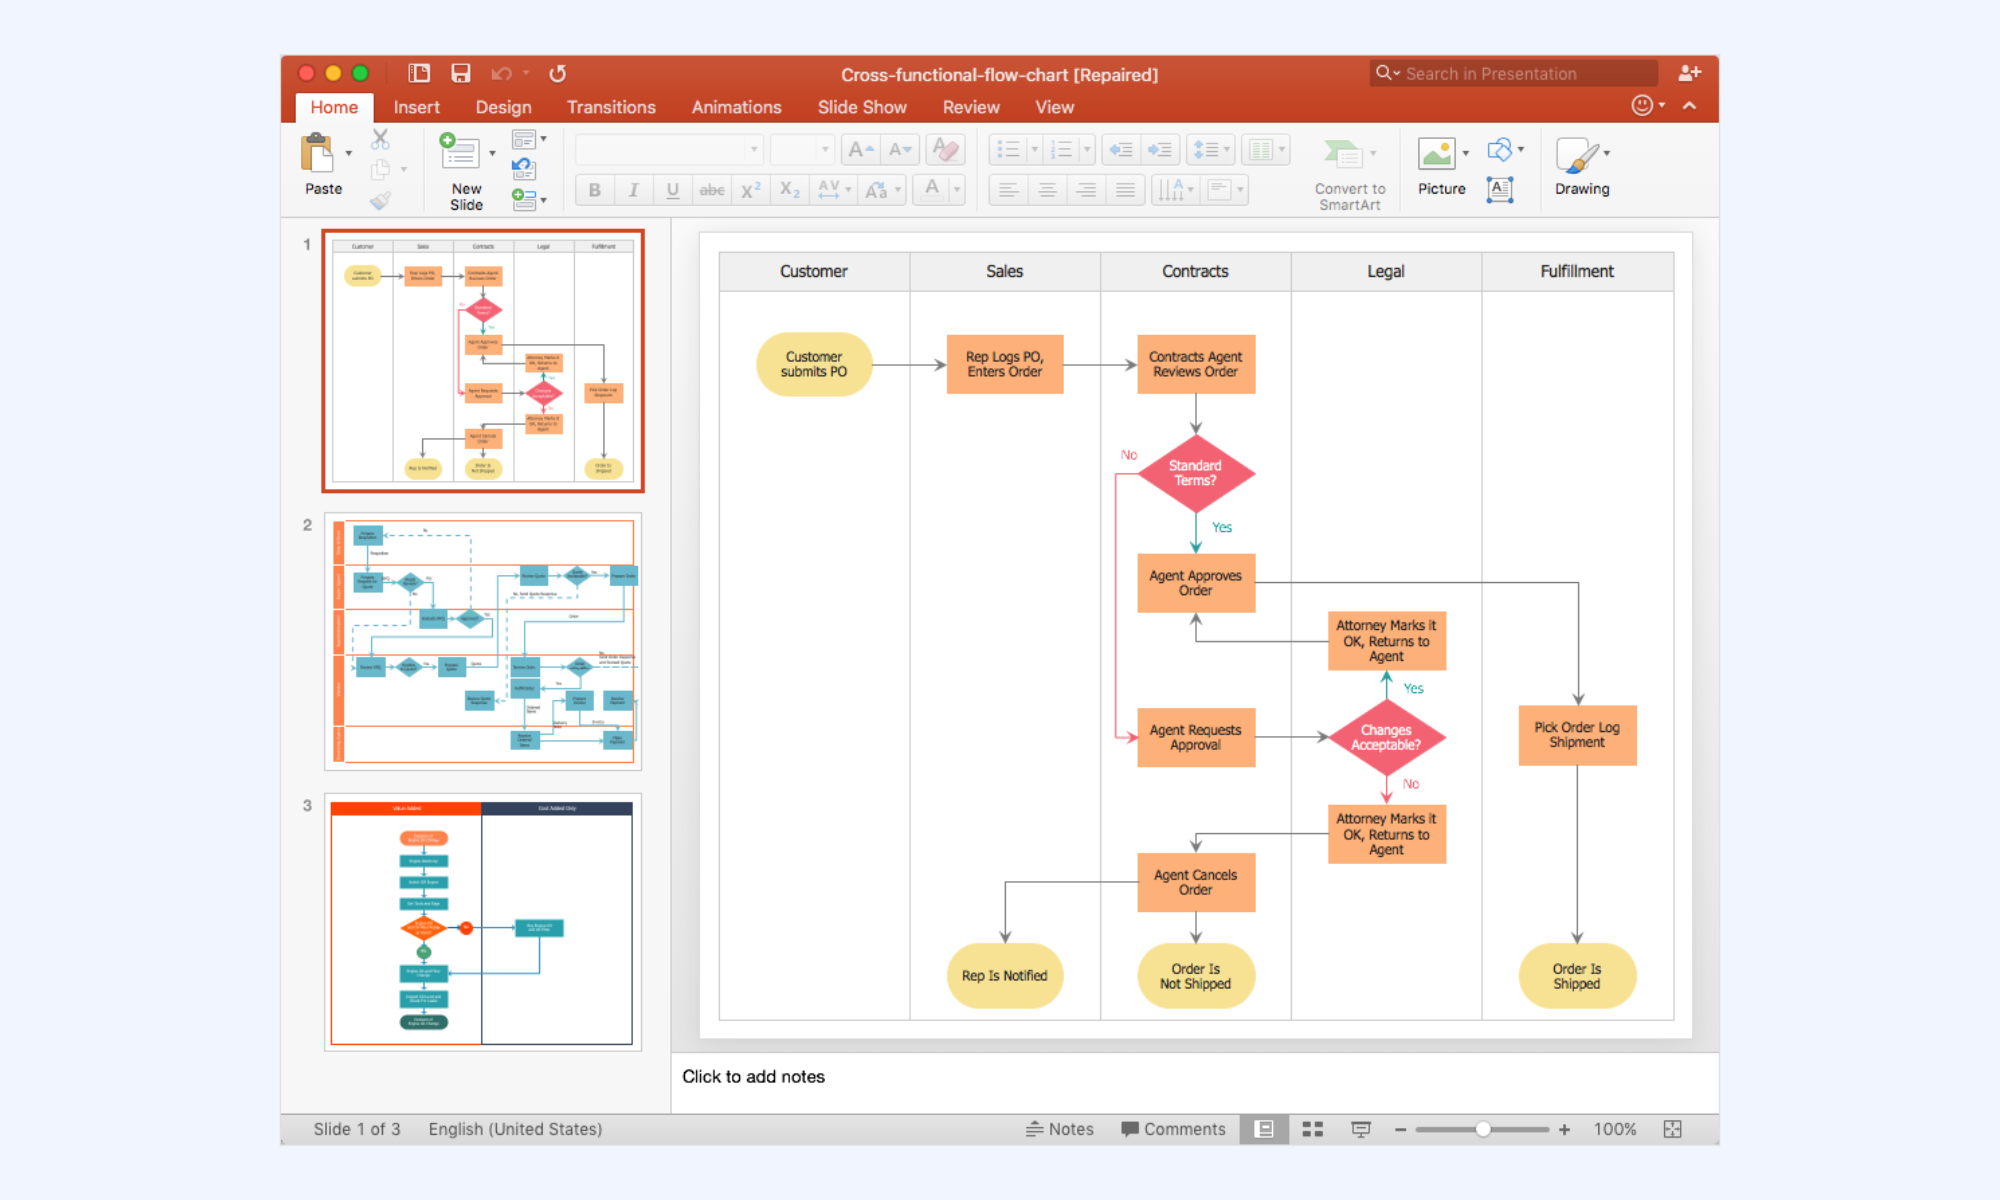
Image source: microsoft.com
How to choose the right flow chart
Choosing the right flow chart ensures your diagram not only looks clear but also communicates the right level of detail to the people who will use it. The type of chart you select should match both the purpose of the process and the needs of your audience.
- Process vs workflow vs decision charts: Use to show step-by-step tasks, workflow charts to highlight roles and handoffs, and decision charts to map out choices and outcomes. Matching the chart type to your goal helps avoid confusion and keeps the visual focused.
- Audience and complexity considerations: For beginners or non-technical stakeholders, keep diagrams simple with minimal symbols and short labels. More experienced teams can handle layered or detailed charts that include , dependencies, or system interactions.
- Keeping flow charts readable and useful: Maintain a consistent layout, clear direction, and limited color palettes to reduce visual clutter. Regularly review and update charts so they stay aligned with real-world processes and remain practical for daily use.
Meet Lark: Design your flow charts and turn them into real workflows
Moving from static flow chart examples to real, working systems is where true productivity gains begin. Instead of treating diagrams as reference material, teams can use them as blueprints for how work actually happens day to day. With Lark, each step, decision point, and handoff in a flow chart can be translated into an or collaborative task. This shift turns visual plans into living workflows that drive consistency, accountability, and faster execution across the organization.
Digital whiteboard
The board in Lark is a native canvas that lets you sketch and collaborate on flowchart diagrams in real time. It provides a library of shapes, arrows, and connectors specifically designed for process mapping. Because it is embedded within the document, teams can before transitioning those steps into functional automations. 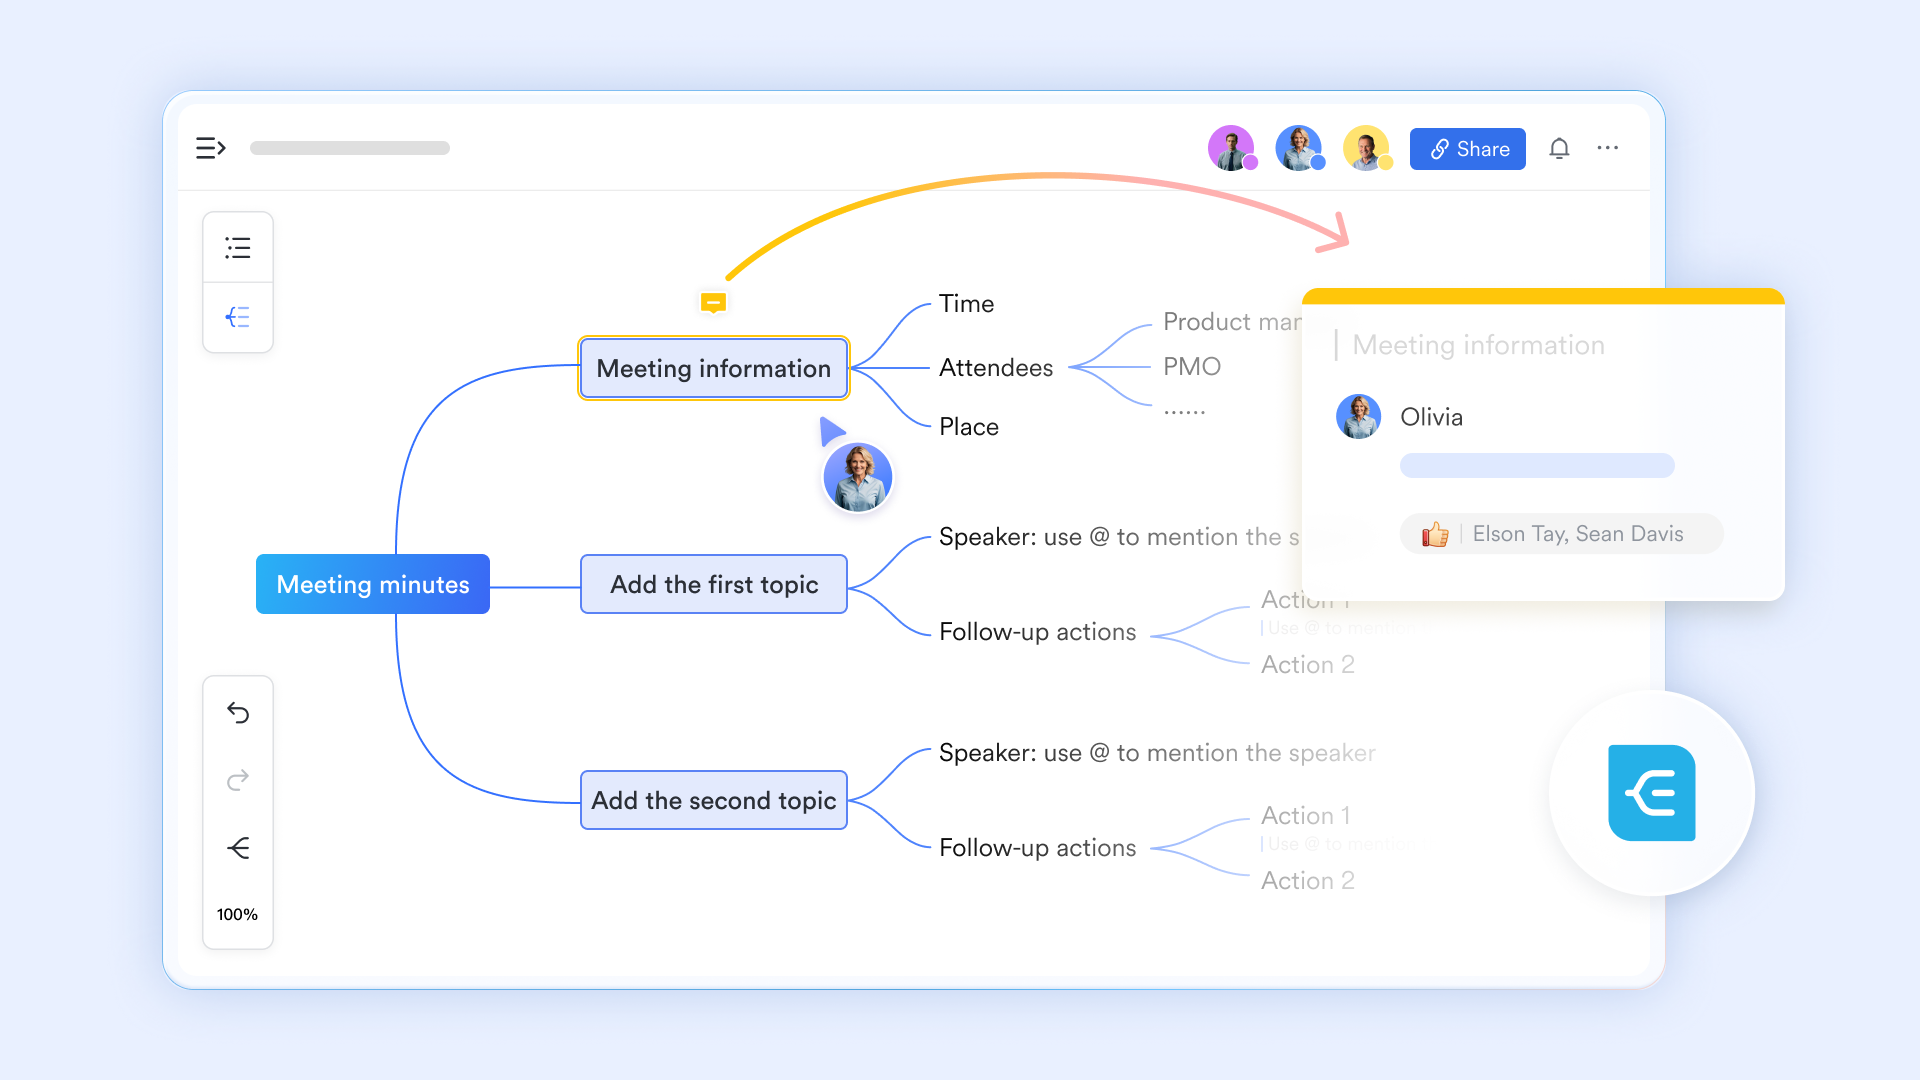
Automated workflows
Lark Base workflows allows you to build "If-Then" logic that acts as the invisible hand moving your workflow forward. You can set specific triggers—such as a status changing to "Complete" or a date reaching its deadline—to execute actions like sending a Messenger notification, updating a record, or creating a new task. 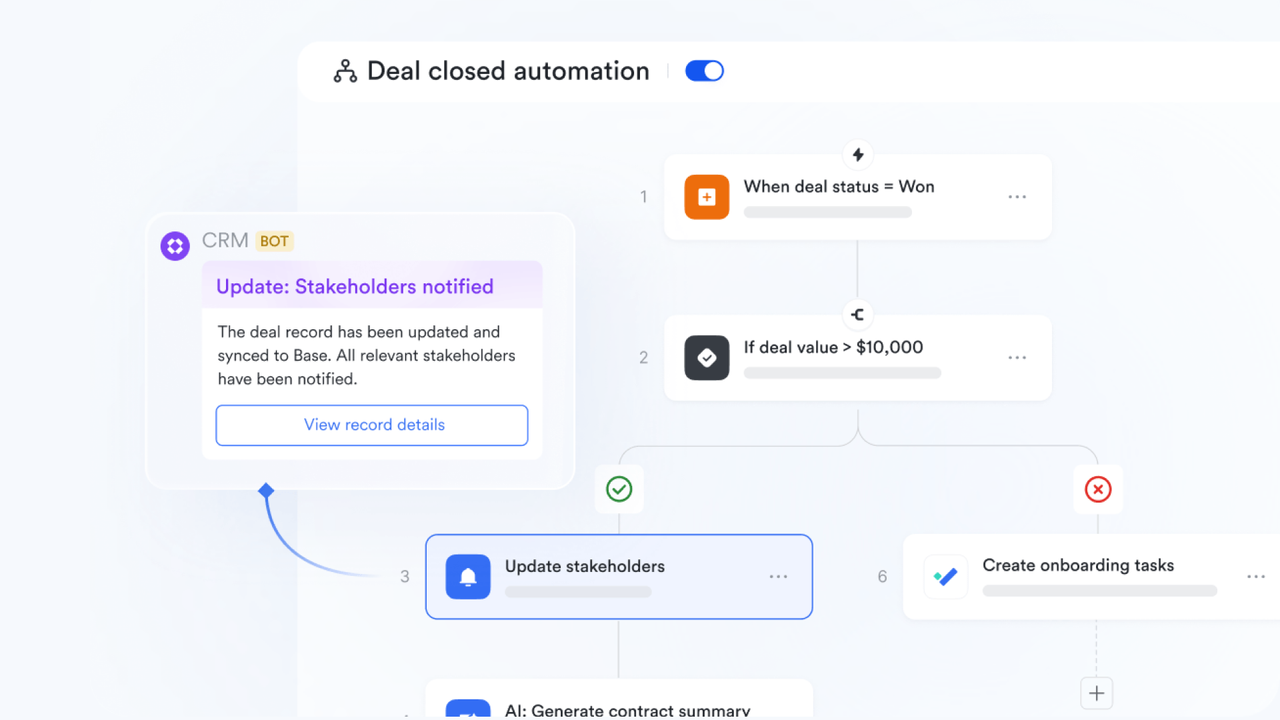
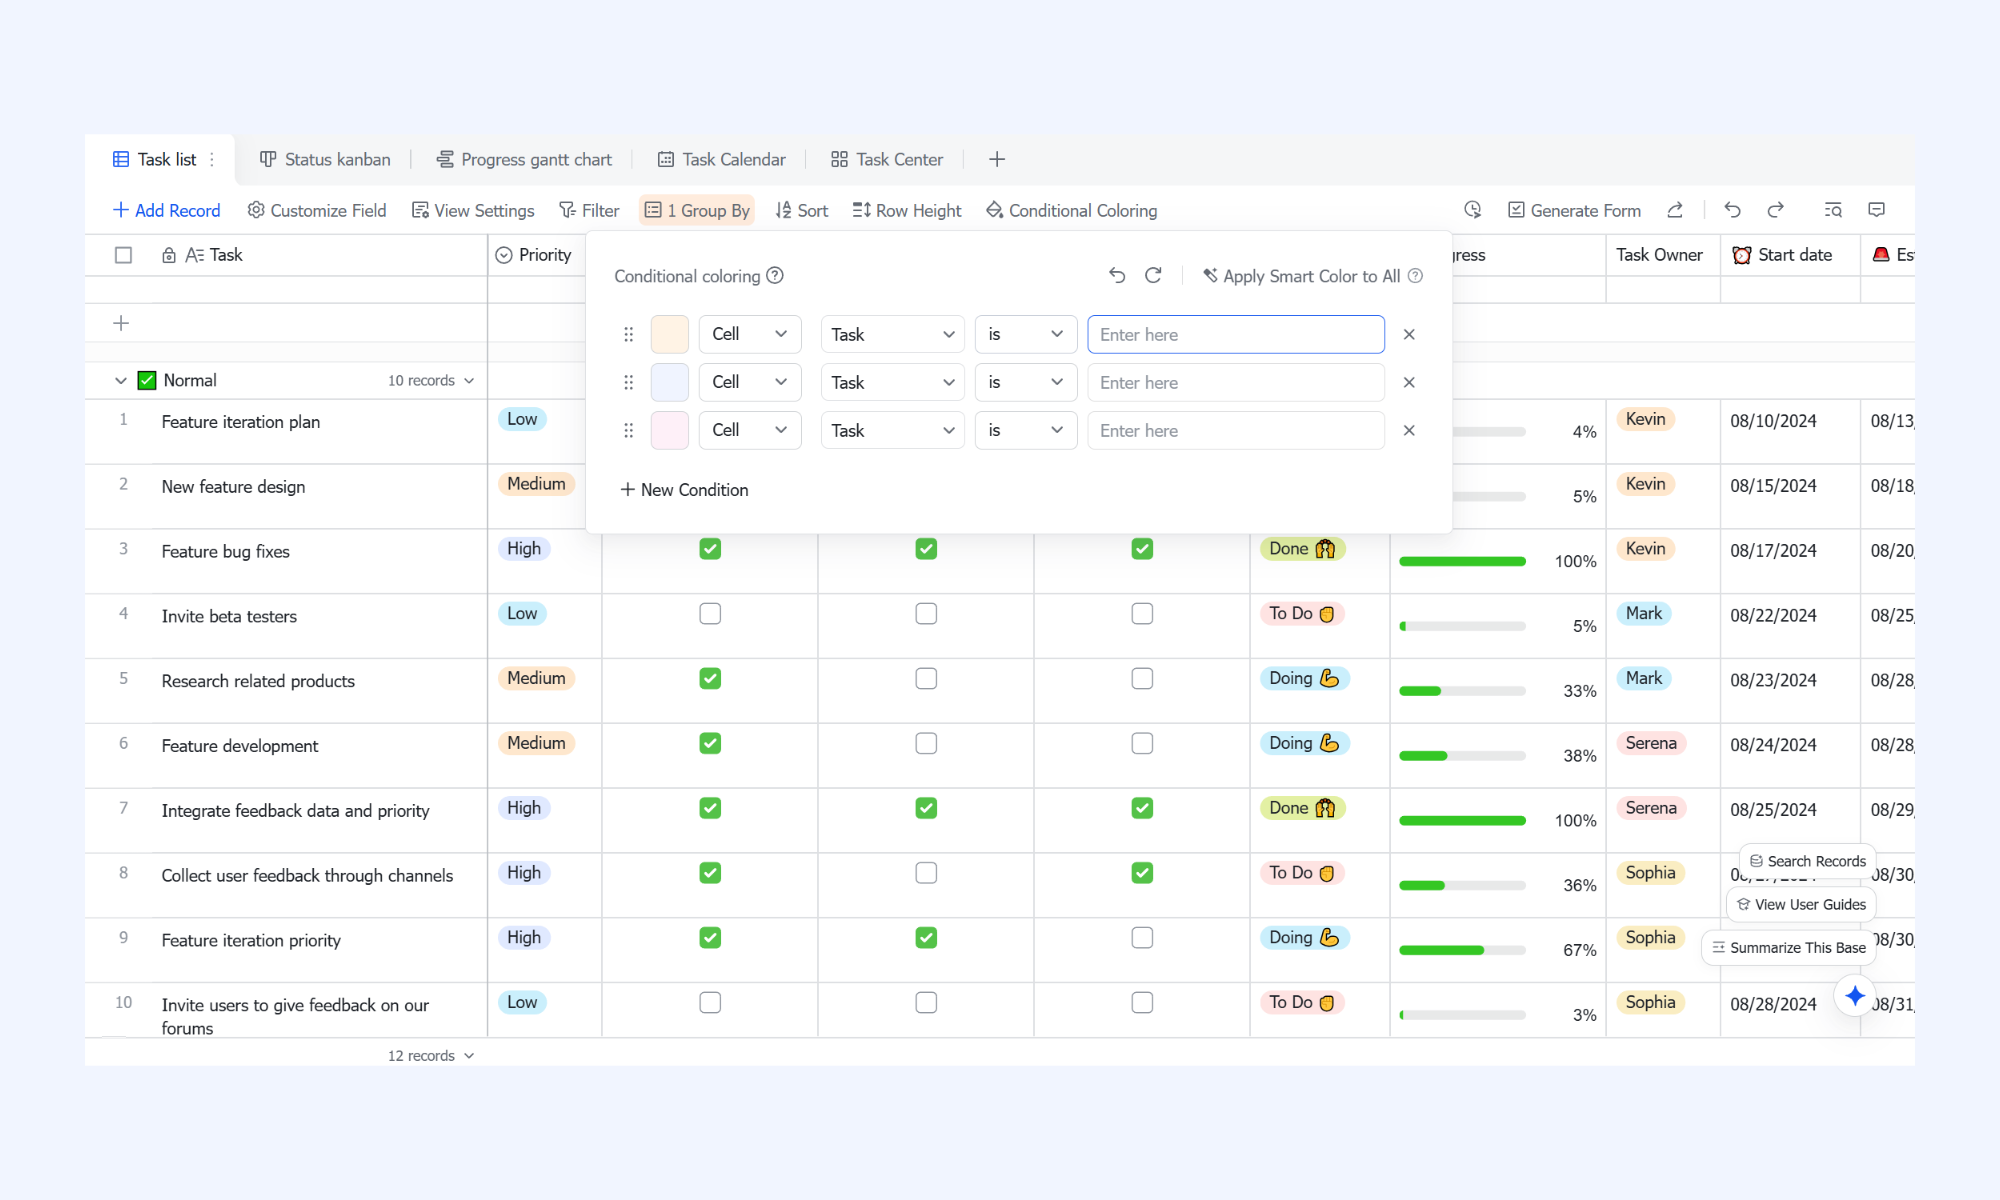
Conditional coloring
Conditional coloring is a powerful visualization tool for identifying bottlenecks in your . By setting custom rules, you can automatically highlight rows or specific fields with distinct colors when they meet certain criteria, such as a task being "In Progress" for more than five days. This turns your database into a heat map, allowing managers to see at a glance where the workflow has stalled.
Tasks assignment
Lark Tasks dependencies enforce the sequential logic of your flowchart by linking related actions. You can set tasks as "Blocked by" or "Blocking" others, ensuring that "Step B" cannot be started until the assignee for "Step A" marks their work as finished. This hierarchy prevents team members from skipping steps, maintaining the integrity of your and ensuring all prerequisites are met. 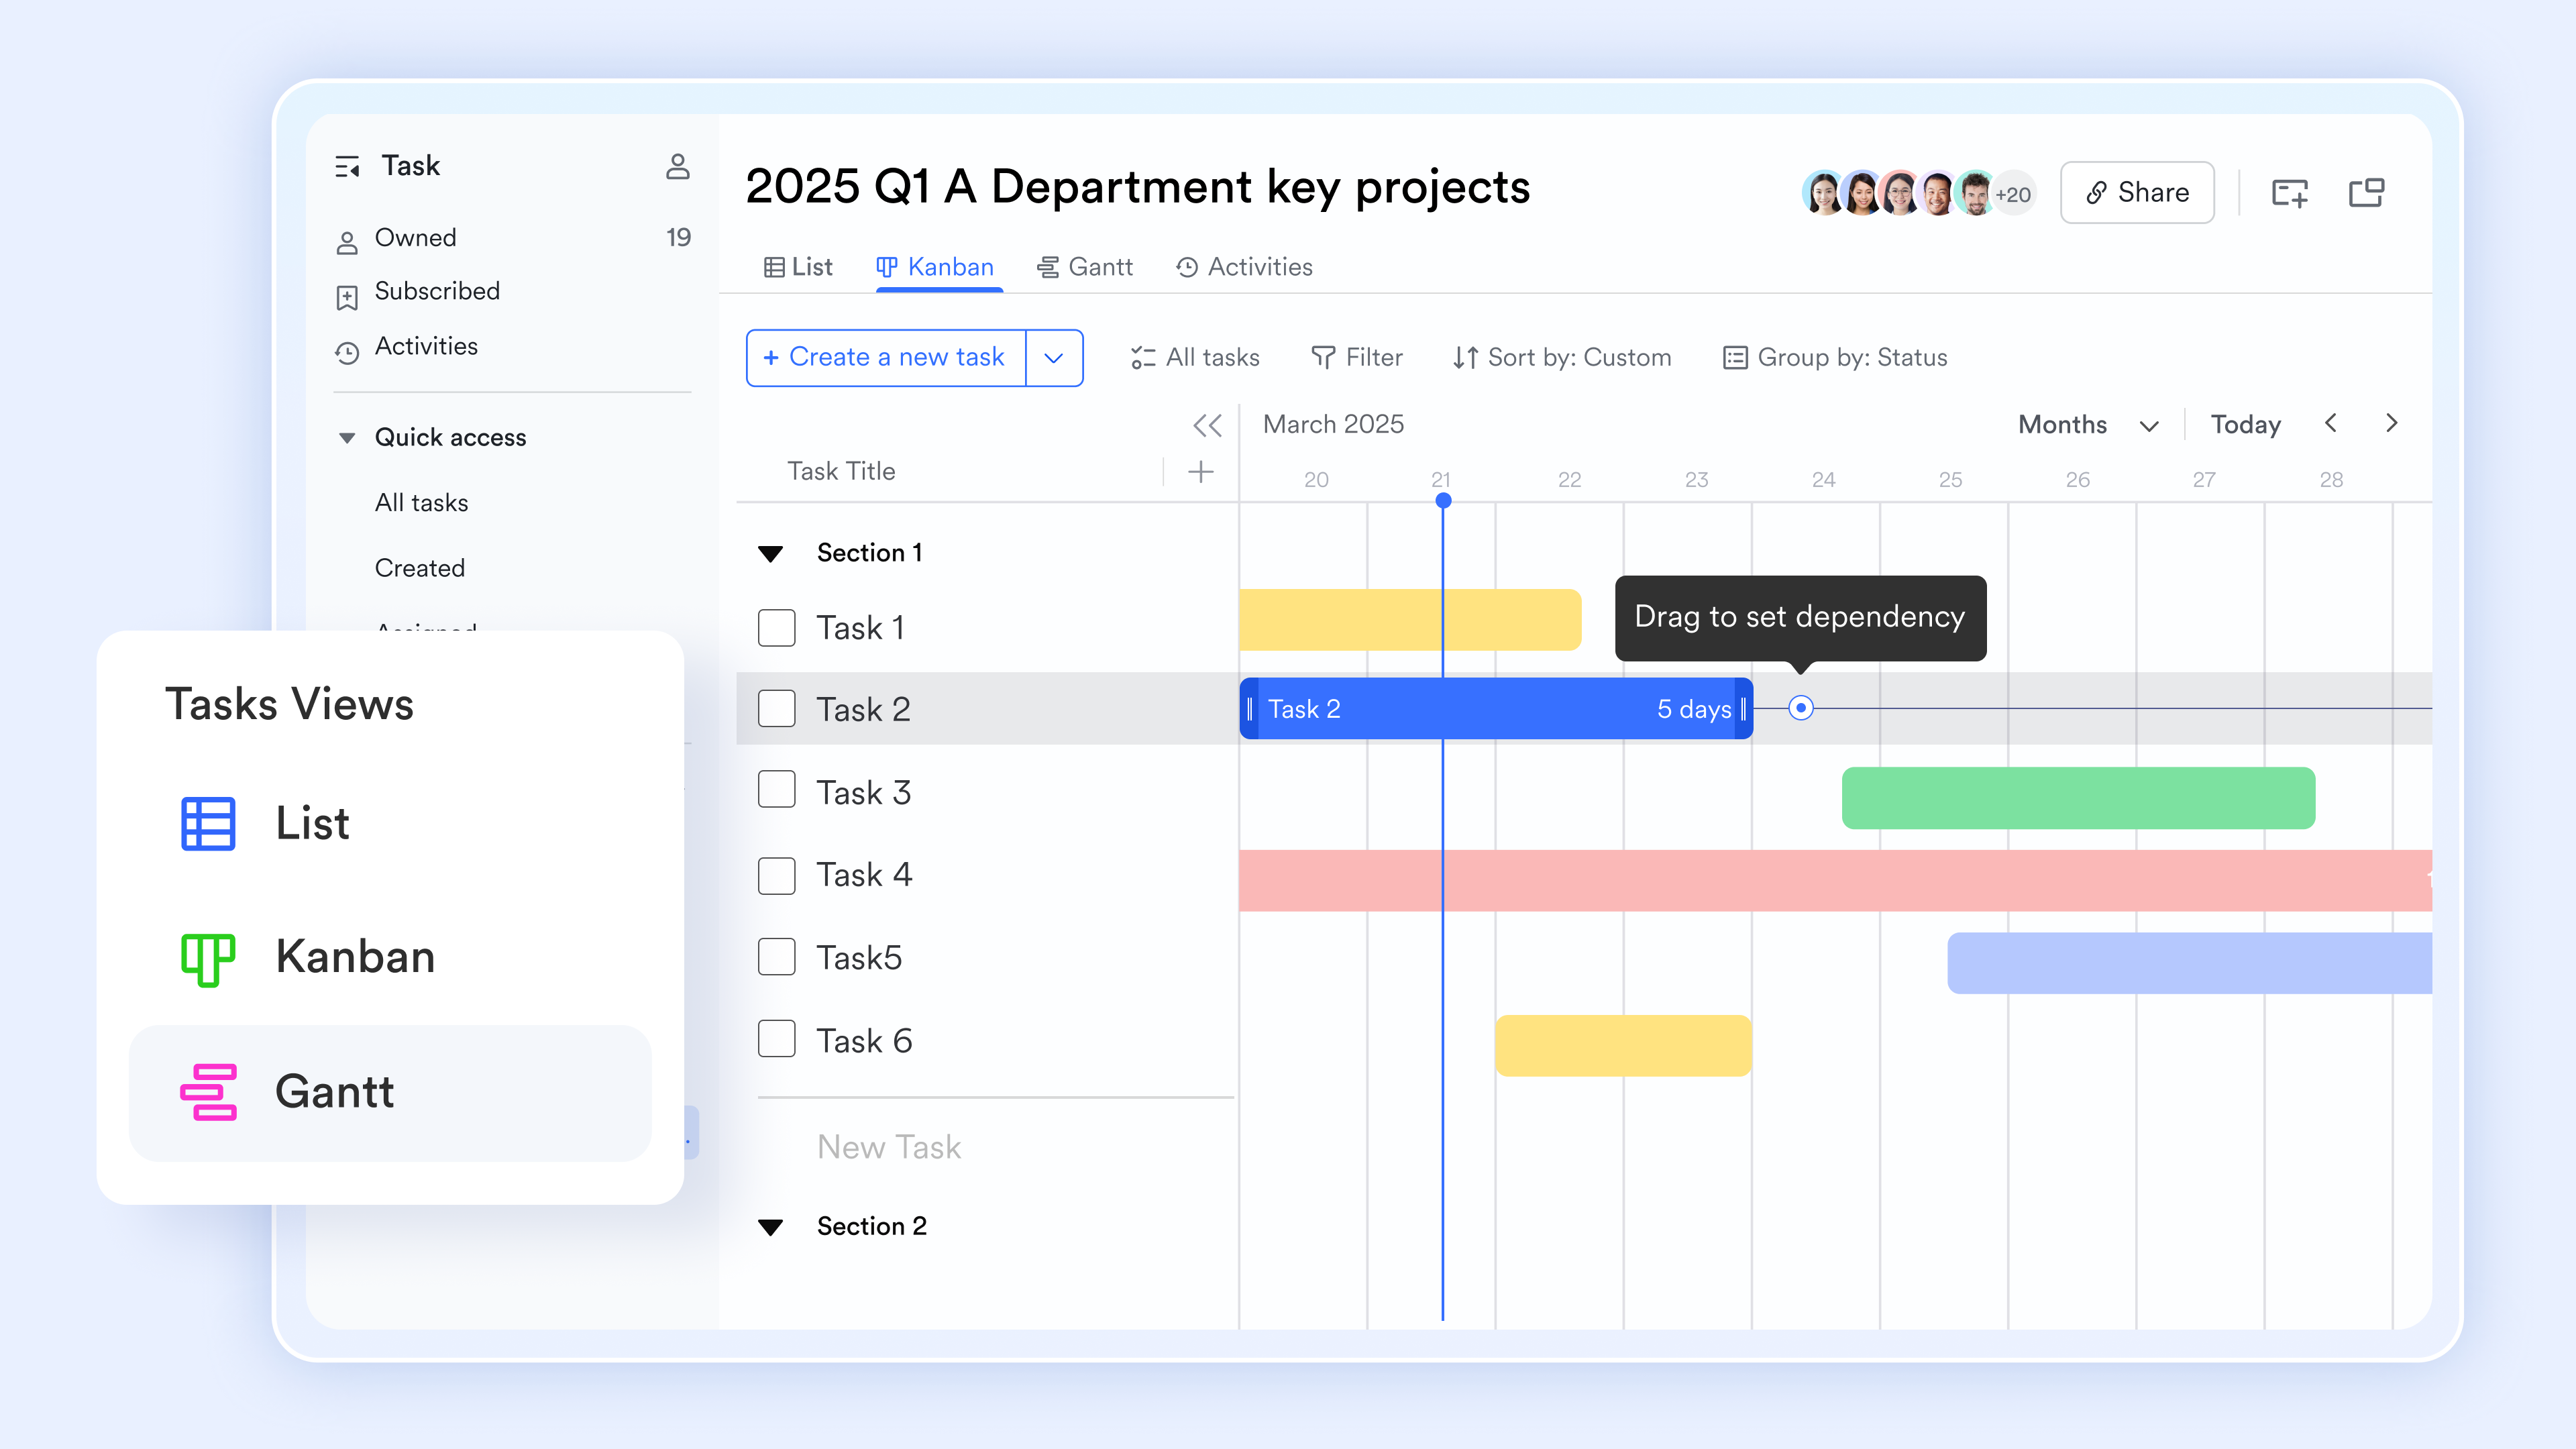
Multi-level approval workflows
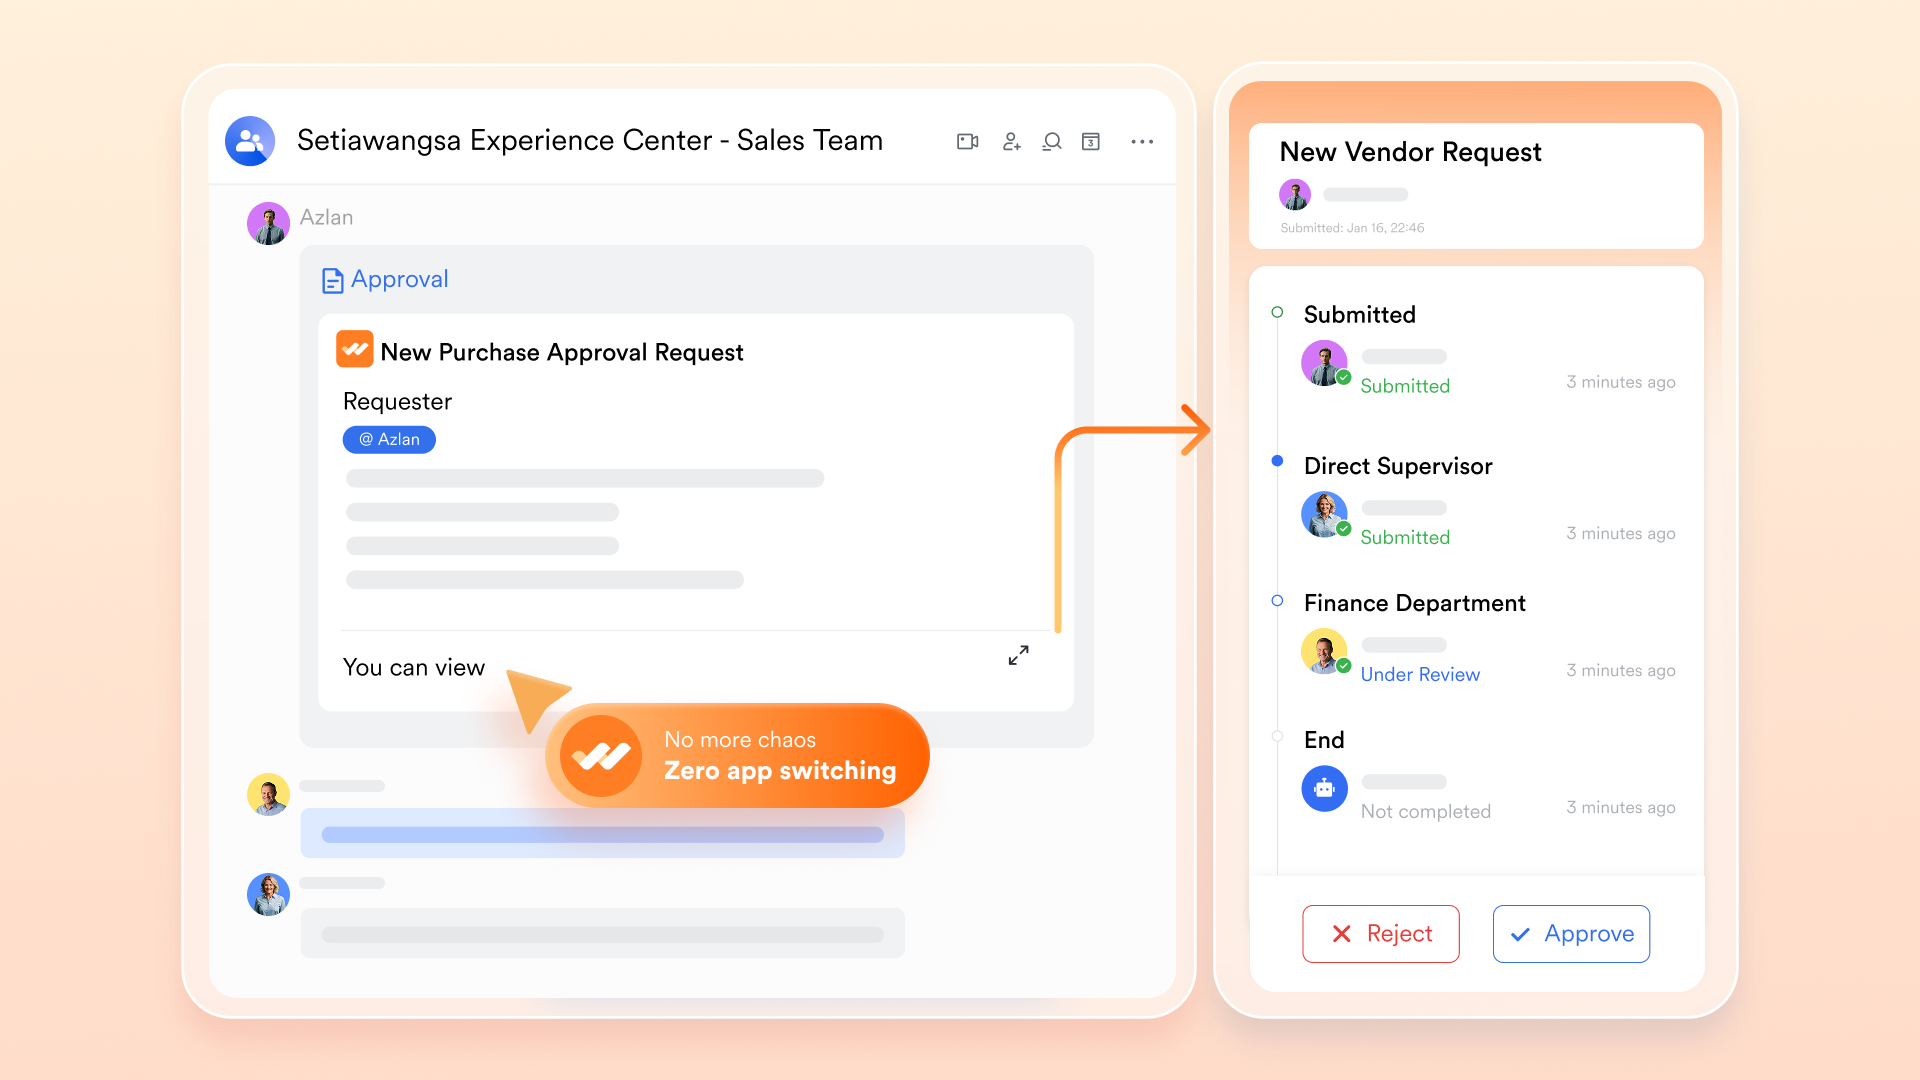
allows you to digitize complex "Decision diamonds" from your flowchart through branching logic. You can design multi-level paths in which a request is routed based on specific variables, such as department, budget, or priority level. This ensures that every high-stakes decision follows a standardized compliance path, with sent to stakeholders to prevent the approval process from becoming a bottleneck.
:
- Starter plan: Free forever plan that includes 11 powerful tools for up to 20 users. It also includes 100GB of storage, 1000 automation runs, AI translation, and more.
- Pro plan: $12/user/month (billed annually) for up to 500 users. It includes everything in Starter plus group calling for up to 500 attendees, 15TB of storage, 50,000 automation runs, and more.
- Enterprise plan: for custom pricing. Supports unlimited users and includes even more automation runs and advanced security, compliance, and management features.
For small teams with simple communication needs

18 months message history
1000 Base automation runs/month
2000 rows per table in Base
Most POPULAR
For companies with comprehensive collaboration and management needs
Unlimited message history
500-participant video meetings
50k Base automation runs/month
20k rows per table in Base
For large companies with advanced security and organizational management needs
Get a personalized demo and pricing
Unlimited message history
500-participant video meetings
15 TB storage + 30 GB storage/user
500k Base automation runs/month
50k Base automation runs/month
Most POPULAR
For companies with comprehensive collaboration and management needs
Unlimited message history
500-participant video meetings
50k Base automation runs/month
20k rows per table in Base
What are the rules for flowchart design?
Clear rules make sure a flowchart is easy to understand, share, and update over time. Following a few proven helps your diagram stay useful for both beginners and experienced teams.
- Start with a clear purpose: Define what the chart is meant to explain before you begin drawing. This keeps flow chart examples focused on solving a real problem rather than becoming a collection of random steps.
- Use standard symbols consistently: Stick to recognized shapes for actions, decisions, and start/end points across the entire diagram. This consistency improves readability, especially in examples.
- Keep the flow direction logical: Choose a single direction, such as top-to-bottom or left-to-right, and follow it throughout. A steady path helps users quickly scan and understand even complex work flow chart examples.
- Limit text and avoid clutter: Use short, clear labels instead of long descriptions inside each shape. Clean design makes simple flow chart examples more approachable and easier to remember.
- Test the chart with real users: Walk through the steps with someone unfamiliar with the process to spot confusion or gaps. Feedback helps refine decision flow chart examples, so every branch leads to a clear outcome.
Common mistakes to avoid in flow charts
Even well-intentioned flow charts can lose their impact if common design mistakes creep in. Avoiding these issues helps your diagrams stay clear, practical, and easy for teams to follow and apply.
- Overcomplicating diagrams: Adding too many steps, symbols, or colors can overwhelm readers and hide the main message. Studying helps you focus on clarity and keep only what truly supports the process.
- Unclear decision logic: Decision points that lack clear "yes" or "no" outcomes create confusion and slow down execution. Reviewing mermaid flow chart examples can show how clean, text-based branching improves logical flow.
- Missing owners or outcomes: When it's unclear who is responsible for a step or what the final result should be, accountability suffers. Well-labeled energy flow chart examples demonstrate how defining inputs, outputs, and roles and actionable.
Conclusion
Flow charts are more than just diagrams—they are powerful tools for turning complex ideas into clear, actionable paths that teams can follow with confidence. From simple process maps and decision trees to data-driven and system-level diagrams, the right flow chart helps align people, , and reduce costly misunderstandings. By choosing the appropriate type, following strong design principles, and avoiding common mistakes, you can create visuals that truly support daily work rather than just document it.
If you're ready to move beyond static flow chart examples and bring your processes to life, gives you the tools to do exactly that. With built-in automation, task dependencies, collaborative docs, and approval workflows, Lark helps transform your visual plans into real, working systems. Start building smarter, connected workflows today and see how clarity can drive better results across your entire team.
Create and manage workflows in one workspace with Lark
FAQs
What is the best flow chart example for beginners?
For beginners, simple step-by-step diagrams that show a clear start, a few actions, and an end are the easiest to follow. Basic data flow chart examples are especially helpful because they visually explain how information moves through a system without adding too much complexity. With Lark, teams can recreate these simple charts and gradually turn them into automated, real-world workflows as confidence grows.
What's the difference between a process flow chart and a workflow flow chart?
A process flow chart focuses on the sequence of tasks, while a workflow flow chart highlights who performs each step and how work moves between roles. Many flow chart examples combine both views to show tasks and responsibilities together. Using Lark, you can map these relationships visually and then assign tasks directly to the right people in one workspace.
Can flow charts be used in project management?
Yes, flow charts are widely used to plan timelines, manage dependencies, and track progress across different project phases. They help teams visualize risks, approvals, and deliverables before work begins. With Lark, these diagrams can be connected to live tasks, reminders, and approvals, so planning turns into coordinated action.
Are flow charts still useful for modern teams?
Flow charts remain highly relevant because modern work often involves remote teams, , and fast-changing processes. Visualizing how work and decision flow helps reduce miscommunication and delays. Lark enhances this by allowing teams to collaborate on charts in real time and convert them into automated workflows that adapt as the organization evolves.
Related reading












