


Program Flow Chart: Create Visual Workflows Easily

Matthew Sia
Product Marketing Manager
Aug 5, 2026
Matthew Sia
Aug 5, 2026

12 min read


A program flow chart is a visual roadmap that shows how software runs step by step. In modern software development, it is still widely used for algorithm design, logic debugging, and explaining complex processes across teams.
This article introduces flowcharts in programming and software design, as well as their use in business processes and system architecture. Understanding flowcharts helps software engineers, product managers, and programming students improve logical thinking and communication. In this guide, you will learn flowchart definitions, standard symbols, types, and examples. We also cover how Lark supports collaborative diagramming and documentation for distributed teams.
What is a program flow chart?
A program flow chart is a structured diagram that uses standardized symbols and connecting arrows to clearly show the logical sequence, decision-making steps, and control flow of a computer program or algorithm. It transforms abstract code and complex logic into an intuitive visual representation, illustrating how a system processes input, performs operations, makes decisions, runs loops, handles data, and produces output step by step.
Unlike general flowcharts used in business or daily workflows, program flowcharts focus specifically on the internal execution mechanism of software, including key control structures such as sequential operations, conditional branches (if-else), iterative loops, and data processing.
This visual tool is widely used by software engineers, developers, QA testers, and product managers to design, analyze, document, and communicate program logic. It helps technical teams plan and debug algorithms before coding, and allows non‑technical stakeholders to understand system behavior without reading raw code.
Even with modern IDEs and visual debugging tools, program flow charts still play an important role in early design, team collaboration, knowledge transfer, and long-term technical documentation.
History and evolution of flow charts in programming
The idea of visual process mapping existed long before computers, but its adaptation to programming has shaped how algorithms are designed and taught.
Process charts first appeared in the 1920s, created by industrial engineers Frank and Lillian Gilbreth to improve factory workflows, establishing the basic symbol system that later influenced computing. Flowcharts were formally applied to computer programming in the 1940s and 1950s by Herman Goldstine and John von Neumann for the early ENIAC computer. At that time, they were essential for planning logic on paper before coding on costly mainframes and punch‑card systems.
In the 1960s and 1970s, flowcharts became a standard part of programming education, supporting the rise of structured programming. They gradually evolved from hand‑drawn diagrams to digital tools with drag‑and‑drop interfaces and collaborative features. Today, lightweight flowcharts continue to be used in agile and DevOps workflows, helping teams plan, communicate, and document efficiently during rapid development cycles.
Core symbols used in a flow chart of program logic
Standard shapes make a software flow chart easy to read across different teams, tools, and organizations. Consistency in symbol usage ensures that anyone familiar with flowcharting conventions can pick up a diagram and understand it immediately, regardless of the specific software or business context. These core symbols align with widely accepted standards such as those defined by ANSI and ISO, and each serves a specific purpose—using them correctly creates clear, professional diagrams.
- Terminator symbol (oval or rounded rectangle): Marks the start and end points of a flowchart, typically labeled "start" or "end." This symbol defines the boundaries of the process being documented. Every program flowchart should have exactly one start point, though complex programs may have multiple end points representing different possible outcomes.
- Process symbol (rectangle): Represents a computational step or action, such as a calculation, variable assignment, or any operation that transforms data. Labels inside the rectangles are specific and verb-based, clearly indicating the action being performed—examples include "calculate total" or "increment counter."
- Decision symbol (diamond): Takes the form of a diamond and represents a branching point where the flow continues in different directions based on a condition. Labels inside the diamond pose a yes-or-no question, such as "is user authenticated?" or "is count > 10?" Two arrows exit the diamond, each labeled with the corresponding outcome (yes/no or true/false). Decision points are central to representing if-else logic and loop conditions in a program.
- Input/output symbol (parallelogram): Used to indicate data entry or output operations, covering actions like reading user inputs, displaying results, or writing to files. Examples of labels for this symbol include "get username" or "print report." Understanding these input/output operations helps trace how data flows through a program from start to finish.
- Connectors: Come in two varieties to help organize complex flowcharts. The on-page connector, typically a small circle, links different parts of a flowchart on the same page without drawing long, confusing arrows. The off-page connector, often shown as a pentagon, indicates that the flow continues on another page—both help avoid tangled lines or overly large diagrams.
- Flow lines (arrows): Indicate the direction of process flow. By convention, flow continues from top to bottom and left to right unless arrows indicate otherwise. Maintaining consistent arrow direction makes diagrams intuitive to follow, even for complex program logic.
Understanding these common flowchart symbols expands your ability to create detailed flowchart diagrams that accurately capture complex program processes.
Types of program flowcharts and system flowcharts
Not all diagrams in software engineering serve the same purpose. Understanding the distinction between program flowcharts and system flowcharts helps teams choose the right tool and communicate effectively about their software.
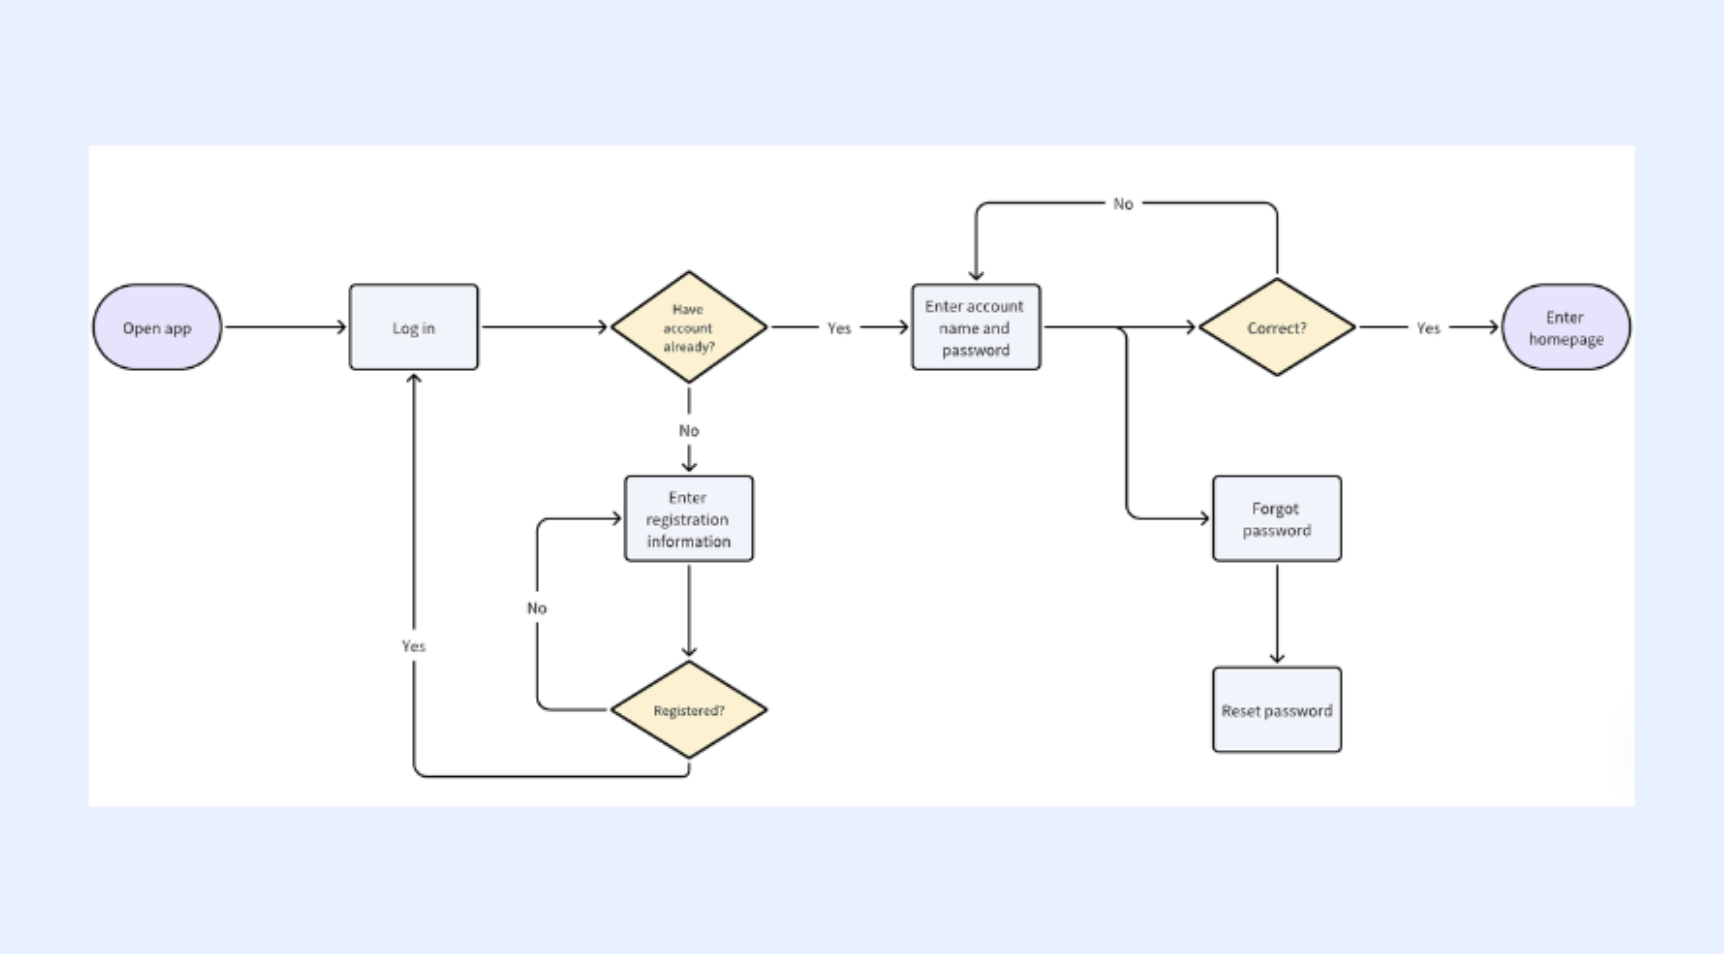
- Program flowcharts in computer programming: Program flowcharts focus on the internal logic of a single program, function, or algorithm, showing control flow, data movement through processing steps, decision points, and loops. They visualize the three core control structures: sequence, selection (if-else), and iteration (loops). Common examples include sorting algorithms, input validation, error handling, and API request processing. A typical structure starts with a start symbol, followed by initialization, input, decision branches, loops, output, and an end symbol—for instance, a login routine that checks credentials, handles retries, and redirects or locks accounts.
- System flowcharts in software and IT environments: System flowcharts, by contrast, describe interactions among multiple programs, databases, services, and external entities, providing a holistic view of how components work together. Examples include online banking systems, HR management tools, and internal ticketing systems. They use specific symbols like cylinders (databases), double-sided rectangles (external entities), and trapezoids (manual processes) to illustrate integration points and dependencies.
- Other diagram types related to flow charts in programming: Other related diagram types include data flow diagrams (DFDs), which focus on data movement and transformation rather than control flow; UML activity diagrams (for user journeys and concurrent activities); sequence diagrams (for service interactions over time); and state machine diagrams (for entity state transitions). Combining these with flowcharts provides a complete view of software behavior for complex projects.
How to design a clear flow chart in programming
Good design makes the difference between a helpful programming flowchart and a confusing one. A well-structured chart communicates logic clearly, while a poorly designed one can introduce more confusion than it resolves. Below is a practical, step-by-step guide to creating robust, readable flowcharts—suitable for learners and experienced professionals alike—with a focus on clarity, collaboration, and best practices.
Clarifying the objective and scope
Every programming flowchart should start with a clear, specific goal. Write a one-sentence purpose statement (e.g., "This flowchart documents the password reset process from user request to confirmation email") to guide what to include. Avoid overly broad scopes (such as "the entire user lifecycle"), which make diagrams unwieldy. For large workflows, use a modular approach: create one high-level system flowchart to show overall component interactions, and separate program flowcharts to detail the internal logic of individual parts. For example, an e-commerce checkout process might have a system flowchart for how the cart, payment gateway, and inventory system interact, plus separate program flowcharts for cart calculations and payment validation.
Translating logic into steps before drawing
Before adding any symbols, outline the flow in plain English or pseudocode. This text-based approach helps you identify decision points, loops, and error paths early, without getting distracted by visual design. List inputs, key processes, outputs, and potential issues explicitly. For instance, a password reset flow might be outlined as: 1) User requests reset, 2) System validates email format, 3) System checks if email exists in the database, 4) Generate token and send reset email (if email exists) or show a generic message (if not), 5) End process. This outline reveals critical decision points and ensures non-technical teammates can review the logic before you draw the final diagram.
Applying standard flowchart rules and conventions
Stick to standard rules to ensure readability across teams. Flow should move consistently from top to bottom and left to right. Most flowcharts should have one entry point (start symbol) and one main exit point (end symbol). Use connectors (on-page for same-page links, off-page for multi-page flows) to avoid tangled, long arrows. Keep symbol usage consistent, and label shapes clearly: decision diamonds should contain specific questions (e.g., "Is the token valid?"), process rectangles should use verb-based descriptions (e.g., "Calculate discount"), and branches should be labeled with outcomes (Yes/No) when context isn't obvious.
Documenting edge cases and error handling
A robust flowchart must cover not just the "happy path" (successful execution) but also edge cases, errors, and exceptions. This includes scenarios like invalid input formats, API call failures (timeouts, server errors), expired authentication tokens, and network issues. Present error-handling flows as clearly labeled side branches or use annotations to explain complex policies (e.g., "Retry API calls up to 3 times with exponential backoff") without cluttering the main flow. After production incidents, update flowcharts to include newly identified edge cases—this prevents future oversights and serves as valuable documentation for quality control.

Collaborative flowcharts: Turning static diagrams into living documents
Creating clear and accurate program flowcharts is essential for software development, system design, and process optimization. Lark elevates this task from a solitary drawing exercise into a dynamic, team-based activity. By unifying powerful diagramming tools directly into its collaborative workspace, Lark ensures your flowcharts are not just visuals, but actionable blueprints that drive understanding and alignment across your entire team.

Start fast with professional templates for program logic
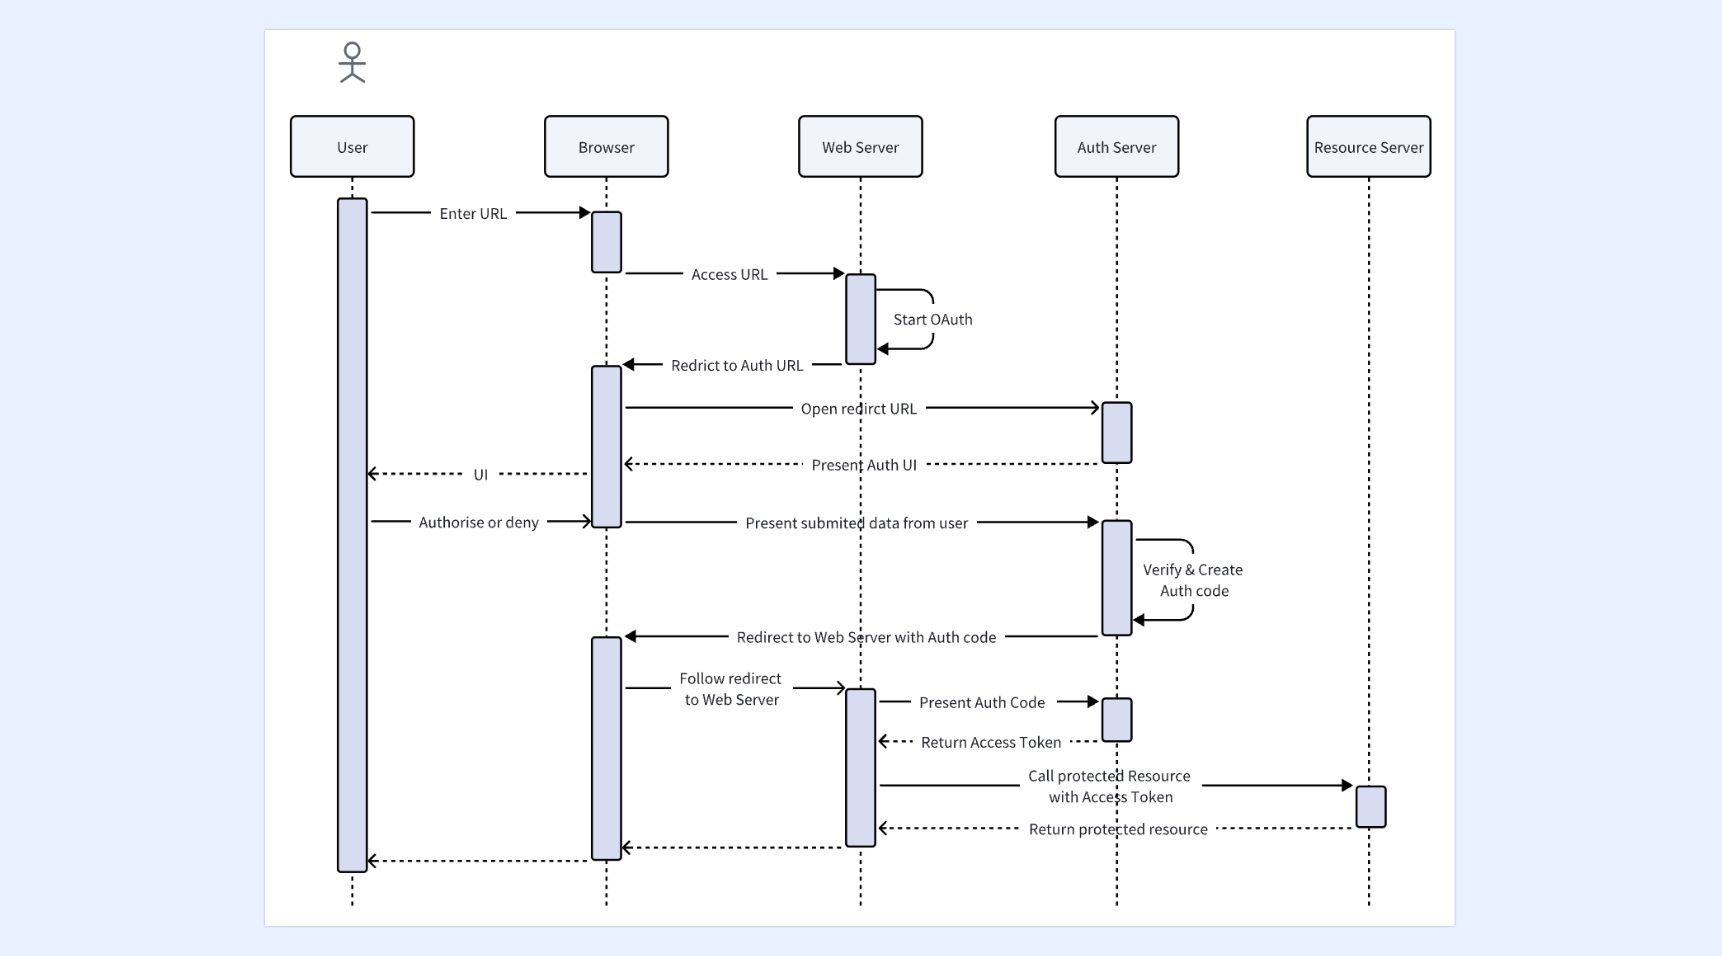
Starting a program flowchart from a completely blank canvas can feel overwhelming and inefficient. Lark solves this problem with its built-in template gallery. Whether you need a simple linear flowchart or a complex UML sequence diagram showing how multiple systems interact, you can find a ready-made starting point in Lark Board template library. For example, when planning a new module, a team can directly use the flowchart template to map out basic steps. When designing system interactions, they can use the UML sequence diagram template to clearly show how components communicate. These templates provide professional frameworks and ensure your diagrams follow proper notation standards. Most importantly, they let your team focus on the logic itself instead of spending time drawing shapes from scratch, speeding up the journey from idea to visualization.
Turn flowcharts into a team collaboration effort
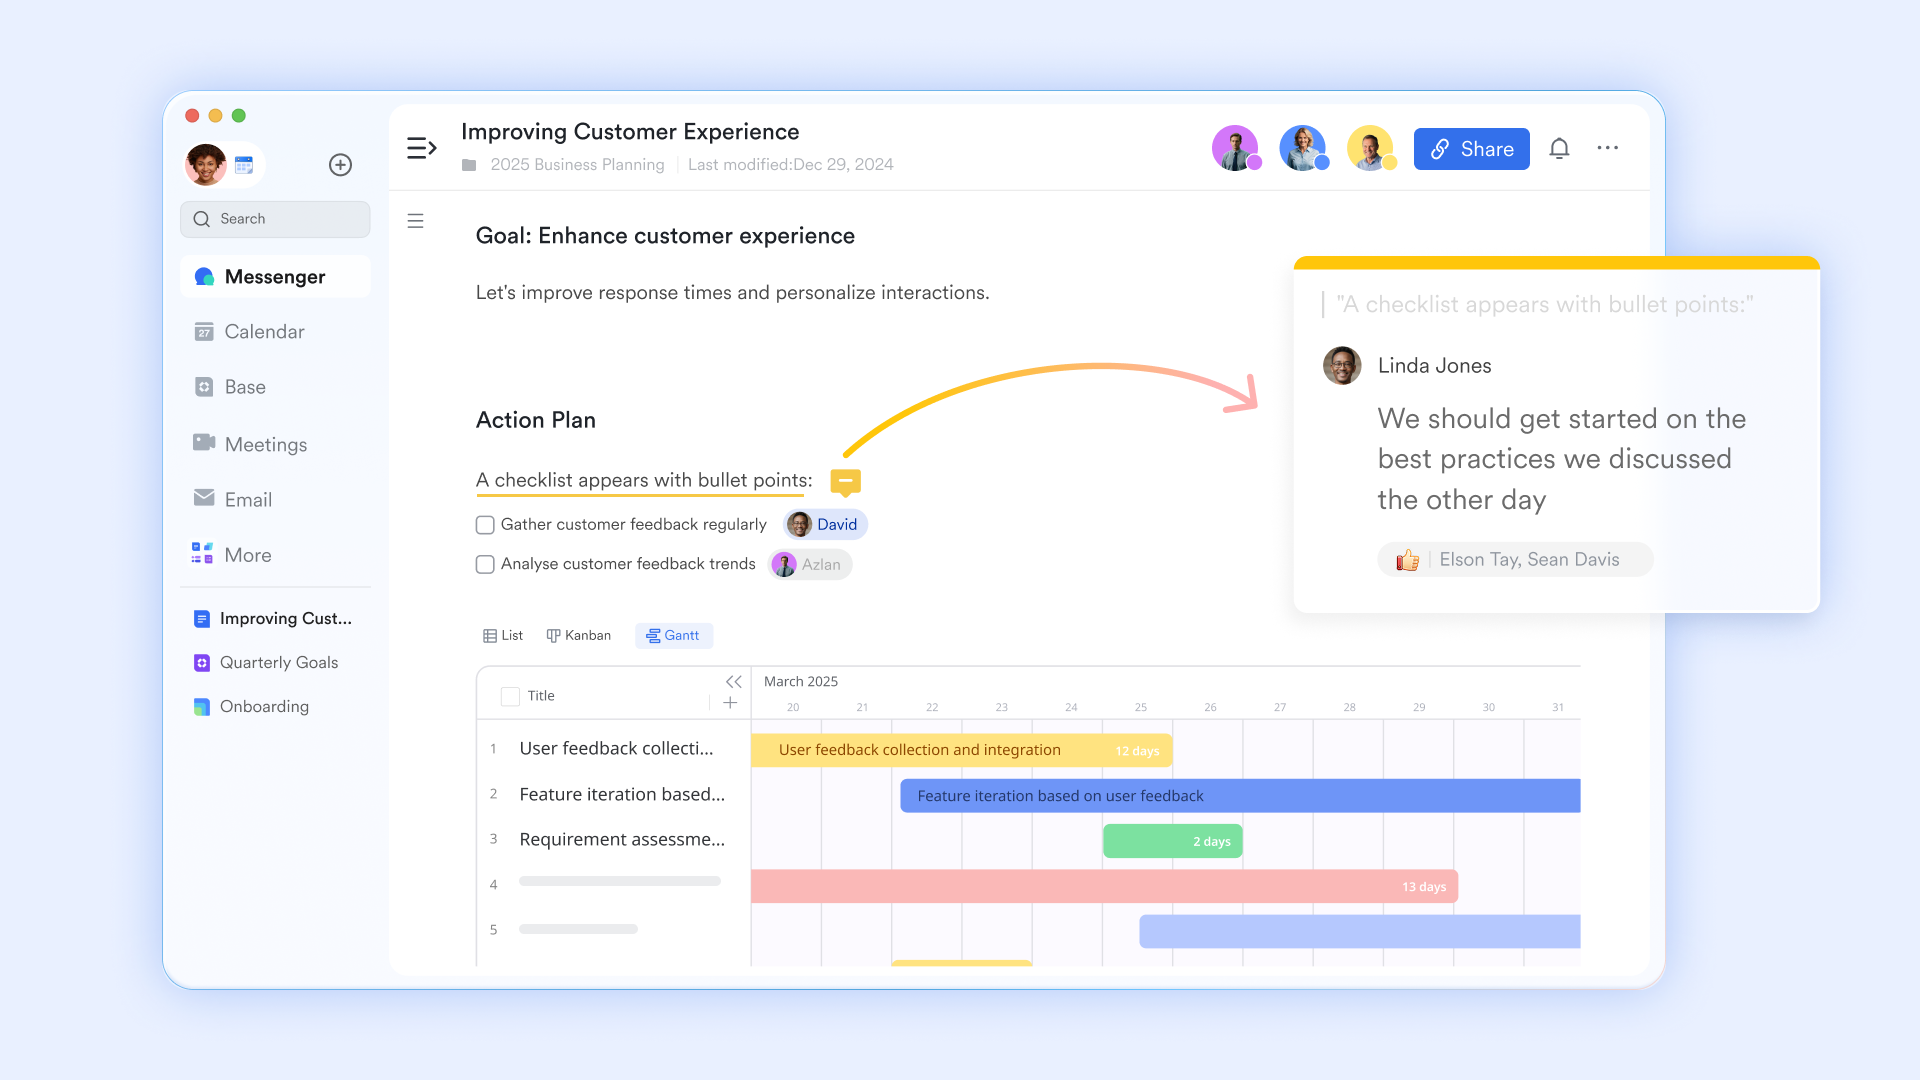
In traditional tools, one person usually creates a flowchart alone and then shares it with the team for review via email or documents. This leads to scattered feedback and version confusion. Lark Board changes this completely by allowing multiple team members to collaboratively edit the same flowchart in real time. When a developer creates a program flowchart in Lark Docs, product managers and testers can view it simultaneously, add comments, and even make edits directly using the drawing tools. This real-time, multi-user experience means everyone involved—from the PM defining requirements to the backend engineer designing architecture to the QA verifying test scenarios—can contribute ideas and clarify questions on the same canvas. All discussions happen right next to the diagram itself, keeping context clear and communication efficient.
Refine flowcharts through dynamic discussions
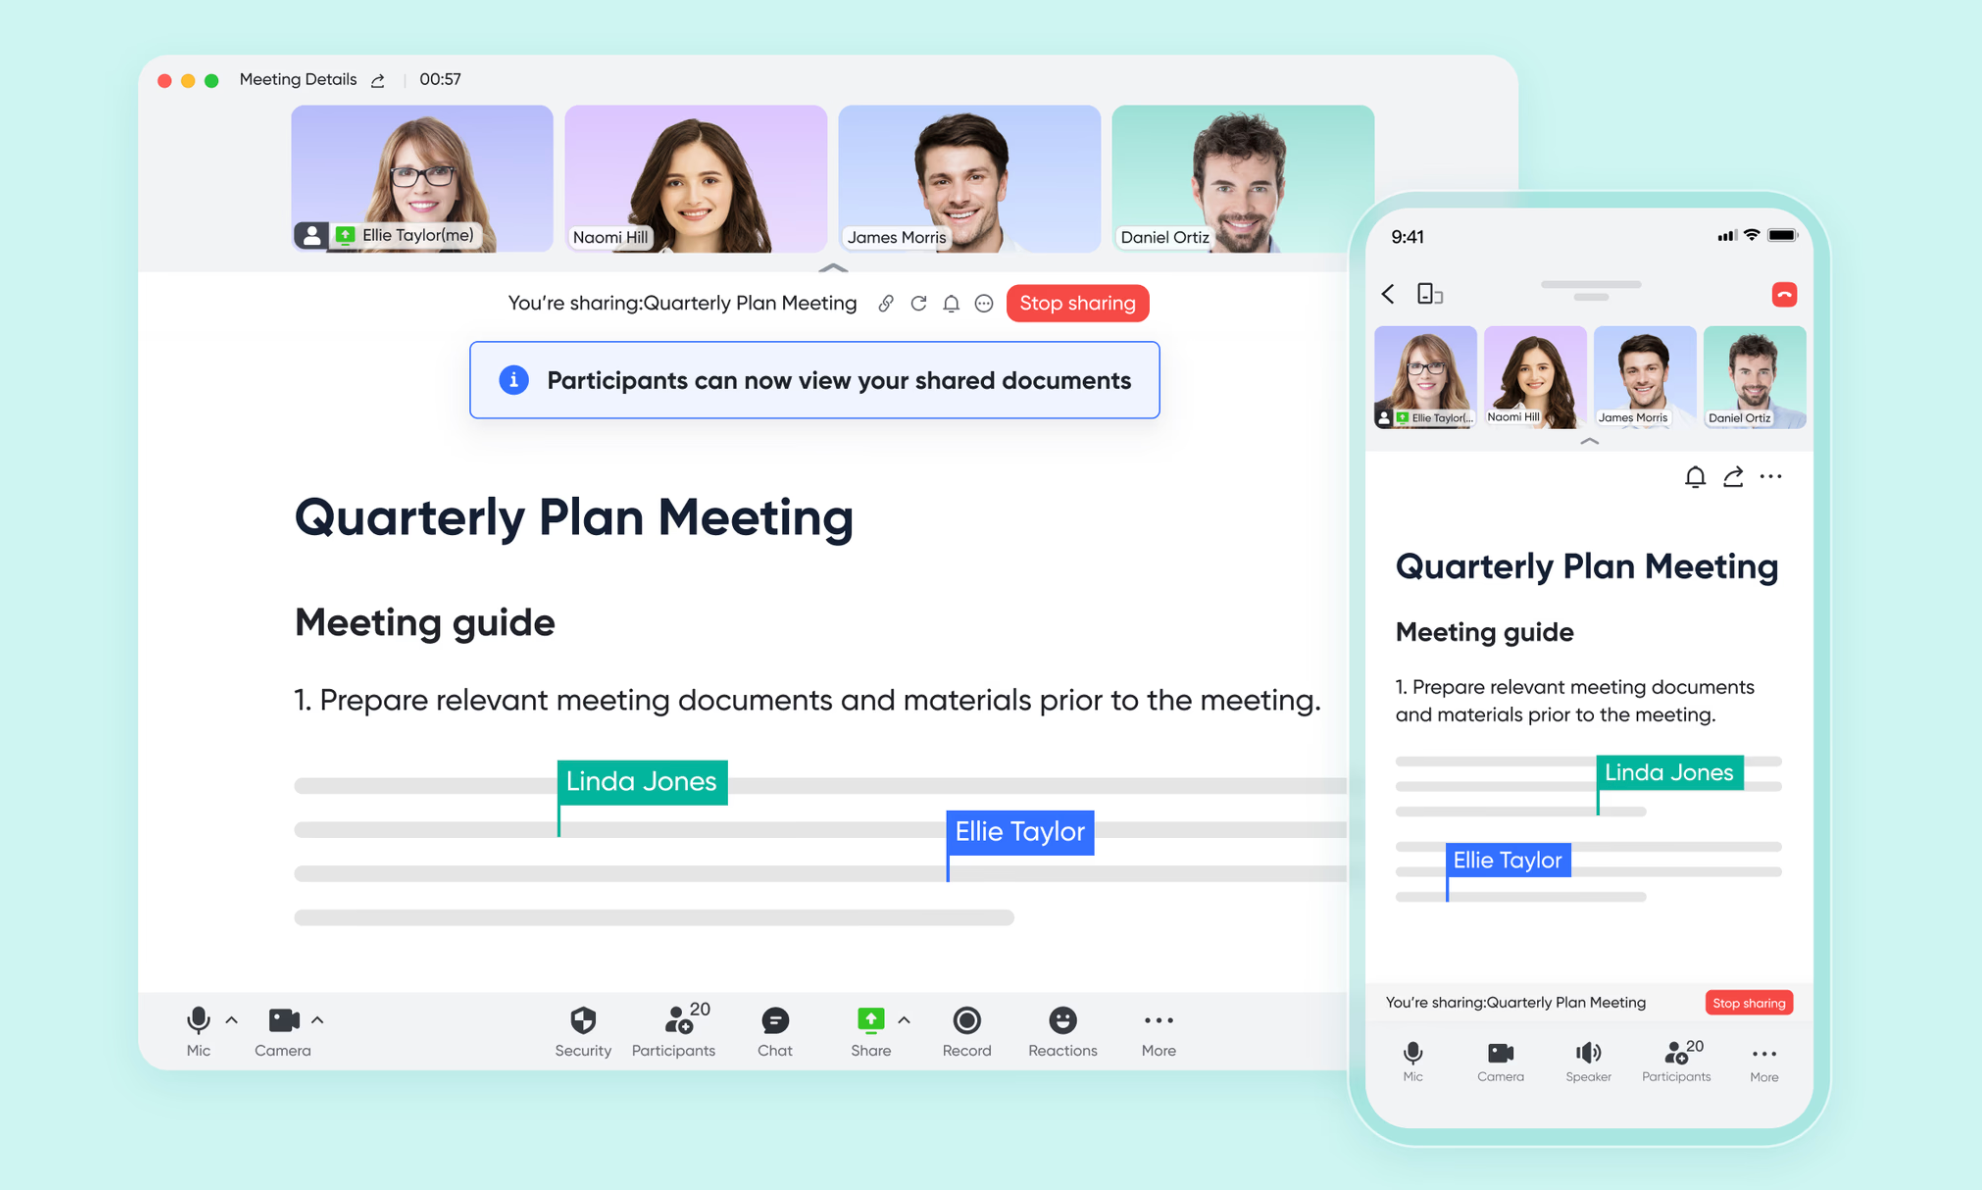
A program flowchart's real value comes when the team can understand, discuss, and use it to guide development. Lark deeply unifies flowcharts into your team's daily communication flow. During a meeting, the host can share the document with Magic Share or Board containing the flowchart with one click. Everyone can see the flowchart in real time and use whiteboard tools to draw, highlight, and annotate directly on it. This makes reviewing program logic intuitive and efficient. For example, during a code review or design meeting, the team can mark potential performance bottlenecks right on a sequence diagram or write optimization suggestions next to a decision node. These discussions happen in real time, with all annotations saved alongside the flowchart for future reference.
Build dedicated knowledge spaces for every project
In Lark Wiki, you can create a dedicated knowledge space for each software project or system module. This space is more than just a repository for flowcharts; it's a central hub for all related documentation. You can organize program flowcharts, detailed design documents, API specifications, technical guidelines, and more in one place, creating a complete knowledge base for the project. When new members join the team, they can quickly access the relevant project space and find all the information they need at once, dramatically reducing onboarding time.
Best practices for software flow charts and system diagrams
The following guidelines keep diagrams useful, readable, and maintainable, applying to both program flowcharts and system diagrams. Consistency, clear naming, version control, and regular reviews ensure diagrams effectively communicate complex logic to teams.
- Keeping diagrams simple and focused: Each flowchart should handle one specific responsibility—avoid cramming unrelated processes into one diagram. Use layering, modular designs, and sub-processes to manage complexity. Tailor detail levels to your audience (developers need more detail than executives). Periodically refactor large, overgrown flowcharts into smaller, focused ones as systems evolve.
- Using consistent naming and labeling: Labels should match naming in code, APIs, and databases for traceability. Use specific, clear labels (e.g., "CreateInvoice" instead of "Processing step") and establish team-wide naming conventions. Document these standards in a shared space to ensure consistency, improve searchability, and reduce confusion.
- Versioning and maintaining flowcharts: Update diagrams whenever business logic or architecture changes—outdated flowcharts mislead and erode trust. Track versions with date stamps, change logs, or collaboration tool history. Assign ownership to a team member (e.g., feature lead) to ensure updates happen, and review diagrams during release planning or retrospectives. Store diagrams with related specs for easy synchronization.
- Connecting flowcharts with testing and QA: QA teams can derive test cases directly from flowchart branches and decision paths, ensuring full coverage. Map flowchart paths to test IDs for traceability—this helps identify broken logic when tests fail. Diagrams also reveal gaps or redundancies in test coverage. Document this connection to support regression testing and align teams around a shared visual model.
Common examples of flow charts in computer programming
Concrete examples help make the abstract concept of programming flowcharts easier to understand. The following are common, realistic scenarios in modern software development, each described clearly enough to sketch by hand or in a diagram tool.
- Simple decision-making flowchart (if-else): This example uses basic if-else logic to decide whether a user qualifies for a discount based on membership status and cart value. The flowchart starts with input steps to get the user's membership and cart total, then checks if the user is a premium member. Premium users get a premium discount, while non‑premium users receive a standard discount only if their cart total is above a set threshold. All paths end with outputting the final discount value. This structure directly matches if-else statements in programming languages such as Java, Python, and C#.
- Loop and iteration flowchart (for and while): Summing items in a shopping cart is a typical example of loop logic. The flowchart begins by initializing the total and index values to zero. It then checks whether there are more items left to process. If not, it outputs the final total. If yes, it reads the current item's price, adds it to the total, increases the index, and loops back to the condition check. This pattern clearly shows how for-loops, while-loops, and foreach loops work in practice.
- Input validation and error-handling flowchart: A user sign‑up form with validation rules demonstrates sequential decision and error‑handling logic. The process starts with receiving user input, then validates email format, password strength, and required fields one by one. Any invalid entry triggers an error message and returns the user to the input step. Only when all checks pass does the system create the account, send a confirmation email, and complete the process successfully.
- Multi-step business workflow implemented in code: An expense approval workflow combines program logic and system interactions. It starts when an employee submits an expense report. The system checks the total amount: low-value reports are approved automatically, while higher amounts require manager review and notification. Managers can approve, reject, or ask for changes. Reports over a higher limit go to finance for final review, which updates the accounting system and processes reimbursement. Rejections at any stage send feedback to the submitter.
Conclusion
Program and system flowcharts remain powerful tools for clarity, quality, and team alignment in software development. They help communicate logic, prevent bugs during implementation, and onboard new team members faster by simplifying complex systems.
Centralizing diagrams, documentation, and conversations in tools like Lark keeps technical knowledge organized and accessible, turning flowcharts into living documentation rather than forgotten artifacts. Adopting consistent practices and modern collaboration tools improves how teams design and ship software—start with a flowchart for your next feature to accelerate understanding and delivery.
FAQs
What is a program flow chart?
A program flowchart is a visual diagram that shows the step-by-step logic and sequence of operations in a computer program or process. It uses standardized symbols like rectangles for processes, diamonds for decisions, and arrows to show flow direction. With Lark's collaborative whiteboard, you can create program flowcharts together with your team in real time, making complex logic easier to understand and communicate.
Can ChatGPT create flowcharts?
ChatGPT itself cannot directly generate visual flowcharts, but it can help you outline the logic, steps, and decision points you need to include. You can take that textual description and quickly build the actual flowchart using Lark Board's intuitive drawing tools and templates. This combination of AI assistance and visual collaboration makes creating professional flowcharts faster and easier.
What are the 4 types of flowcharts?
The four common types are: process flowcharts (showing basic steps), swimlane flowcharts (showing who does what), data flowcharts (showing how information moves), and program flowcharts (showing algorithm logic). Lark Board offers templates for all these types, so you can start with the right structure and customize it for your specific needs.
What are the 7 steps of a flowchart?
The seven steps typically include: define the process start and end points, list all activities in order, identify decision points, connect steps with arrows, assign responsibilities, review for completeness, and test with sample data. In Lark, you can work through these steps collaboratively, with team members adding comments and suggestions directly on the board as you build.
Related reading
Table of contents
Start using Lark today

Manage all your work in one place
Boost team efficiency by 10x
Save up to 70% on software costs
Table of contents
Start using Lark today
Manage all your work in one place
Boost team efficiency by 10x
Save up to 70% on software costs



2026 Lark Technologies Pte. Ltd.
Headquartered in Singapore with offices worldwide.






Explore: