














Mastering Visual Workflows for Peak Team Productivity

Matthew Sia
Product Marketing Manager
Sep 18, 2026
Matthew Sia
Sep 18, 2026

22 min read


A project can feel like a complex network of tasks. Deadlines are missed, responsibilities become blurred, and team members operate in isolation. Status update meetings consume valuable hours yet fail to create clarity. This chaos often stems from an invisible problem: a lack of process transparency. A powerful solution exists to make these processes clear and manageable. That solution is the implementation of a visual workflow.
A visual workflow transforms abstract procedures into a clear, accessible map for the entire team. This approach moves beyond traditional text-based manuals and scattered to-do lists. It creates a shared understanding that drives efficiency, reduces errors, and aligns cross-functional teams. Modern teams face increasing complexity with remote work and interconnected projects. Adopting visual workflows is no longer a luxury but a necessity for sustained productivity and effective collaboration.
This guide provides a comprehensive overview of visual workflows. It explores their fundamental benefits, outlines a practical process for creation, and examines advanced strategies for maximizing their impact. The integration of these workflows into a unified platform like Lark can transform static diagrams into dynamic, living systems that power the entire organization.

What is a visual workflow?
A visual workflow is a diagrammatic representation of a process. It maps out each step, decision point, and the flow of tasks from start to finish. Instead of describing a procedure in paragraphs of text, a visual workflow uses shapes, lines, and symbols to illustrate the same information. This creates an immediate, intuitive understanding of how work actually gets done.
Contrast this with a standard operating procedure document. A text-based SOP requires careful reading and mental mapping to comprehend. A visual workflow communicates the same information in seconds. It makes complex processes accessible to everyone involved, from new interns to senior stakeholders. The primary goal is to create a single, unambiguous source of truth for any operational procedure.
These diagrams are often called workflow diagrams or process maps. They are the primary tools for process visualization. This practice of making workflow visual helps teams identify redundancies, pinpoint potential bottlenecks, and standardize operations. Common types of these diagrams serve different purposes.
Flowcharts are the most universal type. They use basic shapes to represent steps, decisions, and endpoints. Swimlane diagrams add a crucial layer of clarity by organizing steps into horizontal or vertical lanes. Each lane represents a different person, team, or department. This makes it explicitly clear who is responsible for what in a cross-functional process. Business Process Model and Notation, or BPMN, is a more standardized set of symbols for complex business processes, ensuring consistency across the organization.
What are the differences between visual workflow and normal workflow
The core distinction lies not in the process itself, but in how it is communicated and understood. A normal workflow, often documented in text or simply understood informally, describes a sequence of tasks. A visual workflow maps this sequence graphically, leading to fundamental differences in clarity, alignment, and effectiveness.
A normal workflow typically exists as a list of steps in a document, email, or even as an unwritten understanding among team members. This format is linear and open to interpretation. It relies on individual team members to read, remember, and accurately interpret the written instructions. This often leads to misunderstandings, especially for complex processes with multiple decision points. The mental effort required to convert text into a mental model of the process is significant and prone to error.
In contrast, a visual workflow presents the entire process in a single, unified view. It shows the relationship between steps, parallel paths, and decision outcomes simultaneously. This graphical representation is processed faster by the human brain. It eliminates the need for mental mapping, providing immediate insight into how the process works. The visual format makes dependencies and handoffs between different parties explicit, which is often lost in a textual description.
The impact on team alignment is substantial. A normal workflow can lead to multiple interpretations of the same process. A visual workflow creates a shared mental model, ensuring everyone is literally on the same page. This is critical for onboarding new employees and for managing cross-functional projects where clarity between departments is essential. The visual model becomes a collaborative artifact that can be discussed and improved, rather than a static document.
How to create a visual workflow in 5 steps
Building an effective visual workflow requires moving from a conceptual understanding to a practical, usable diagram. This structured approach ensures the final output accurately reflects the real process while being optimized for clarity and collaboration. Following these five key steps enables teams to transform abstract procedures into clear, actionable guides that drive consistent execution.
Step 1: Identify and thoroughly map the existing process
The foundation of any effective visual workflow is a complete and honest assessment of the current process. Teams must document the actual "as-is" state rather than an idealized version. This involves capturing every single task, decision point, and handoff, regardless of how minor it may seem. This initial audit often reveals unexpected complexities, redundant steps, and potential bottlenecks that were previously overlooked. The process can be initially outlined and discussed collaboratively within Lark Docs, allowing team members to contribute in real-time and ensure no critical step is missed before formal diagramming begins.
Step 2: Collect comprehensive input from all stakeholders
The individuals who engage with the process daily possess the most accurate and nuanced understanding of its workings. Securing input from a diverse range of stakeholders—including team members from each department involved—is crucial for creating a valid and accepted workflow. This collaborative approach helps uncover hidden dependencies, informal shortcuts, and pain points that may not be visible from a management perspective. Creating a dedicated space in Lark Messenger for this feedback phase allows for continuous, asynchronous discussion, ensuring all voices are heard without scheduling numerous meetings.

Step 3: Select the optimal diagram type and design the workflow
With a solid understanding of the process and stakeholder feedback, the next step is to select the most appropriate visual model. The choice depends on the process's complexity and audience. A simple flowchart may suffice for a linear, single-team process, while a cross-functional procedure demands a swimlane diagram to clarify responsibilities across different groups. The design phase focuses on translating the collected information into a clear, logical visual structure, adhering to consistent symbols and layout principles. Teams can maintain a library of standardized templates and examples to ensure consistency and speed up this design step.
Step 4: Construct the diagram and validate its accuracy
Using a suitable diagramming tool, the team builds the initial visual draft. This version should then be subjected to rigorous validation by circulating it among the same stakeholders who provided initial input. The goal is to confirm that the visual representation logically matches the real-world operation and is easily understood by everyone, from new hires to experienced team members. Embedding the finalized diagram into a central Lark Docs makes it accessible as a single source of truth, while permission settings ensure controlled editing and maintenance.
Step 5: Implement the workflow and establish a review cycle
A visual workflow only delivers value when it is actively used and maintained. The approved diagram must be effectively communicated and integrated into daily operations. Crucially, workflows are dynamic artifacts that must evolve with the business. Establishing a clear ownership model and a regular review schedule—such as a quarterly check-in—ensures the diagram remains accurate and relevant. This ongoing maintenance can be managed by setting periodic reminders in Lark Calendar, embedding a culture of continuous process improvement directly into the team's operational rhythm.
Key benefits of implementing visual workflows
Adopting visual workflows translates into concrete advantages across an organization. These benefits move beyond theoretical concepts to deliver measurable improvements in daily operations. They address core challenges related to clarity, teamwork, and efficiency, creating a more agile and responsive work environment.
- Enhanced clarity and process streamlining
- Visual workflows create a single source of truth for any procedure. They eliminate ambiguity by mapping out every step and decision point. This transparency allows team members to understand their responsibilities and the overall process at a glance. The result is a significant reduction in confusion and errors, ensuring everyone moves in the same direction from the start.
- Improved team collaboration and communication
- These diagrams are particularly powerful for cross-functional and remote teams. Swimlane diagrams, for instance, explicitly define handoffs between different departments or individuals. This clarity reduces friction and creates a shared understanding of how individual contributions fit into the larger picture. Visual workflows act as a central reference point, facilitating better communication and alignment across the entire team.
- Boosted productivity and operational efficiency
- When a process is visualized, bottlenecks and redundancies become immediately apparent. Teams can quickly identify and eliminate steps that cause delays or unnecessary work. This streamlining of workflows removes friction from the system, allowing tasks to move forward more smoothly and rapidly. The time saved on deciphering complex instructions or correcting misunderstandings directly translates into higher productivity.
- Standardized onboarding and training
- Visual workflows serve as exceptional training tools for new team members. Instead of navigating lengthy text documents, newcomers can see the entire process and their role within it. This visual context accelerates the learning curve and ramps up their effectiveness much faster. It also ensures that every employee receives consistent and complete information about standard procedures.
Select Lark as your platform for dynamic visual workflows
Many tools can create a static visual workflow. The true transformation occurs when these diagrams are involved into the platform where work actually happens. Lark provides an environment where visual workflows become dynamic, interconnected systems that drive execution. This approach moves beyond simple diagramming into active process management. As comprehensive visual workflow software, Lark brings clarity and action together.
Building a visual blueprint for collaborative efficiency
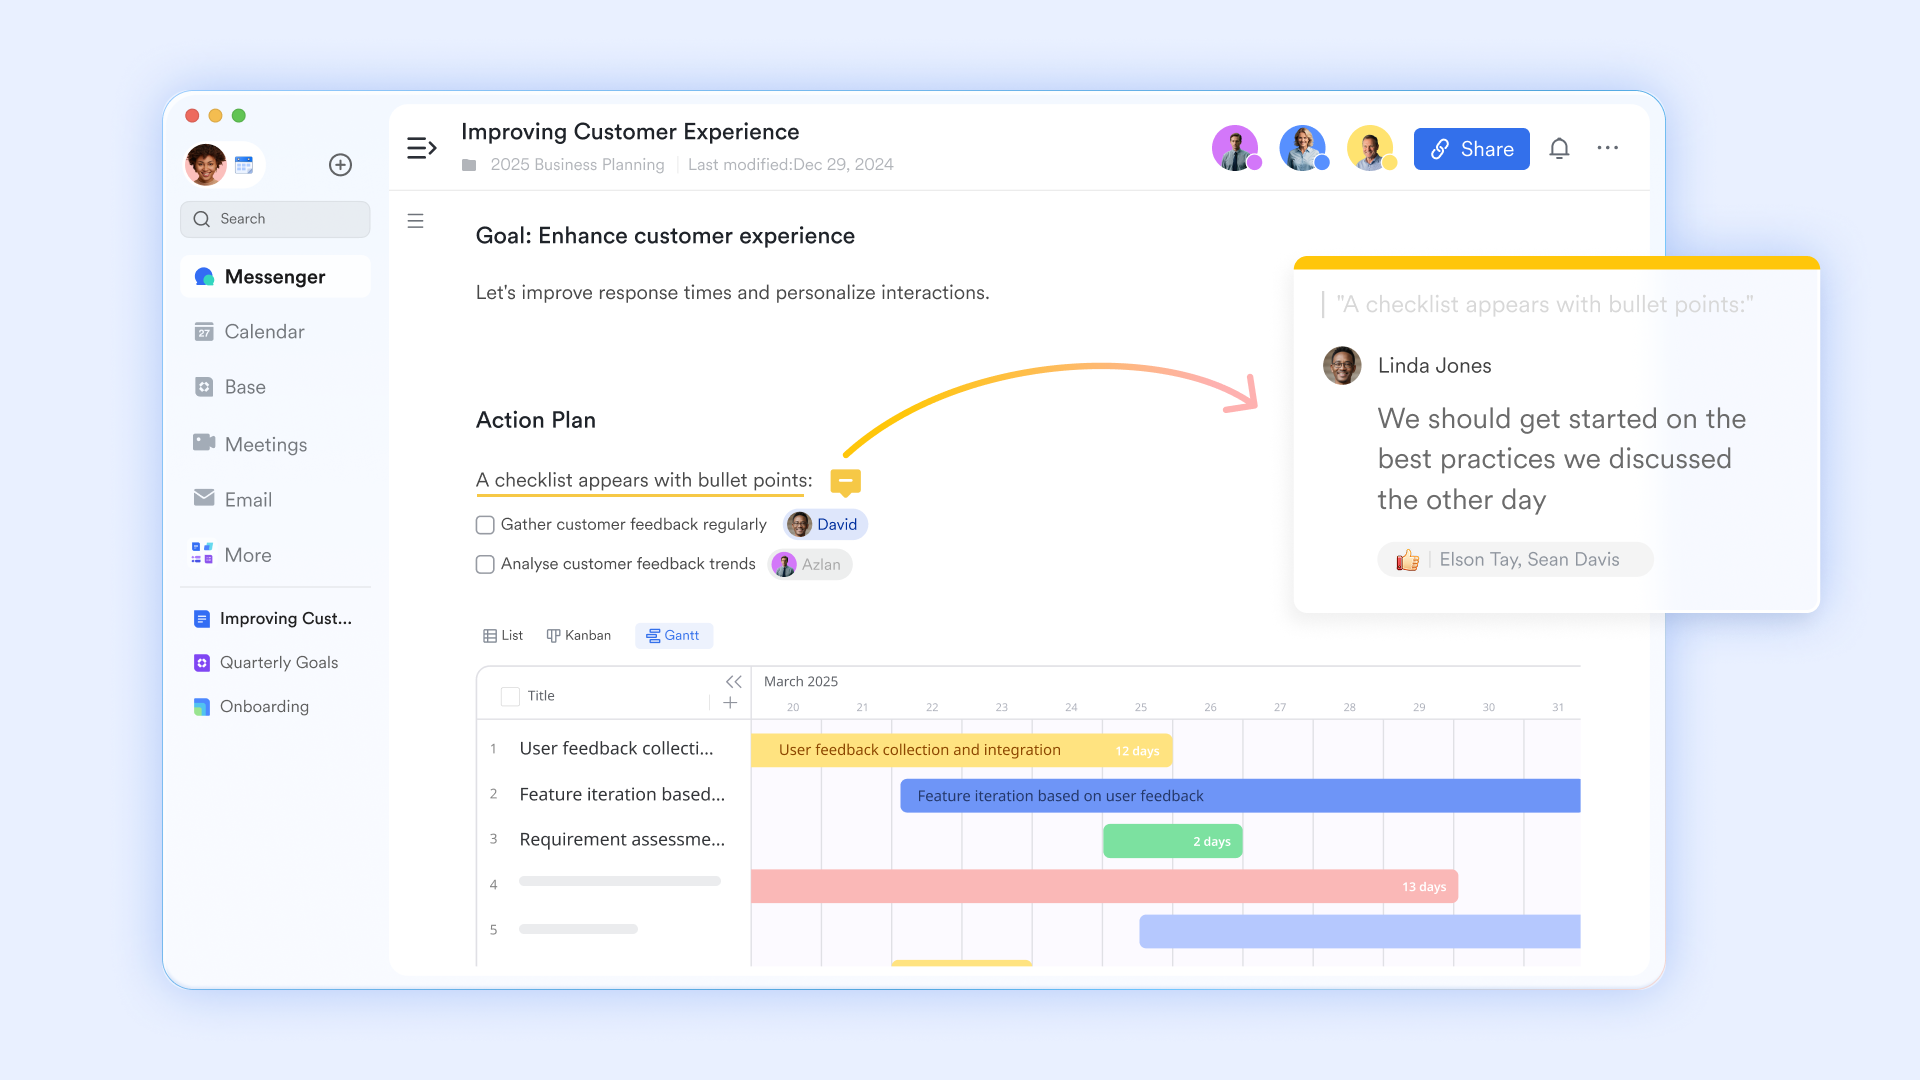
Before diving into specific tools, it's crucial to transform abstract workflows into a clear visual blueprint. The core objective of this phase is to establish a unified conceptual framework for the team regarding "how work gets done," eliminating rework and communication overhead caused by misunderstandings from the very start.
Lark Docs proves immensely powerful at this stage. Team members can collaborate in real-time around a single document, using checklists, tables, and free-form text to collectively outline the process's starting point, endpoints, key tasks, and decision nodes. This collaborative approach ensures the blueprint itself embodies collective intelligence, laying a solid and accurate foundation for subsequent visualization.
Translating the blueprint into dynamic workflows
Once the process is defined, the next step is to build the visual representation itself. A capable visual workflow builder is essential for this phase.
Using Lark Board to create visual workflows:
Lark Board is a powerful graphics tool embedded within documents, particularly suited for creating flowcharts, mind maps, swimlane diagrams, and other charts requiring precise expression of logic and sequence. Its functionality aligns with what one might seek in a dedicated visual workflow editor, providing intuitive drag-and-drop creation.
Quick insertion and creation: You can quickly insert a Board into an existing document via the "+" button at the starting line. To create a standalone Board document, you can click "New" -> "Board" from the Docs homepage. This provides a flexible starting point for diagramming.
Leverage templates & elements: Board offers a rich library of templates and shapes (like rectangles, diamonds, connectors), allowing you to easily build clear flowcharts or swimlane diagrams through drag-and-drop, establishing a central visual source of truth for your team's process. Here are some templates in the library of Lark Board:
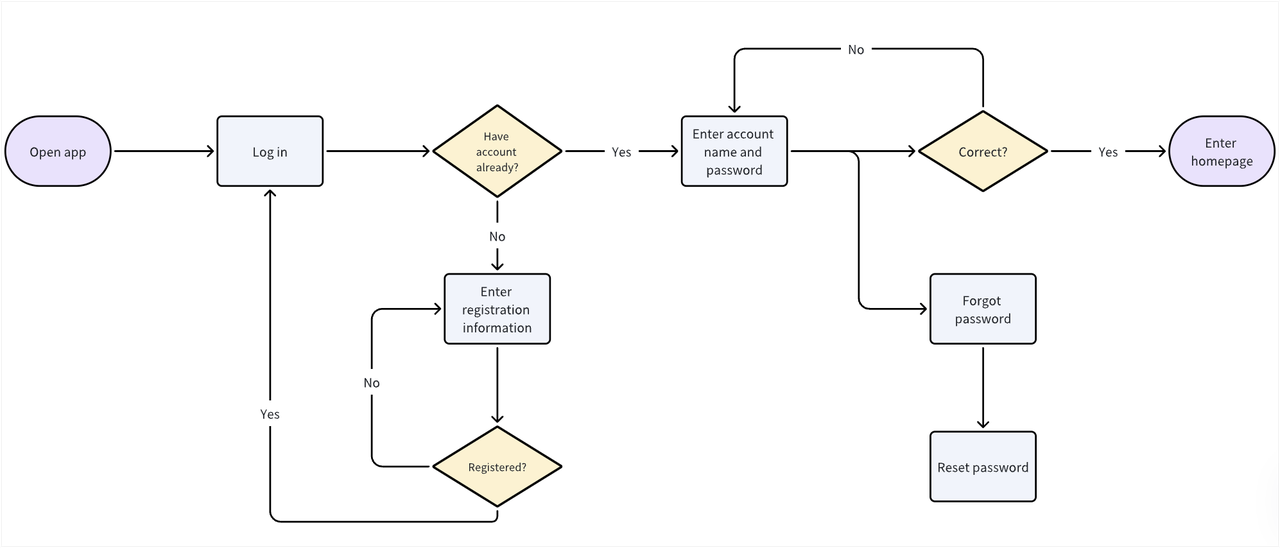
- Flowchart: Ideal for standard operating procedure (SOP) documentation
Perfect for: Employee leave approval workflows, customer service response protocols, and content publishing reviews. Visualizing step sequences ensures each phase follows established standards, significantly reducing execution variances.
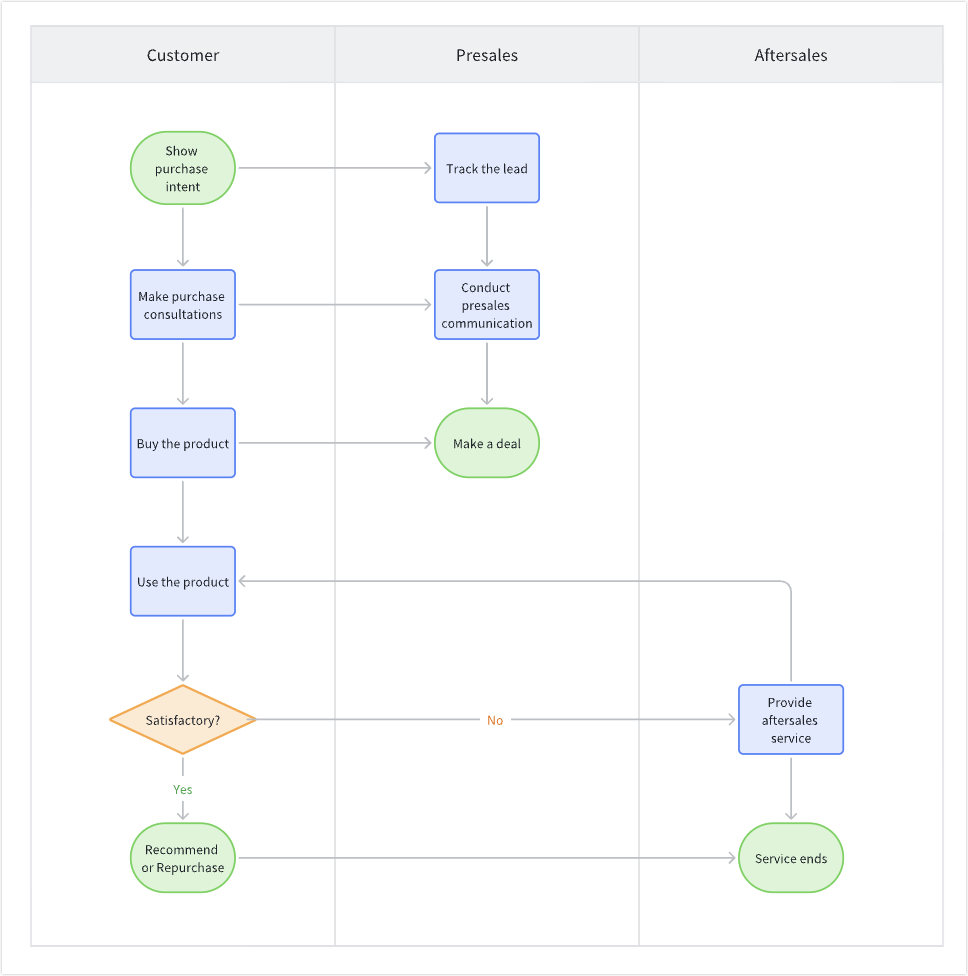
- Vertical swimlane flowchart: Optimized for cross-departmental coordination
Typical applications: Product requirement review processes (involving product, design, development, and testing teams), marketing campaign planning (requiring parallel work from marketing, sales, and creative teams). This template clearly defines departmental responsibilities through vertical partitioning, effectively identifying process bottlenecks and collaboration gaps.
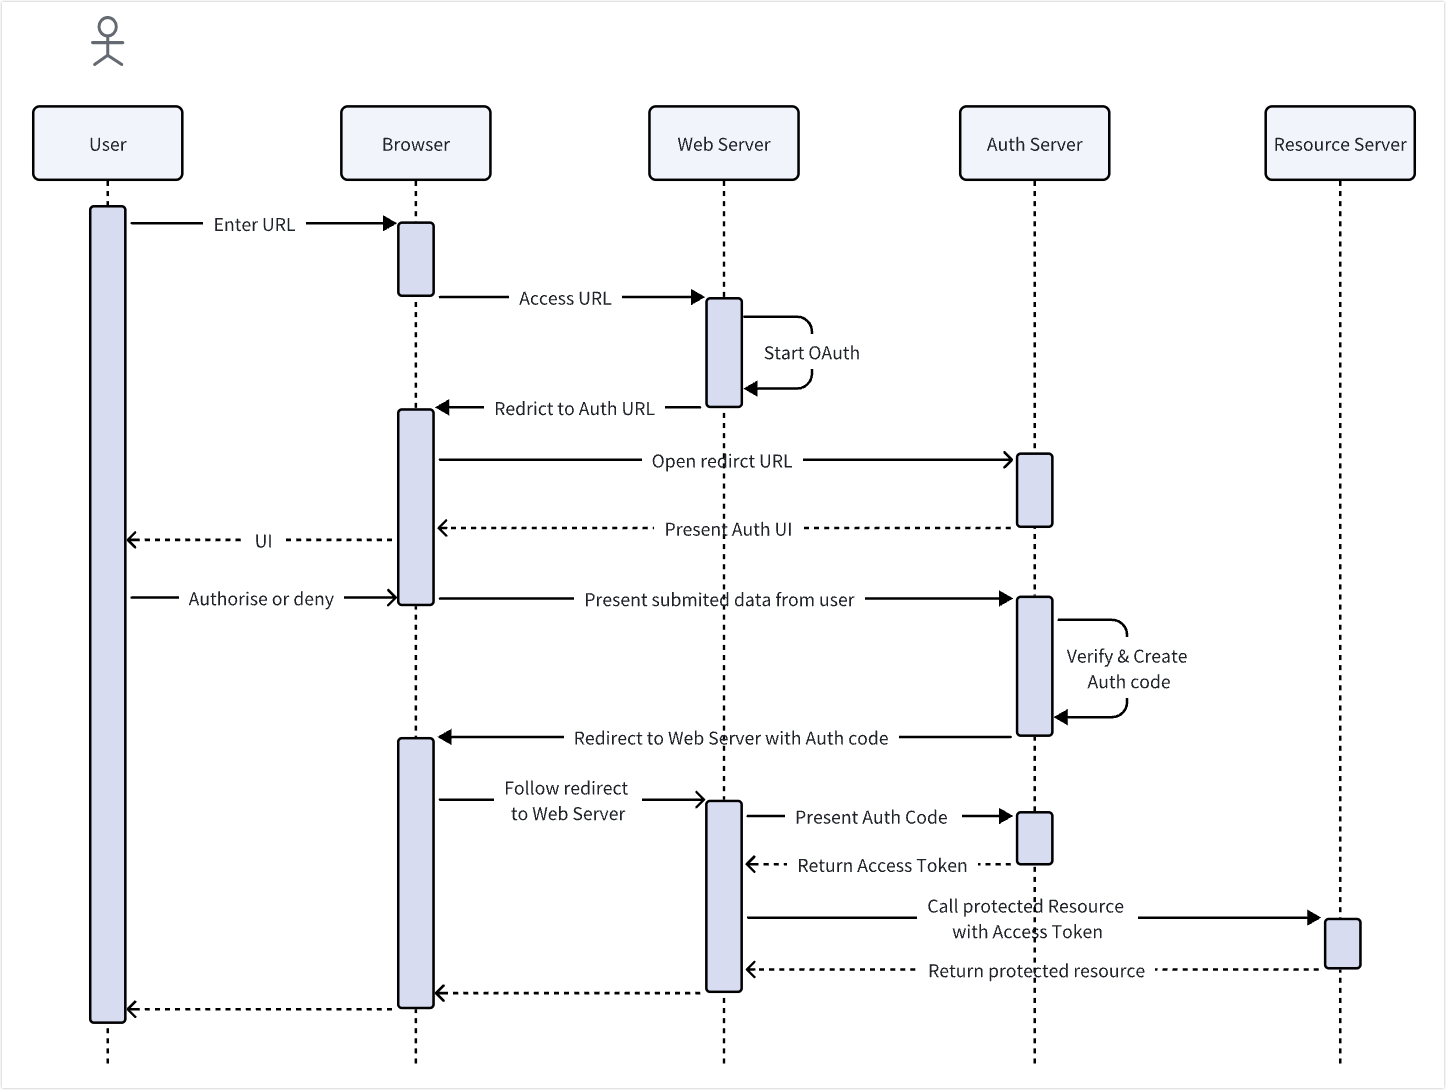
- Sequence Diagram: Focused on system interactions and transaction processing
Core use cases: Customer order processing workflows (showcasing information exchange between frontend interfaces, order services, inventory systems, and payment gateways), data synchronization mechanisms (describing call sequences and feedback mechanisms among multiple system components). This template accurately presents interaction sequences and dependencies, serving as an invaluable asset for technical teams designing system architectures.
Facilitate team collaboration: Once the flowchart is complete, it can be shared directly with collaborators. They can add comments directly on the Board, keeping all discussions centered around the diagram and preventing loss of context.
Using Lark Base to create dynamic Kanban boards:
If Board excels at drawing the strategic map, then Lark Base is responsible for turning that map into a dynamic command center that reflects real-time progress. It's especially suited for managing task flows that require tracking status, assignees, and deadlines.
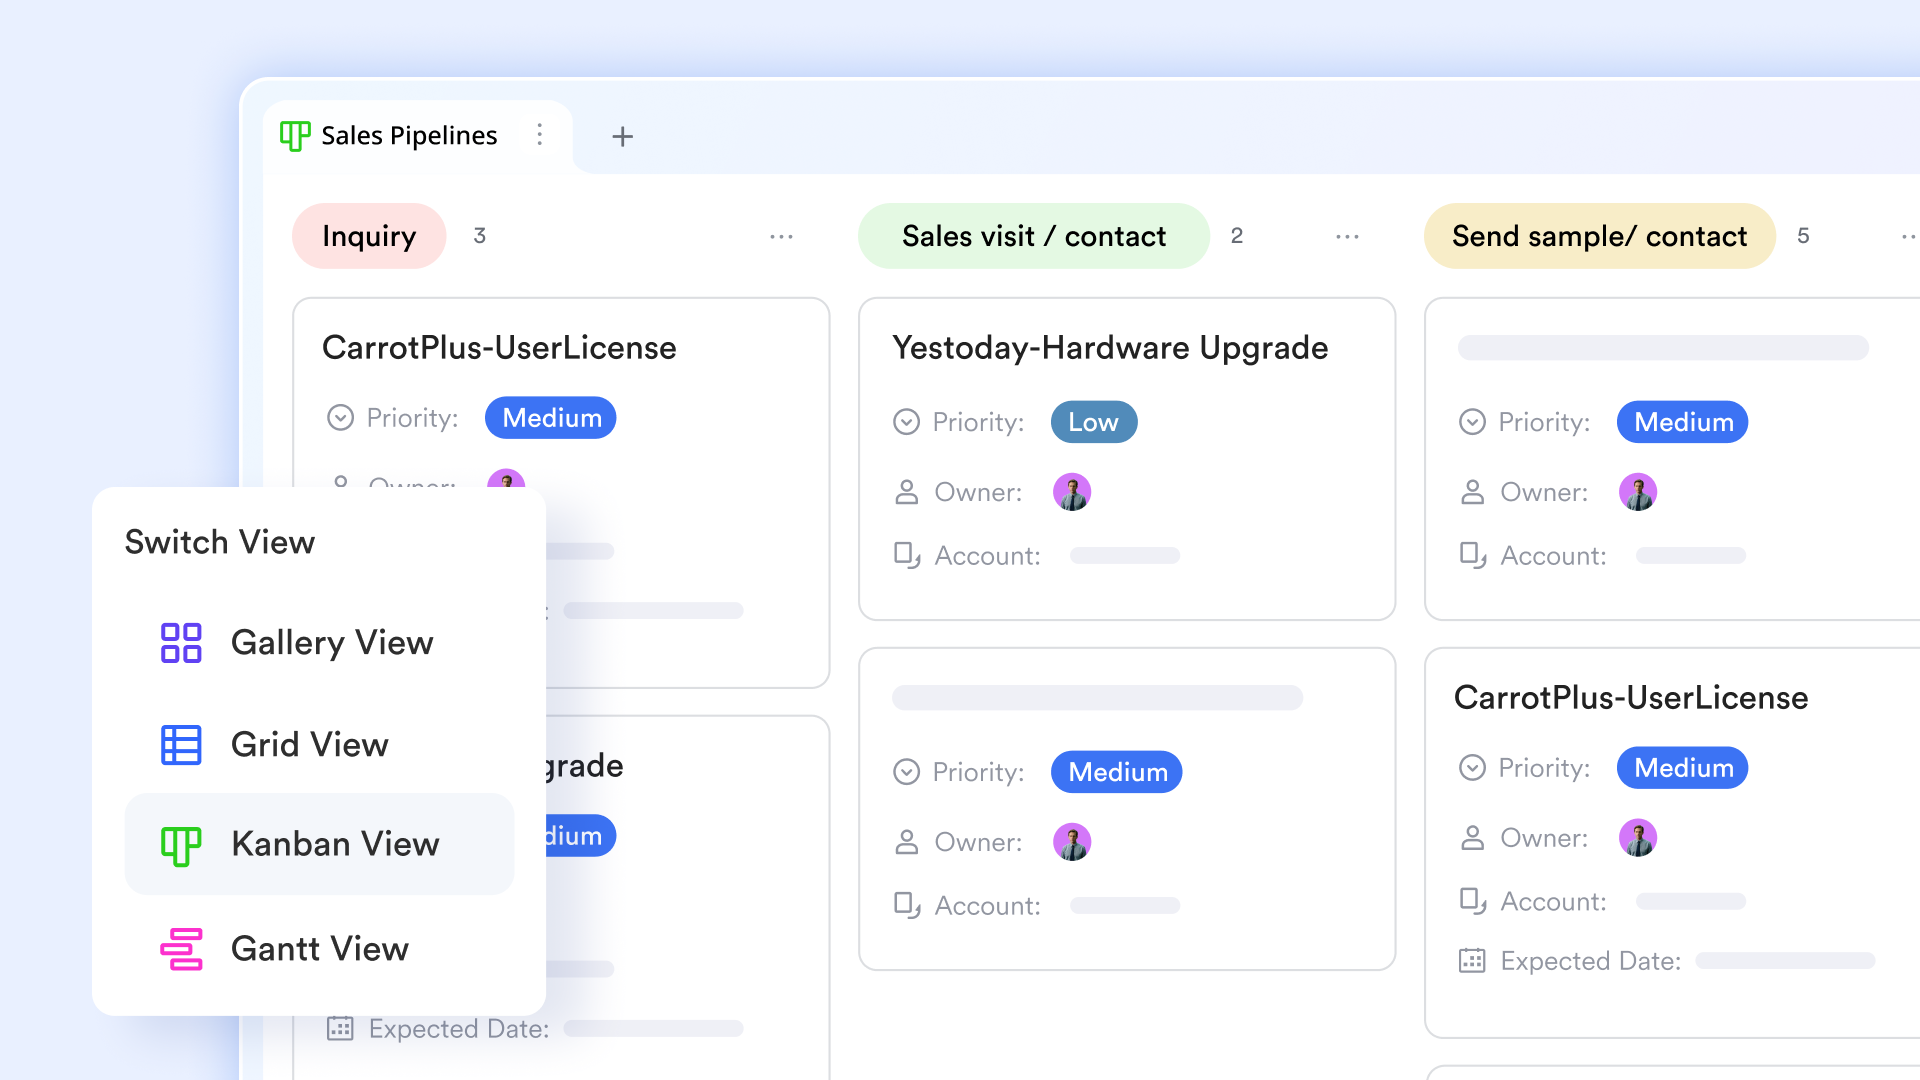
From data to view: The core of Base is a flexible database. You first define and enter all task data in the Grid view, much like using a traditional spreadsheet, by creating fields such as "Task Name", "Assignee", "Status", "Due Date", etc.
One-click switch to Kanban: Once the data is ready, click Create View and select Kanban view. Base automatically transforms your task list into a visual Kanban board. This upgrades your workflow from a static "map" to a dynamic command center that reflects real-time progress. You can group task cards based on fields like "Status", with common columns like "To Do," "In Progress," and "Done" making progress clear at a glance.
Customization & visualization: In the Kanban view, you can customize which fields are displayed on the cards, highlighting key information like due dates or assignees for quick identification.
Executing and collaborating in context
A visual workflow delivers maximum value when discussion and action are directly linked to it.
Anchor communication context: Use Lark Messenger to replace scattered email threads. Create a group chat for the project and share the workflow board or diagram there. Team members can discuss specific tasks directly in the chat, and you can pin the document to the chat window for easy access, ensuring conversations are always context-aware.
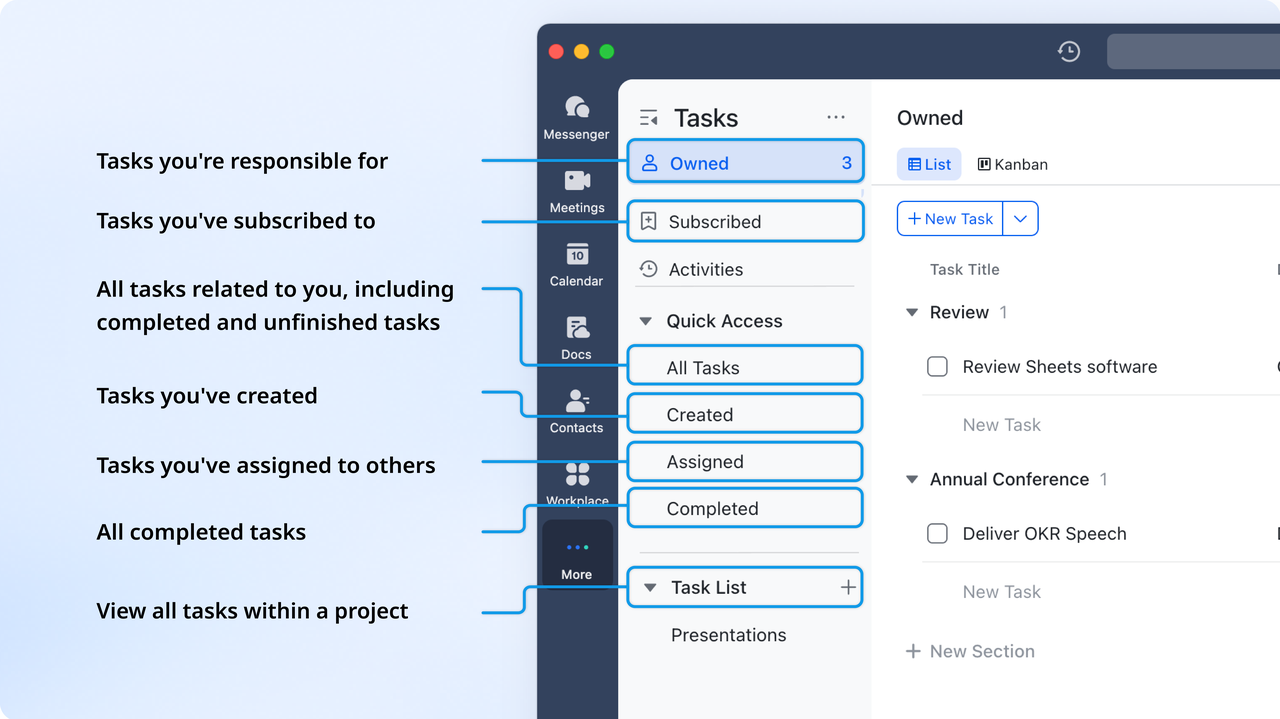
Turn discussion into action: During discussions in Messenger, decisions can be quickly converted into tasks. These tasks can be created directly in Lark Tasks and linked back to the corresponding card in your Base, ensuring all communication translates into trackable action items.
Implementing automation and continuous optimization
The final step is to make the workflow intelligent and self-updating. This is where visual workflow automation delivers significant efficiency gains.
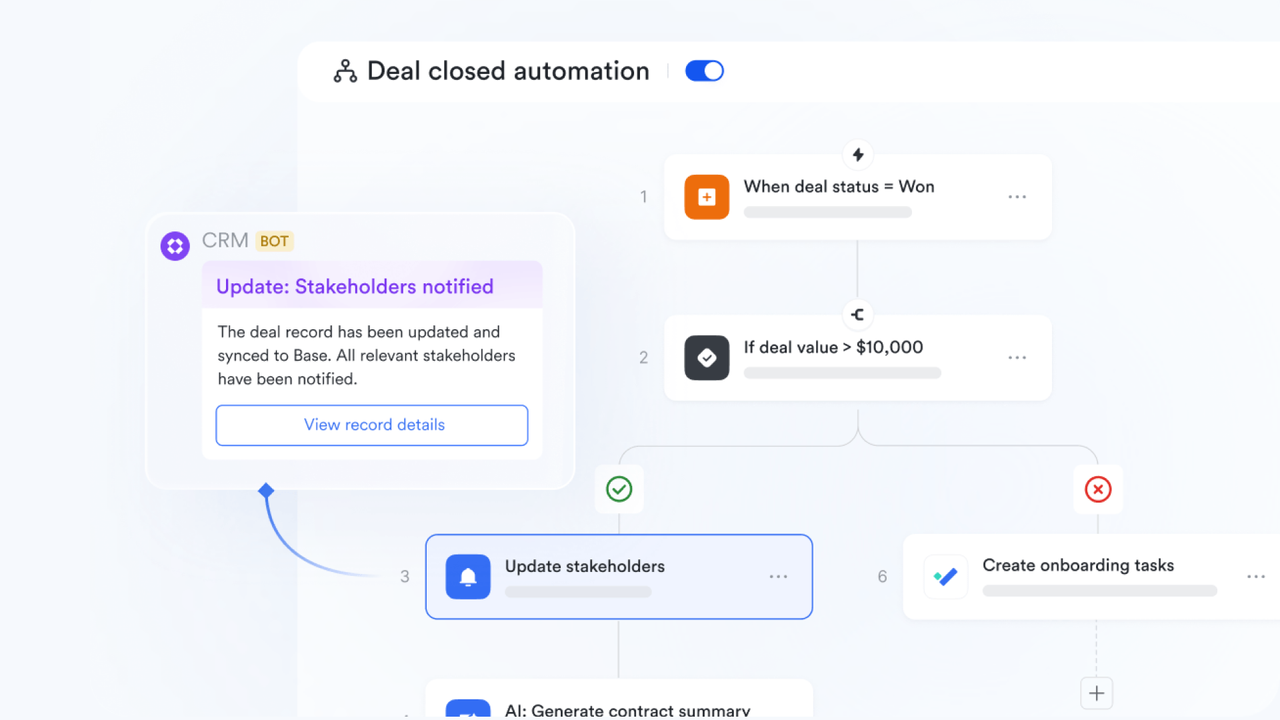
Configure automation rules: Use Lark's no-code automation features to reduce manual work. For example, you can create a rule in Lark Base so that when a task's status changes to "Editorial Review," it is automatically assigned to the Editorial Lead and a notification is sent to the relevant Messenger group. This ensures the workflow keeps moving without constant manual intervention.
Automate scheduling and syncing: Connect your workflow to your calendar. When a task enters a "Final Approval" stage, an automation can trigger the scheduling of a launch meeting in Lark Calendar and assign preparatory Lark Tasks to relevant team members. This creates a seamless flow where process progress automatically triggers the next steps.
Pricing:
- Free plan: Includes 11 powerful products, supporting up to 20 users, 100 GB storage, 1,000 automation runs and unlimited AI translation in chats, docs and email.
- Basic plan: $6/user/month (billed annually) for up to 500 users. Includes everything in Starter plus unlimited message history, 5TB storage, 1,000 automation runs, and more. Some users may need to contact sales to purchase.
- Pro plans: $12/user/month, supporting up to 500 users. Includes unlimited message history, 50,000 automated Base workflow executions per month.
- Enterprise plan: Contact sales for custom pricing. Supports unlimited users and includes even more automation runs and advanced security, compliance, and management features.
Best practices for visual workflow management
Creating a visual workflow is the first step; managing it effectively ensures long-term value. Adhering to a set of proven practices maintains the diagram's clarity, relevance, and utility. These guidelines help transform a one-time project into a sustainable asset for continuous process improvement.
Prioritize simplicity and focus
The most effective workflows are easy to understand. Avoid the temptation to capture every minor exception or detail, which can lead to clutter and confusion. If a process is inherently complex, break it down into a series of smaller, interconnected diagrams. A clear and focused workflow communicates its message instantly and remains accessible to all team members.
Establish a consistent visual language
Consistency is key to preventing misinterpretation. Teams should agree on a standard set of symbols, shapes, and colors. For instance, always using a diamond for decisions and a rectangle for tasks creates a universal language. Applying these conventions across all organizational workflows reduces the learning curve and reinforces clear communication.
Treat the workflow as a living document
Processes evolve, and so should their visual representations. A static, outdated diagram can be more harmful than having no diagram at all. Schedule periodic reviews to update the workflow based on team feedback and process changes. This iterative approach ensures the diagram remains an accurate and trusted reflection of reality.
Use cases and applications of visual workflows
Visual workflows provide practical solutions across various business functions, transforming abstract procedures into clear, executable diagrams. These applications demonstrate how process visualization brings tangible benefits to real-world operations across different departments and industries.
Campaign launches involve multiple teams and complex deliverables. A visual workflow maps the entire process from initial concept to performance analysis. The diagram clearly outlines stages for content creation, design review, legal approval, and multi-channel publication. Marketing teams can track each asset's progress through a Kanban-style board, with designated swimlanes for different team responsibilities. This visibility helps prevent bottlenecks in the review process and ensures all components launch simultaneously across platforms.
Support teams handle numerous requests requiring consistent handling procedures. A visual workflow standardizes the ticket resolution process from receipt to solution. The diagram defines clear escalation paths, establishes response time expectations, and outlines troubleshooting procedures. New support agents can follow the visual guide to handle common issues, while experienced staff use it for complex case management. The workflow ensures every customer receives the same quality of service regardless of which team member handles their request.
Employee onboarding and offboarding
The employee lifecycle involves coordinated efforts across HR, IT, and management. A visual workflow ensures a consistent experience for every new hire while covering all compliance requirements. The diagram maps tasks across the first weeks of employment, from pre-arrival paperwork to training completion. Similarly, offboarding workflows ensure all access is properly revoked and exit interviews are conducted. This systematic approach guarantees that no critical steps are missed during these important transitions.
Content creation involves multiple revisions and stakeholder approvals. A visual workflow manages the entire development process efficiently. The diagram tracks content pieces from initial draft through editing, SEO optimization, legal review, and final publication. Each stage has clear entry and exit criteria, with designated approvers for different aspects. This prevents version confusion and ensures content meets all quality standards before publication.
Development teams manage complex code changes and issue resolutions. A visual workflow tracks features and bugs from identification through deployment. The diagram outlines stages for coding, testing, review, and deployment, with clear criteria for moving between stages. This creates transparency for the entire team and prevents code from being deployed without proper validation, while ensuring critical bugs are prioritized and resolved systematically.
Advanced visual workflow strategies for modern teams
Moving beyond basic implementation unlocks the full strategic value of visual workflows. These advanced approaches transform static diagrams into intelligent, adaptive systems that drive continuous improvement.
Quantify workflow ROI with data-driven insights
While qualitative benefits are valuable, measuring quantitative impact justifies continued investment. Teams can track metrics like process cycle time reduction, error rate decrease, and onboarding acceleration. Lark Base enables this analysis through customizable dashboards that visualize key performance indicators. Automated data collection from workflow execution provides objective evidence of efficiency gains, helping leaders make informed decisions about process optimization.

Optimize for hybrid and asynchronous collaboration
Modern teams require workflows that function effectively across time zones and work arrangements. Visual diagrams serve as the central reference point for distributed teams, reducing dependency on synchronous meetings. Lark's combination of Board and communication creates a powerful asynchronous collaboration environment. Team members can discuss process steps, update statuses, and resolve issues without schedule coordination, while Calendar integration ensures deadline visibility across the organization.
Implement intelligent automation and AI enhancements
The future of workflow management lies in predictive and self-optimizing systems. Lark's automation capabilities can proactively route tasks based on workload, send reminders for approaching deadlines, and trigger follow-up actions. Exploring advanced features, much like one might evaluate Opal visual workflow editor features, can reveal new opportunities for efficiency. This transforms visual workflows from passive diagrams into active systems that learn and adapt to team working patterns. Furthermore, understanding how a visual workflow salesforce integration might function can illustrate the power of connecting workflow automation to customer relationship management.
Conclusion
Visual workflows offer a profound shift from chaotic, opaque processes to clear, manageable systems. They foster clarity, enhance collaboration, and drive significant gains in productivity and efficiency. The journey involves mapping existing processes, engaging stakeholders, and continuously refining the diagrams. Advanced strategies further unlock their potential by focusing on measurable ROI, supporting distributed teams, and leveraging automation.
The ultimate effectiveness of a visual workflow is determined by its integration into the daily work environment. When these diagrams are embedded within a unified platform like Lark, they evolve from static references into active, living systems. They connect communication, task management, and scheduling into a cohesive whole. Embracing visual workflows is a decisive step toward building a more agile, transparent, and efficient organization. The path to peak team productivity begins with making work visible.
FAQs
What is a visual workflow?
A visual workflow is a diagrammatic representation of a process that maps out each step, decision point, and task sequence. It transforms complex, text-based procedures into an intuitive, graphical format for immediate understanding. This approach creates a single source of truth that enhances clarity and alignment across teams, moving beyond static documents to dynamic process management.
What are the four types of workflows?
The four primary workflow types are sequential, state machine, rules-driven, and parallel. Sequential workflows follow a strict linear path from one step to the next. State machine workflows transition between defined states based on specific triggers. Rules-driven workflows execute actions based on predefined business rules, while parallel workflows enable multiple process streams to advance simultaneously.
What are the 5 stages of workflow?
The five essential workflow stages are initiation, planning, execution, monitoring, and optimization. Initiation identifies the process need and defines objectives. Planning maps out the detailed steps and responsibilities. Execution involves carrying out the planned activities, while monitoring tracks progress against goals. The final optimization stage focuses on analyzing performance and implementing improvements for future cycles.
What is the best way to visualize workflows?
The most effective workflow visualization depends on the process complexity and audience needs. Kanban boards excel for tracking task status across simple workflows, while flowcharts effectively map linear processes with decision points. Swimlane diagrams are ideal for clarifying cross-functional responsibilities, and Gantt charts best visualize project timelines with dependencies between tasks.
Related reading
Table of contents
Start using Lark today

Manage all your work in one place
Boost team efficiency by 10x
Save up to 70% on software costs
Table of contents
Start using Lark today
Manage all your work in one place
Boost team efficiency by 10x
Save up to 70% on software costs
Keep reading








2026 Lark Technologies Pte. Ltd.
Headquartered in Singapore with offices worldwide.






Explore: