














Project Portfolio Dashboard Guide: Metrics, Templates & Practices

Ryan Tanner
Product Marketing Specialist
Sep 8, 2026
Ryan Tanner
Sep 8, 2026

22 min read


Managing multiple projects simultaneously has become the norm for modern organizations, making clear portfolio visibility essential for effective decision-making. A project portfolio dashboard consolidates all initiatives into a single view, enabling teams to monitor progress, budgets, risks, and dependencies in real time. More than status reporting, it helps PMOs identify issues early, balance resources, and ensure alignment with strategic goals.
This guide outlines the key metrics, components, dashboard types, and steps needed to build a high-impact portfolio dashboard. It also highlights how tools like Lark can support clearer data organization and smoother collaboration without disrupting existing workflows.

What is a project portfolio dashboard?
A project portfolio dashboard is a centralized visual tool that gives organizations a real-time overview of all ongoing projects, programs, and initiatives. Unlike a single project dashboard that focuses on tasks and day-to-day execution, a portfolio dashboard provides a strategic, high-level snapshot of status, risks, budgets, resources, and overall progress across multiple projects. It helps PMOs and leaders compare performance, identify bottlenecks, prioritize investments, and ensure projects align with broader business goals.
A well-designed dashboard consolidates data into clear charts, summaries, and indicators, enabling faster reporting and more accurate decision-making. Many organizations use a project portfolio management dashboard to track dependencies and resource allocation, while others rely on project portfolio dashboard examples or templates to establish consistent reporting frameworks. Ultimately, it serves as the single source of truth for portfolio visibility and governance.
Key metrics to include in a project portfolio dashboard
Identifying the proper metrics is essential for building a project portfolio dashboard that delivers clarity, consistency, and meaningful insights. Metrics help PMOs compare performance across initiatives, detect emerging issues, and guide strategic decisions. Many organizations reference project portfolio dashboard examples or use a project portfolio dashboard template to ensure standardized reporting. Whether the dashboard is built internally or through a Power BI project portfolio dashboard, the right metrics create a reliable, enterprise-wide view of execution and impact.
- Portfolio health and status overview: This metric gives a quick snapshot of overall portfolio performance, showing which projects are on track, at risk, or delayed. It helps teams compare progress across initiatives and detect patterns early. A project portfolio management dashboard makes these status indicators more accessible for executives and PMOs.
- Timeline and milestone progress: Tracking milestones ensures teams stay aligned with expected delivery schedules. Timelines highlight delays, critical path issues, and potential bottlenecks. Visual progress indicators help identify overruns early so teams can recalibrate plans before they escalate.
- Budget vs. actuals: This metric compares planned spending with actual costs, helping organizations control financial performance. It highlights burn rate, forecasted totals, and potential overruns. PMOs often rely on project portfolio management dashboard examples to standardize financial tracking across departments.
- Resource allocation and utilization: Resource metrics show how teams, skills, and capacities are distributed across projects. They help managers prevent over-allocation and identify underused capabilities. Balanced utilization supports smoother delivery and avoids workload bottlenecks.
- Risk and issue heatmaps: Heatmaps visualize risk levels by probability and impact, making it easier to prioritize mitigation efforts. They reveal patterns that might be missed when reviewing projects individually. An executive project portfolio dashboard often highlights these risks for faster decision-making.
- Program dependencies: Dependencies reveal how project timelines and outcomes influence one another. Tracking them helps PMOs anticipate cascading delays and coordinate cross-functional teams. Precise dependency mapping reduces uncertainty and strengthens planning accuracy.
- KPIs by department or business unit: Different teams own different outcomes, so departmental KPIs provide more targeted insights. This ensures every function can measure progress against specific goals. Using a structured project portfolio dashboard template helps keep these KPIs consistent across the organization.
Types of project portfolio dashboards
Project portfolio dashboards come in different formats depending on who uses them and what decisions they support. Each dashboard type offers a unique lens on portfolio governance, helping teams interpret complex data with clarity. Strong data visualization makes it easier to spot trends, risks, and opportunities across programs. These dashboards also strengthen operational efficiency by consolidating scattered metrics into a unified view. With the proper reporting structure, organizations can improve strategic prioritization and execution discipline.
- Executive project portfolio dashboard: An executive dashboard focuses on strategic prioritization and organization-wide performance analytics. It highlights high-level metrics, including portfolio health, revenue impact, and delivery confidence. Leaders use it to align investments with long-term goals and improve portfolio governance. This dashboard supports fast decisions without overwhelming detail.
- PMO dashboard: The PMO dashboard brings deeper resource insights and operational oversight into one place. It tracks delivery timelines, risk exposure, and team capacity across programs. This enhances portfolio governance by ensuring projects follow consistent standards and controls. PMOs rely on it to refine reporting structure and improve execution stability.
- Project performance dashboard: Provides day-to-day visibility into tasks, milestones, and dependencies. It strengthens operational efficiency by highlighting delays and blockers early. Teams rely on performance analytics to adjust workloads and maintain delivery momentum. This dashboard supports quick corrective actions across active projects.
- Financial portfolio dashboard: A financial dashboard focuses on cost control, funding utilization, and forecast accuracy across the portfolio. It improves strategic prioritization by showing which initiatives deliver value within budget. Finance teams use it to balance spending, optimize burn rates, and refine reporting structure. It ensures financial discipline throughout execution.
- Power BI project portfolio dashboard: A Power BI dashboard uses advanced data visualization to turn portfolio data into interactive insights. It strengthens performance analytics with drill-downs, heatmaps, and KPI cards. This dashboard supports better strategic prioritization by revealing cross-project relationships and trends. Power BI improves operational efficiency through automated, role-based reporting.
How to build a project portfolio dashboard
Building a project portfolio dashboard requires a structured approach that ensures data accuracy, clear visualization, and consistent reporting. The goal is to improve operational efficiency and support stronger portfolio governance through reliable insights. Each step helps create a scalable reporting structure that works for PMOs, executives, and delivery teams. When done correctly, dashboards enhance performance analytics and support strategic prioritization across all initiatives. This process also ensures dashboards evolve as portfolio needs grow.
Step 1: Define KPIs and reporting goals
Start by identifying the KPIs that matter most for decision-making and strategic prioritization. Align these metrics with leadership expectations and portfolio governance needs. This ensures the reporting structure is clear and purposeful. A well-defined set of KPI forms the foundation of performance analytics.
Step 2: Standardize project data fields
Create uniform data categories for timelines, risks, budgets, and resources. Standardization improves operational efficiency by reducing inconsistencies across reports. It also strengthens portfolio governance by ensuring all teams follow the same data model. Consistent fields make aggregation and analysis seamless.
Step 3: Consolidate project information
Gather all relevant information into a single system of record to improve visibility. This consolidation enhances performance analytics and cross-project insights. It also allows leaders to understand interdependencies and strategic prioritization needs. Reliable consolidation supports better forecasting and resource planning.
Step 4: Create visual components
Use clear data visualization elements to make complex metrics easy to interpret. Visuals help teams spot trends, bottlenecks, and execution gaps. Effective visualization improves operational efficiency by reducing review time. It also supports structured and consistent portfolio governance.
Step 5: Enable filtering for leaders and teams
Include filters for departments, risk levels, programs, regions, or project types. Filters improve performance analytics by allowing tailored views for each role. They also strengthen the reporting structure by giving users control over what they see. This supports strategic prioritization at all levels.
Step 6: Set up automated reporting or status updates
Automating updates reduces manual work and ensures data stays current. This improves operational efficiency across the portfolio. Automated reporting also supports consistent portfolio governance by eliminating reporting delays. It strengthens performance analytics by ensuring decisions rely on fresh data.
Step 7: Continuously refine based on PMO and executive feedback
Use feedback loops to improve usability, clarity, and reporting structure over time. Refinement ensures the dashboard stays aligned with strategic prioritization needs. It enhances operational efficiency by removing unnecessary elements and improving flow. Continuous improvement strengthens long-term portfolio governance.
Action time: Use Lark for smart project portfolio management
Lark brings messaging, documents, meetings, tasks, approvals, and a zero-code database into a single workspace. For project portfolio management, Lark creates a system in which intake, evaluation, governance, and execution remain linked rather than scattered across project management tools. Instead of stitching platforms together, Lark provides a unified environment where PMOs, delivery teams, and leadership use the same data and signals.
Lark combines Messenger, Docs, Meetings, and Approval to streamline project portfolio management. Messenger enables quick communication and group chats for fast decision-making. Docs supports collaborative editing, task creation, and tracking within documents. Meetings facilitate real-time discussions and reviews, while Approval provides customizable workflows for requests, with features like launching group chats and automatic data syncing.
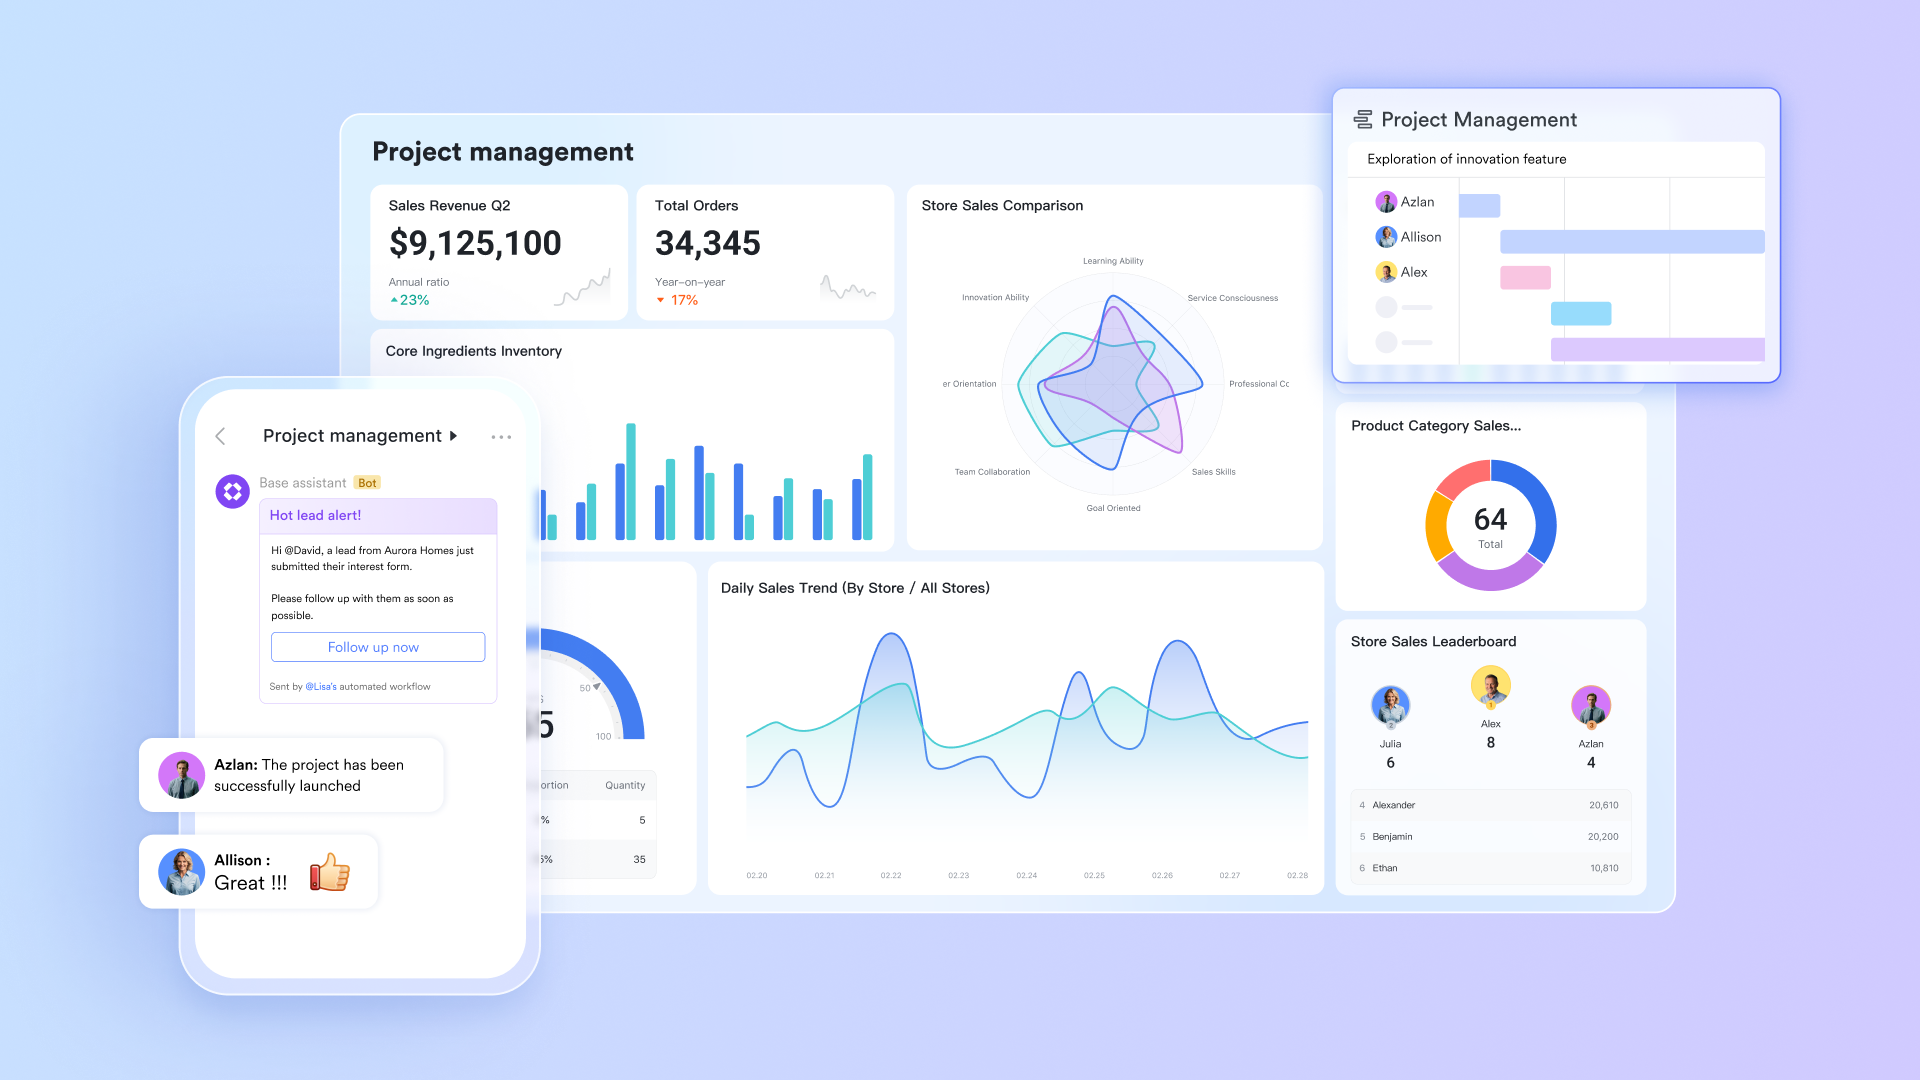
Project dashboards with real-time visibility
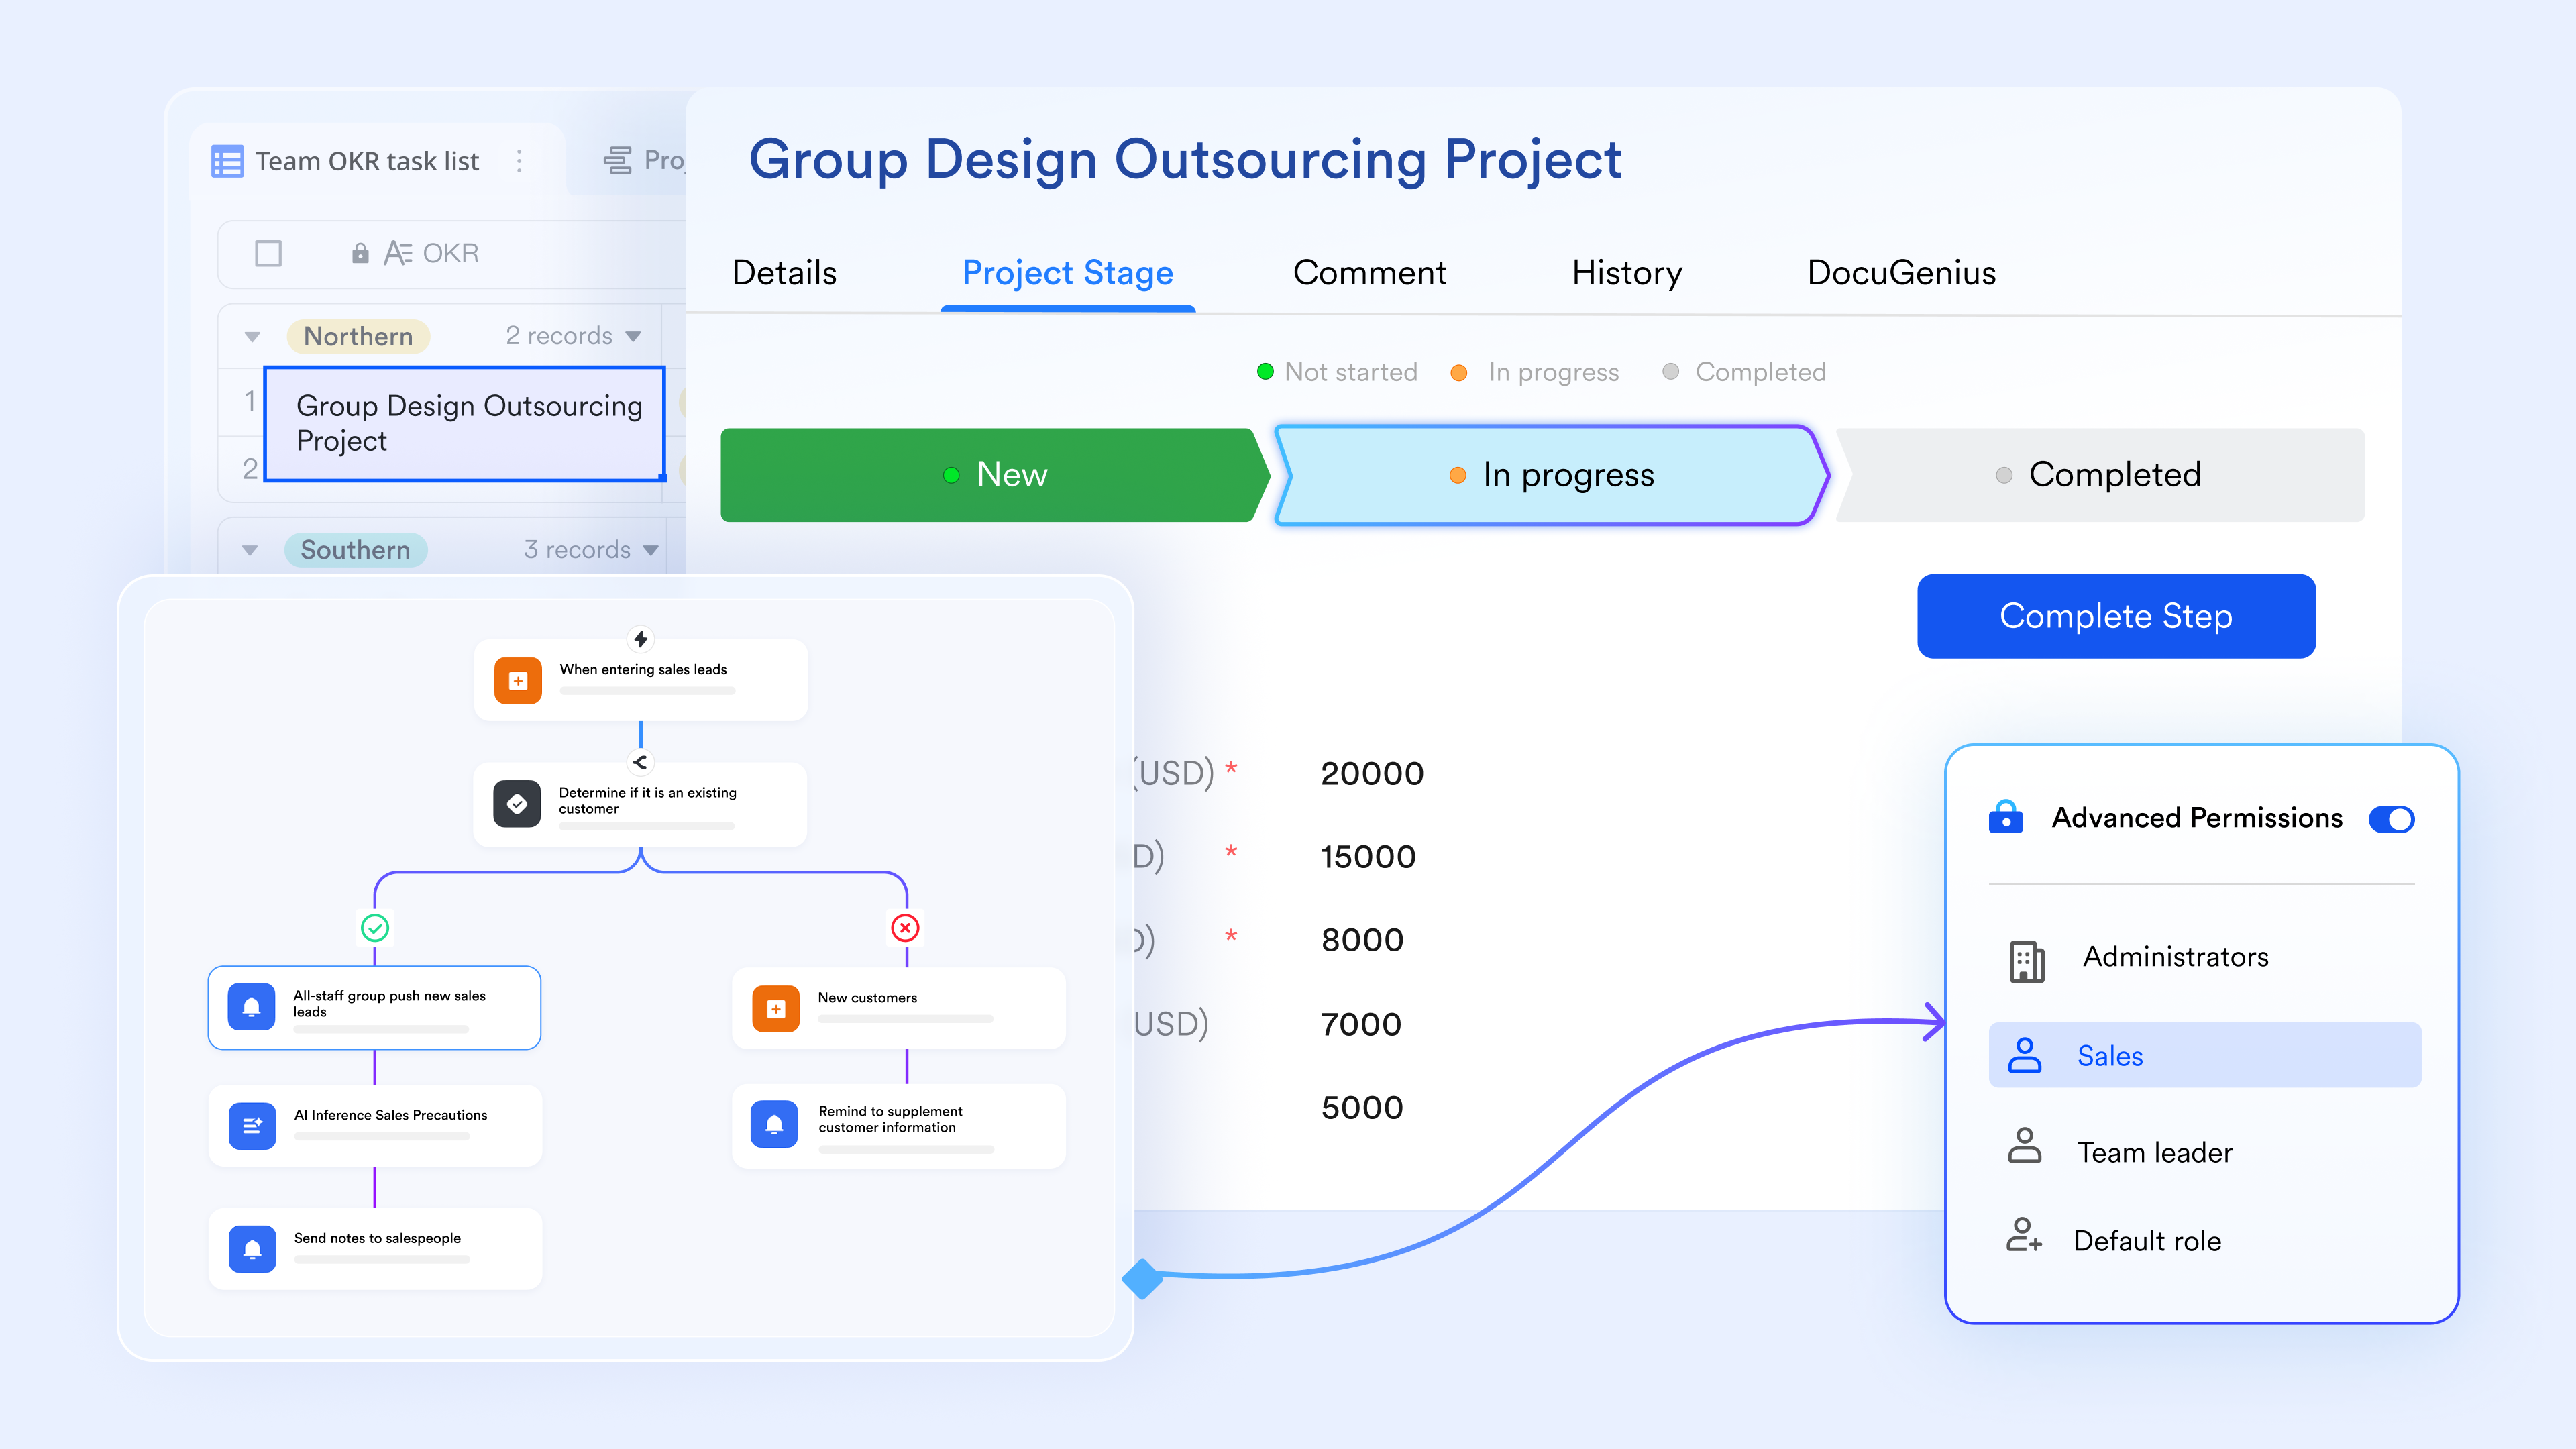
With the Lark Base dashboard, project managers can easily visualize key project data through various chart types (column, bar, line), enabling quick, multi-dimensional analysis. It offers a centralized view of project progress, resource allocation, and milestone tracking. The dashboard also features ranking blocks for objective comparisons of project performance, helping identify patterns or anomalies. Customizable user permissions ensure that managers can access all data, while team members stay focused on their specific projects
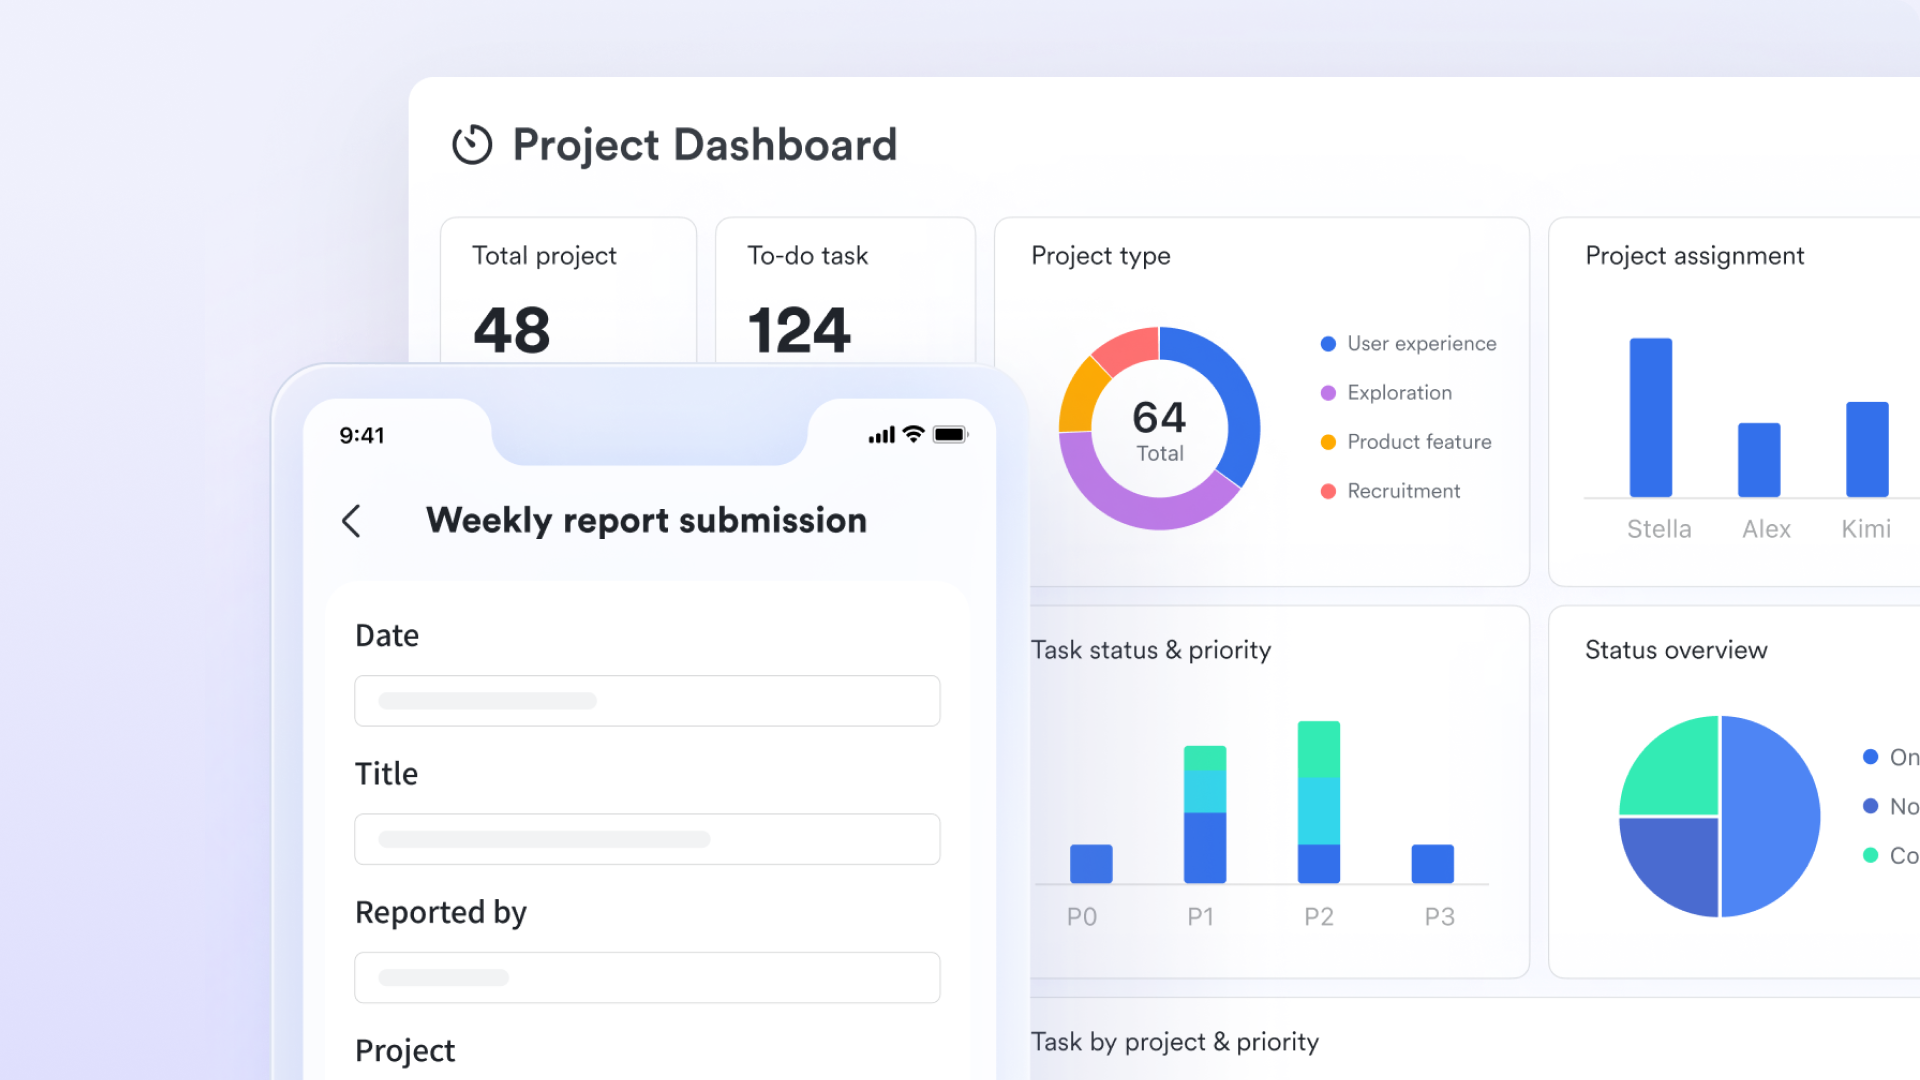
Turning strategic initiatives into actionable work
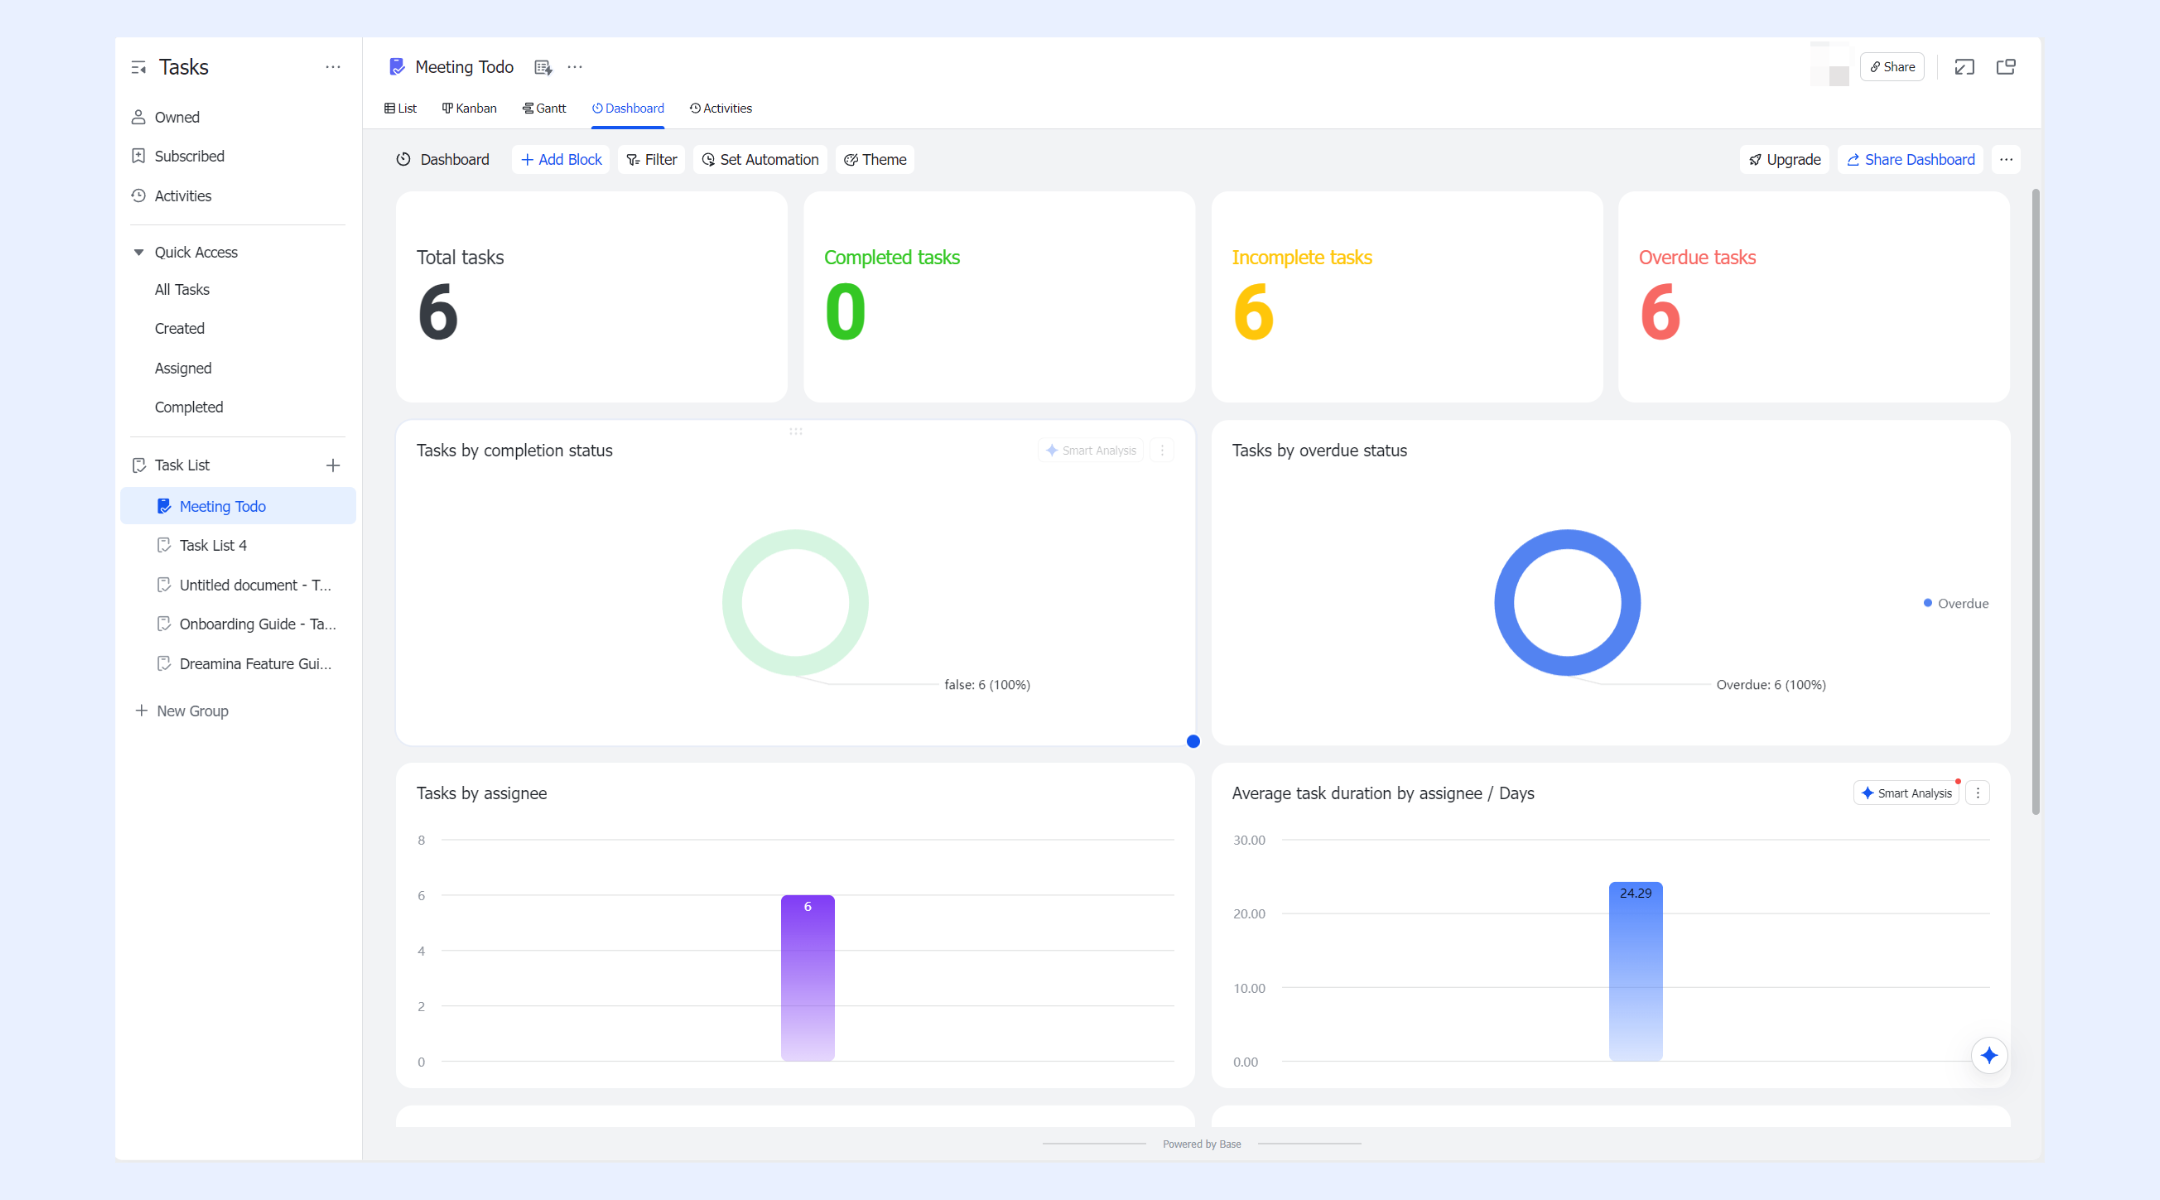
Task list dashboard allows users to visualize and manage task data. It enables customizable charts, filter conditions, and automations, syncing seamlessly with a linked Lark Base stored in My Space or Drive > My Folders. Collaborators can view the dashboard but may need to request access to the linked Base if not already permitted. This feature streamlines task tracking and enhances workflow management within the Lark ecosystem.
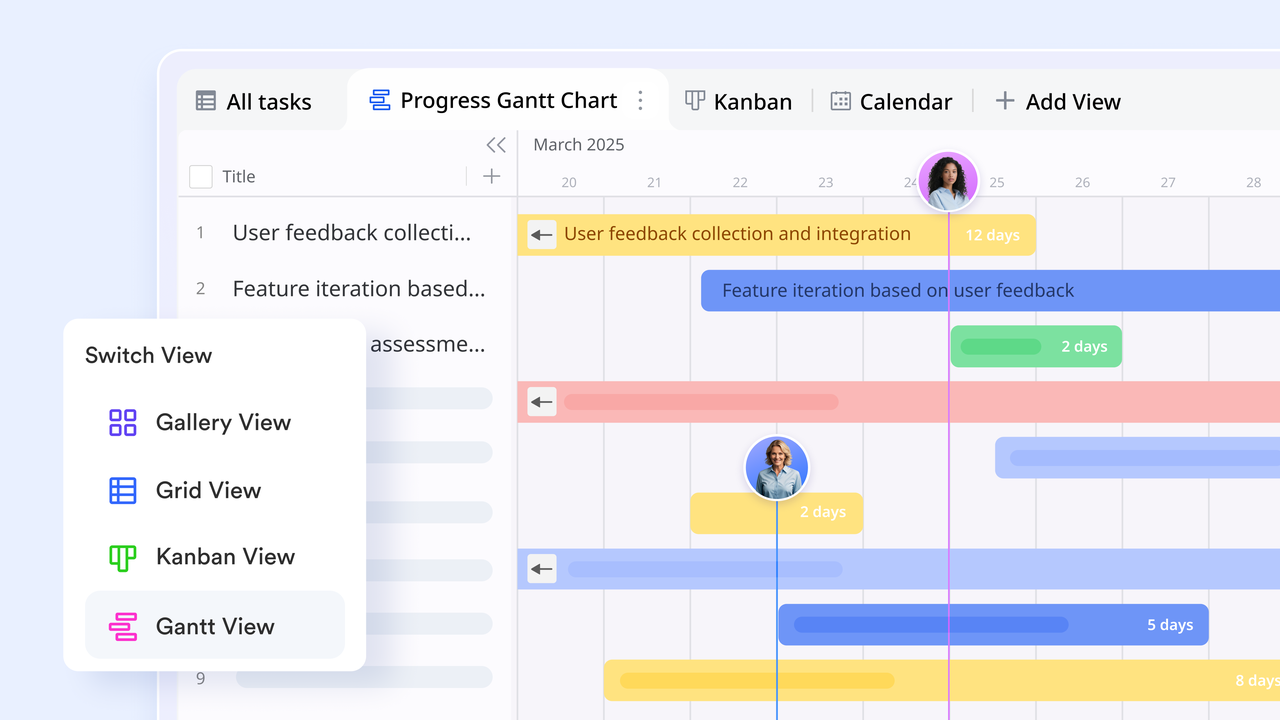
A structured, adaptable portfolio registry
Lark Base views streamline project portfolio management with multiple perspectives. The Gantt View lets you visualize timelines, set milestones, and track task progress with progress bars. The Calendar View provides a quick overview of tasks and schedules, with day, week, and month views. Additionally, Kanban and other views allow you to manage multiple projects efficiently from different angles.
A workflow engine for consistent portfolio operations
Lark Base automations support project portfolio management by automating key tasks. You can set up notifications to remind team members about progress reports or upcoming tasks, ensuring timely updates. Automations also create events, tasks, and groups based on project data, boosting efficiency. Syncing project tasks with the Lark Calendar helps track timelines and responsibilities, while multiple tables and views allow you to organize and monitor progress from different perspectives.
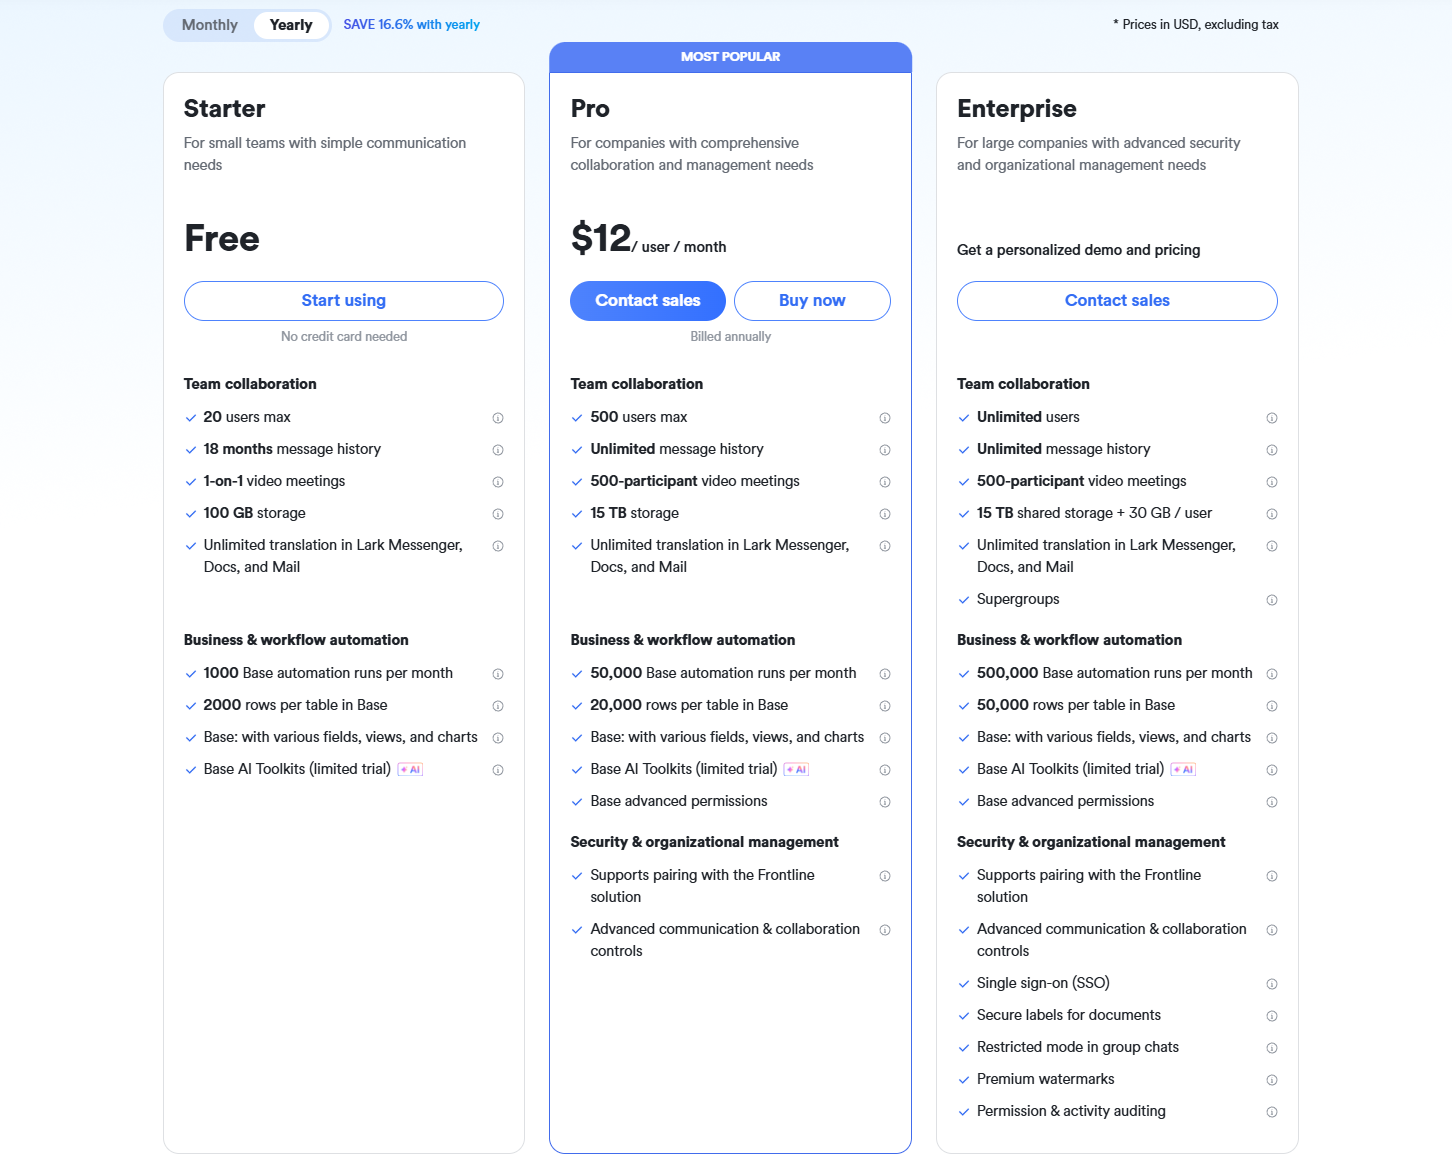
- Starter plan: Free forever plan that includes 11 powerful tools for up to 20 users. It also comes with 100GB of storage, 1000 automation runs, AI translations, and more.
- Pro plan: $12/user/month (billed annually) for up to 500 users. It includes everything in Starter plus group calling for up to 500 attendees, 15TB of storage, 50,000 automation runs, and more.
- Enterprise plan: Contact sales for custom pricing. Supports unlimited users and includes even more automation runs and advanced security, compliance, and management features.
Ready-to-use project portfolio templates in Lark
Ready-to-use project portfolio templates in Lark make it easier for teams and PMOs to begin structured portfolio management without building everything from scratch. These templates provide standardized fields, dashboards, and views that help maintain consistency across projects. They also support fast setup, reducing the time needed to organize data, track progress, and create reports. With built-in automation and collaboration features, teams can manage updates in real time. Lark's templates offer a practical starting point for organizations seeking clarity and alignment across their project portfolios.
Project portfolio management
A project portfolio management template provides a unified structure for tracking project health, timelines, budgets, and risks in one place. It helps PMOs and leaders evaluate priorities, allocate resources, and compare performance across initiatives. The template streamlines reporting, so teams don't have to build dashboards manually. It also supports consistent decision-making by offering clear visibility into overall portfolio performance.
Portfolio template
A portfolio template provides a centralized view of all active projects, allowing teams to monitor timelines, budgets, risks, and outcomes in one unified space. It standardizes how project data is captured, making comparisons and reporting faster and more accurate. Leaders can quickly assess overall portfolio health and identify where attention or resources are needed. This template helps maintain alignment across departments while improving visibility and control over ongoing initiatives.
Carbon management project portfolio
A carbon management project portfolio template helps organizations track sustainability initiatives, emissions-reduction projects, and compliance efforts in a single, structured view. It consolidates metrics such as carbon savings, project impact, timelines, and cost efficiency to support better decision-making. Teams can compare progress across initiatives and identify which actions deliver the most significant environmental benefit. This template ensures transparency, alignment, and accountability in managing carbon-related goals across the organization.
Investment portfolio management
An investment portfolio management template helps teams track assets, allocations, returns, and risk exposure in a structured, centralized format. It provides a clear overview of portfolio performance, enabling smarter comparisons across investment categories and strategies. Leaders can monitor market movements, diversification levels, and forecasted outcomes to guide decisions. This template supports transparent reporting and helps maintain alignment with financial goals and risk tolerance.
Portfolio benchmarking
A portfolio benchmarking template helps organizations compare project or investment performance against internal targets or external industry standards. It consolidates key metrics such as cost efficiency, delivery timelines, ROI, and risk levels to highlight gaps and strengths. Teams can quickly identify underperforming areas and opportunities for improvement. This template supports data-driven evaluation, ensuring decisions are grounded in measurable benchmarks rather than assumptions.
Intellectual property portfolio management
An intellectual property portfolio management template helps organizations track patents, trademarks, copyrights, and other IP assets in one structured system. It centralizes key details, including status, renewal dates, jurisdictions, ownership, and commercial value. Teams can monitor upcoming deadlines, assess protection gaps, and prioritize filings or renewals. This template improves visibility, reduces administrative risk, and supports strategic decision-making around innovation and IP investments.
Real estate portfolio management
A real estate portfolio management template helps organizations track properties, leases, valuations, and operating expenses in a unified view. It centralizes key information, including occupancy status, rental income, maintenance schedules, and market trends. Leaders can compare performance across locations and identify underutilized or high-value assets. This template supports more accurate forecasting, reduces oversight gaps, and strengthens decision-making across the entire property portfolio.
Investment portfolio for gaming
A gaming investment portfolio template helps track funding across gaming studios, titles, genres, and development stages in a single, structured dashboard. It captures key metrics, including projected returns, market potential, production timelines, and risk levels. Investors can compare performance across game concepts and platforms to prioritize the strongest opportunities. This template supports more intelligent decision-making by combining financial insights with creative and market-driven indicators.
Best practices for maintaining a project portfolio dashboard
Maintaining a project portfolio dashboard requires consistent data discipline, clear ownership, and ongoing refinement to keep insights reliable. A well-maintained dashboard improves decision-making, strengthens PMO processes, and provides visibility across all initiatives. Regular updates ensure stakeholders always see accurate, real-time information rather than outdated snapshots. Standardizing structure and visuals also helps teams interpret metrics with ease. With the proper practices, the dashboard remains a dependable source of truth for the entire organization.
- Keep data standardized across projects: Standardized fields ensure every project follows the same structure, reducing confusion and inconsistencies. This makes cross-project comparison faster and more accurate. It also strengthens reporting discipline across departments. Uniform data supports clearer, portfolio-level insights.
- Refresh dashboards automatically: Automation prevents manual delays and ensures leaders consistently access real-time metrics. Scheduled updates reduce the risk of errors and inconsistencies. Teams spend less time preparing reports and more time analyzing outcomes. Automated refreshes maintain a constantly reliable dashboard.
- Use filters to support multiple stakeholder groups: Filters let PMOs, executives, and team leads view only what matters to them. This improves relevance by tailoring insights to their role. It reduces noise and keeps reviews focused. Customized visibility enhances decision-making across the portfolio.
- Prioritize clarity over quantity of metrics: Too many metrics can overwhelm stakeholders and bury meaningful insights. Clear, focused dashboards make trends easier to spot and interpret. Prioritizing essential KPIs helps teams act faster. Simplicity ensures the dashboard remains practical and usable.
- Align dashboards with PMO governance: Dashboards should reflect governance standards, reporting cadence, and escalation rules. This creates consistency across all project reviews. Alignment also strengthens accountability and portfolio oversight. A governance-linked dashboard supports smoother portfolio operations.
- Periodically audit data accuracy: Regular audits ensure data remains correct, timely, and aligned with project updates. Audits help identify gaps, outdated entries, or inconsistencies. This keeps dashboards trustworthy for leadership decisions. Accurate data protects the integrity of portfolio reporting.
Why project portfolio dashboards matter
Project portfolio dashboards matter because they give organizations a clear, connected view of how all projects perform collectively rather than in isolation. With a single source of truth, teams can coordinate delivery, anticipate issues, and allocate resources effectively. These dashboards also improve transparency by showing trends across programs, departments, and timelines. Whether built internally or using a project portfolio dashboard template, they help organizations standardize reporting and strengthen governance.
- Aligning projects with organizational goals: Dashboards ensure every project contributes to strategic priorities by showing alignment, benefits, and value delivery in one view. Leaders can quickly identify low-impact work or duplicated efforts and redirect resources where they matter most. This matters, especially when evaluating project portfolio management dashboard examples used by high-performing PMOs.
- Tracking budget, resources, and progress in real time: By consolidating financials and capacity data, dashboards make it easier to compare planned versus actual performance. Teams can monitor burn rates, resource allocation, and schedule adherence without manual tracking. Real-time insights reduce waste and prevent unexpected variances.
- Spotting risks early across programs and portfolios: Dashboards surface cross-project risks that might otherwise go unnoticed. Patterns such as repeated delays, resource shortages, or critical dependencies become clearer. An executive project portfolio dashboard often highlights these issues to help leaders intervene early and avoid cascading delays.
- Improving reporting speed and accuracy: Replacing manual spreadsheets with automated reporting ensures consistency and reduces errors. Dashboards update instantly as teams work, providing PMOs and executives with current, reliable data. Tools like a Power BI project portfolio dashboard can further enhance visualization and analysis.
- Supporting leadership with data-driven decisions: Leaders can compare performance, evaluate trade-offs, and make informed choices based on accurate insights. Dashboards highlight where to accelerate investment, where to pause work, and which teams need support. This strengthens strategic decision-making across the entire portfolio.
Conclusion
A well-designed project portfolio dashboard gives organizations the visibility, structure, and control needed to manage multiple initiatives effectively. By standardizing data, tracking key metrics, and adopting clear visualizations, teams can evaluate performance, spot risks early, and ensure strategic alignment across the portfolio. Different dashboard types—whether for executives, PMOs, or financial oversight—help serve the unique needs of each stakeholder group. Building and maintaining the dashboard with automation, filters, and alignment with governance ensures long-term reliability and ease of use. For teams looking to streamline this entire process, Lark offers ready-to-use templates, real-time collaboration, and dashboards that simplify portfolio reporting. It's a practical way to elevate clarity, coordination, and decision-making across your projects.
FAQs
What's the difference between a project dashboard and a project portfolio dashboard?
A project dashboard focuses on the progress, tasks, and risks of a single project, while a project portfolio dashboard aggregates multiple projects to show organizational performance as a whole. Portfolio dashboards highlight cross-project dependencies, resource distribution, and overall strategic alignment. They help leadership understand priorities and trade-offs across programs. Tools like Lark make this distinction easier to manage by connecting project-level data with portfolio-wide visibility in one workspace.
How often should a project portfolio dashboard be updated for accuracy?
A portfolio dashboard should ideally refresh in real time or at least daily, depending on how dynamic the projects are. Fast-moving teams benefit from continuous updates that reflect changes in tasks, budgets, and risks. Automated syncing prevents outdated insights and reduces manual reporting work. With platforms like Lark, data stays live across functions, documents, and portfolio tables, ensuring decisions are always based on current information.
Can executives and PMOs use different dashboard views for the same data?
Yes, and this is one of the main advantages of a flexible project portfolio dashboard. Executives need high-level summaries, while PMOs need detailed risk, resource, and delivery views. Using filters, roles, and custom layouts enables you to serve each audience without duplicating data. Lark supports this through customizable views in Base and Tasks, ensuring every stakeholder sees the information most relevant to their responsibilities.
What tools are best for creating automated project portfolio dashboards?
The best tools support real-time data, automation, customizable metrics, and integration across project workflows. BI platforms like Power BI and project systems like Lark enable teams to connect tasks, budgets, documents, and approvals into one automated reporting structure. Automation helps reduce manual updates, trigger notifications, and maintain consistent governance. Platforms like Lark are handy because they combine dashboards, collaboration, and execution tools in a single environment.
How do I choose the right KPIs for my project portfolio dashboard?
Start by aligning KPIs with organizational strategy, portfolio goals, and expected outcomes. Common choices include delivery timelines, budget performance, resource utilization, risks, and benefits realization. The best KPIs reveal trends, support decision-making, and highlight where intervention is needed. Lark makes KPI management easier by letting teams link data across Base, Tasks, and Docs, ensuring metrics stay consistent and automatically updated across the portfolio.
Related reading
Project portfolio management software: Align strategy, pick the right bets, deliver measurable value
Table of contents
Start using Lark today

Manage all your work in one place
Boost team efficiency by 10x
Save up to 70% on software costs
Table of contents
Start using Lark today
Manage all your work in one place
Boost team efficiency by 10x
Save up to 70% on software costs
Keep reading







2026 Lark Technologies Pte. Ltd.
Headquartered in Singapore with offices worldwide.






Explore: