Effectively planning and executing projects can be a daunting task, especially when dealing with uncertainty and complex interdependencies. This is where PERT project management (Program Evaluation and Review Technique) comes into play. But what is PERT project management exactly? It's a methodology designed to analyze and represent the tasks involved in completing a project, emphasizing the time required for each task to improve project delivery. With its focus on understanding task relationships and accommodating variability in task durations, PERT provides project managers with a strategic edge.
In this article, we'll explore the fundamentals of PERT, how it differs from other project management techniques, and the practical benefits of incorporating PERT charts into your project planning toolbox.
Streamline your project management today
What is PERT in project management?
The Program Evaluation and Review Technique (PERT) is a project management tool designed to analyze and represent the tasks involved in completing a given project. PERT is created to facilitate the management of complex projects, ensuring that they could be completed on time and .
At its core, PERT focuses on the relationships between tasks, the estimated times for their completion, and the involved. It allows project managers to visualize how various tasks interconnect and how delays in one area might impact the overall timeline.
One of the defining features of PERT is its use of a statistical approach to time estimation. It employs three different time estimates for each task involved in a project:
- Optimistic estimate: The shortest time in which the task could be completed.
- Pessimistic estimate: The longest time the task might take if everything goes wrong.
- Most likely estimate: The most realistic time the task will likely take.
Using these estimates, PERT calculates a weighted average to determine the expected duration for each task. This statistical method helps project managers make informed decisions and prepare for potential uncertainties, which is essential in any project management scenario.
Benefits of using PERT in project management
When it comes to , employing the right tools can significantly enhance the planning and . The Program Evaluation and Review Technique (PERT) offers several benefits that make it an essential methodology for project managers. Here are the key advantages of using PERT in project management:
- : PERT enhances time management by providing a clear structure for estimating task durations. By incorporating optimistic, pessimistic, and most likely time estimates, you can develop a realistic timeline that accommodates uncertainties.
- Better risk assessment: The statistical approach of PERT allows project managers to identify potential risks associated with task durations. This proactive identification helps with planning and mitigating potential delays before they occur.
- Enhanced project planning: PERT provides a visual roadmap through detailed charts that outline tasks and dependencies. This clarity facilitates effective planning, making it easier for team members to understand their roles and responsibilities.
- : By using PERT charts, project managers foster better communication among team members and stakeholders. These visual tools ensure everyone understands project timelines and task relationships, driving collaboration toward shared goals.
- Increased accountability: Clearly defined tasks in PERT charts promote accountability. Team members can track their responsibilities and deadlines, leading to higher productivity and a greater commitment to staying on schedule.
In summary, using PERT in project management offers a range of benefits, from improved time management and risk assessment to enhanced planning and collaboration. By implementing PERT, project managers can navigate complex projects more effectively, leading to greater success and satisfaction.
Embrace these benefits with the right tool
Key components of PERT
Understanding the key components of PERT is crucial for applying this methodology effectively in project management. At its core, PERT is composed of several essential elements that work together to create a comprehensive framework for . Here are the primary components you should be familiar with:
PERT chart structure
A PERT chart is the visual representation of the PERT methodology. It typically consists of nodes (or circles) that represent project tasks and directed arrows that illustrate the dependencies between these tasks. The chart can take various forms but generally aims to provide a clear view of how tasks interrelate and their respective timelines.
Task identification
Each task involved in the project must be clearly defined and identified. This includes not only the main tasks but also any sub-tasks that may need to be completed. Clear task identification of the project is accounted for within the PERT chart. You can use the following template to record all tasks you should pay attention to.
Time estimates
As previously mentioned, PERT employs three different time estimates for each task:
- Optimistic estimate: The minimum time required to complete the task under ideal conditions.
- Pessimistic estimate: The maximum time required to complete the task if everything goes wrong.
- Most likely estimate: The time required to complete the task under normal circumstances.
These time estimates feed into calculations that provide a more accurate expectation of task duration.
Task dependencies
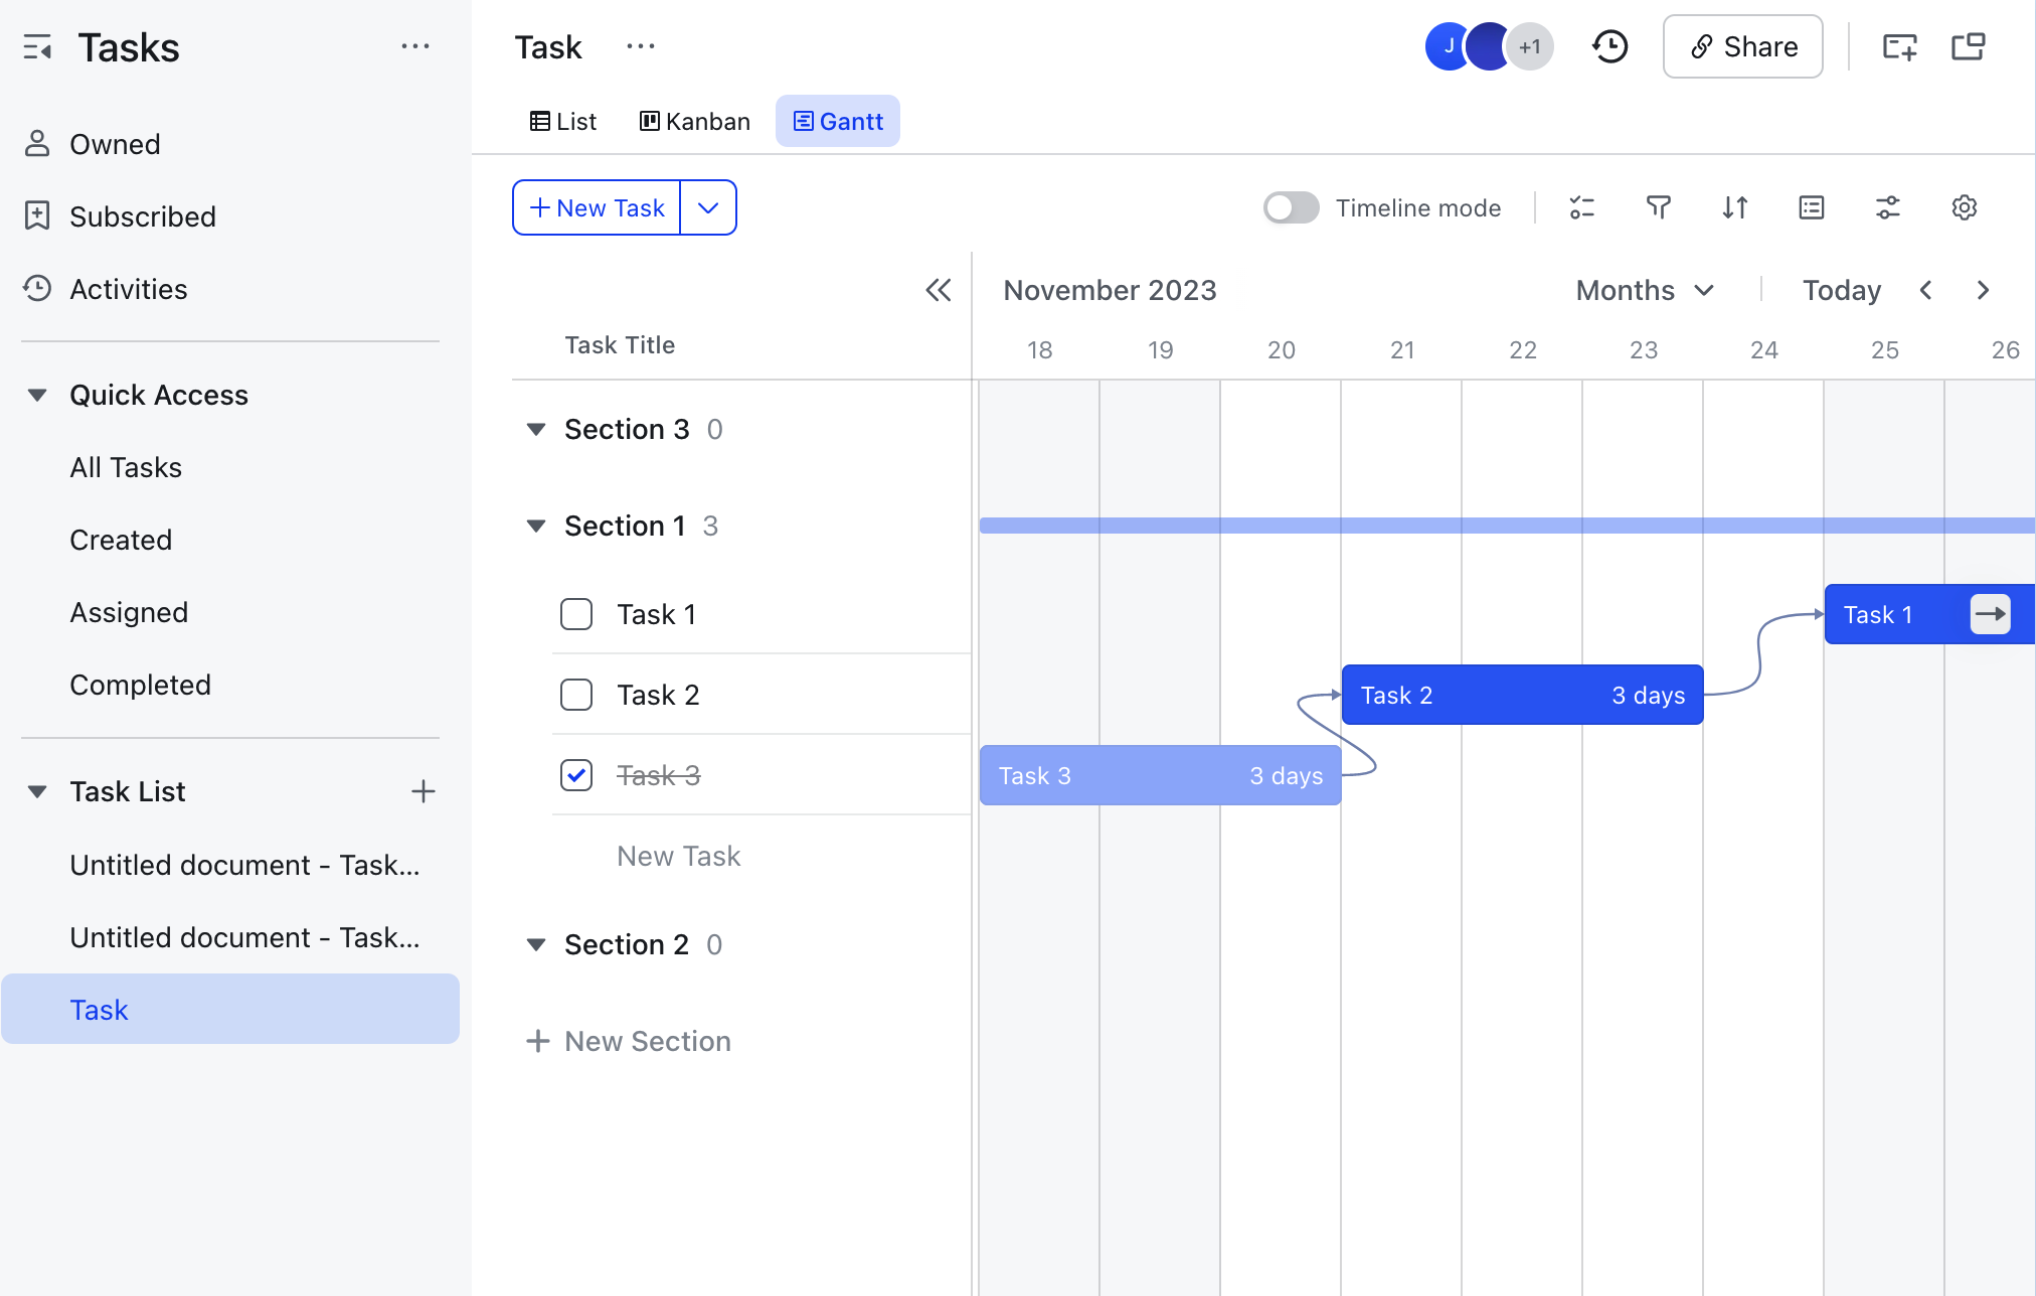
is crucial within PERT. Some tasks cannot begin until others are completed, forming a sequence known as the project network. Identifying these dependencies allows project managers to determine the project's critical path—the sequence of tasks that must be completed on time to prevent delays in the overall project. With features like Lark Tasks, you can get your thoughts straight because it is able to visualize your task dependencies.
Critical path
The critical path is a key concept in PERT that outlines the longest path through the project network. It highlights the tasks that directly impact the project completion time. By focusing on the critical path, project managers can prioritize efforts and resources on these essential tasks to ensure timely project delivery.
Float time
Float time, also known as slack time, refers to the amount of time a task can be delayed without affecting the overall . By understanding which tasks have float time, project managers can make informed decisions about and prioritize tasks based on urgency and importance.
Feedback mechanisms
Feedback loops are crucial for updating the PERT chart as the project progresses. Regular reviews and updates allow project managers to adapt to any changes in timelines or task completion rates, keeping the PERT analysis relevant throughout the project's lifespan.
Understanding these key components of PERT will empower you to utilize this methodology effectively. By incorporating PERT charts into your project planning processes, you enhance your ability to manage tasks, timelines, and resources with greater efficiency.
How to create a PERT chart
Creating a PERT chart is a straightforward process that involves several steps to ensure all project tasks, timelines, and dependencies are accurately represented. Here's a detailed guide on how to create a PERT chart for your project to increase efficiency and collaboration.
Step 1: Identify your project's objectives and deliverables
Before diving into the specifics of creating a PERT chart, start by and deliverables. Understanding what you aim to achieve will guide the identification of major tasks and milestones required for completion. Using the following template can help you record your project's objectives and deliverables easily.
Step 2: Determine task dependencies and sequences
This is the core of PERT. For each task, ask: “What must be finished before this can start?” Dependencies create the project's logical flow. Common types are Finish-to-Start (Task B cannot start until Task A finishes) and Start-to-Start (Task B can start once Task A starts).
Step 3: Estimate time durations
For each task, generate time estimates using the three-point estimation technique:
- Collect optimistic, pessimistic, and most likely time estimates for each task from team members or stakeholders.
- Use these estimates to calculate the expected duration for each task using the PERT formula: TE = (O+4M+P)/6
where:
- O = optimistic time estimate
- M = most likely time estimate
- P = pessimistic time estimate
Step 4: Create the PERT chart
With tasks, dependencies, and estimated durations defined, you can start building your PERT chart. Traditionally, this uses nodes (circles or rectangles for tasks) and arrows (showing dependencies).
- Place your starting node.
- Draw nodes for each task, placing them in sequential order.
- Connect nodes with arrows to show dependencies.
- Inside each node, note the task ID, name, and expected time.
For a more dynamic and collaborative version, you can use Lark Boards. Each task becomes a card that can be linked with connection lines to show dependencies. Cards can be moved visually, and details like time estimates and owners can be stored within them, creating a living chart the entire team can update and discuss. Step 5: Identify the critical path
With all tasks and dependencies mapped out, identify your project's critical path. This step involves determining the longest path through the PERT chart, identifying tasks that directly impact the project duration. Highlight these tasks to indicate their importance.
Step 6: Review, update, and communicate
A PERT chart is not a one-time artifact. As the project progresses, update task statuses, revise estimates based on new information, and communicate changes. Hold regular check-ins to review the chart. Has the critical path shifted? Are tasks taking more or less time than estimated?
This is where unification shines. In a , your chart and data become the single source of truth. Team members can update their progress directly, and you can share the live Board or a dashboard view in a chat group to keep everyone aligned with the latest project status.

Create your PERT chart in action
Use Lark to master PERT project management
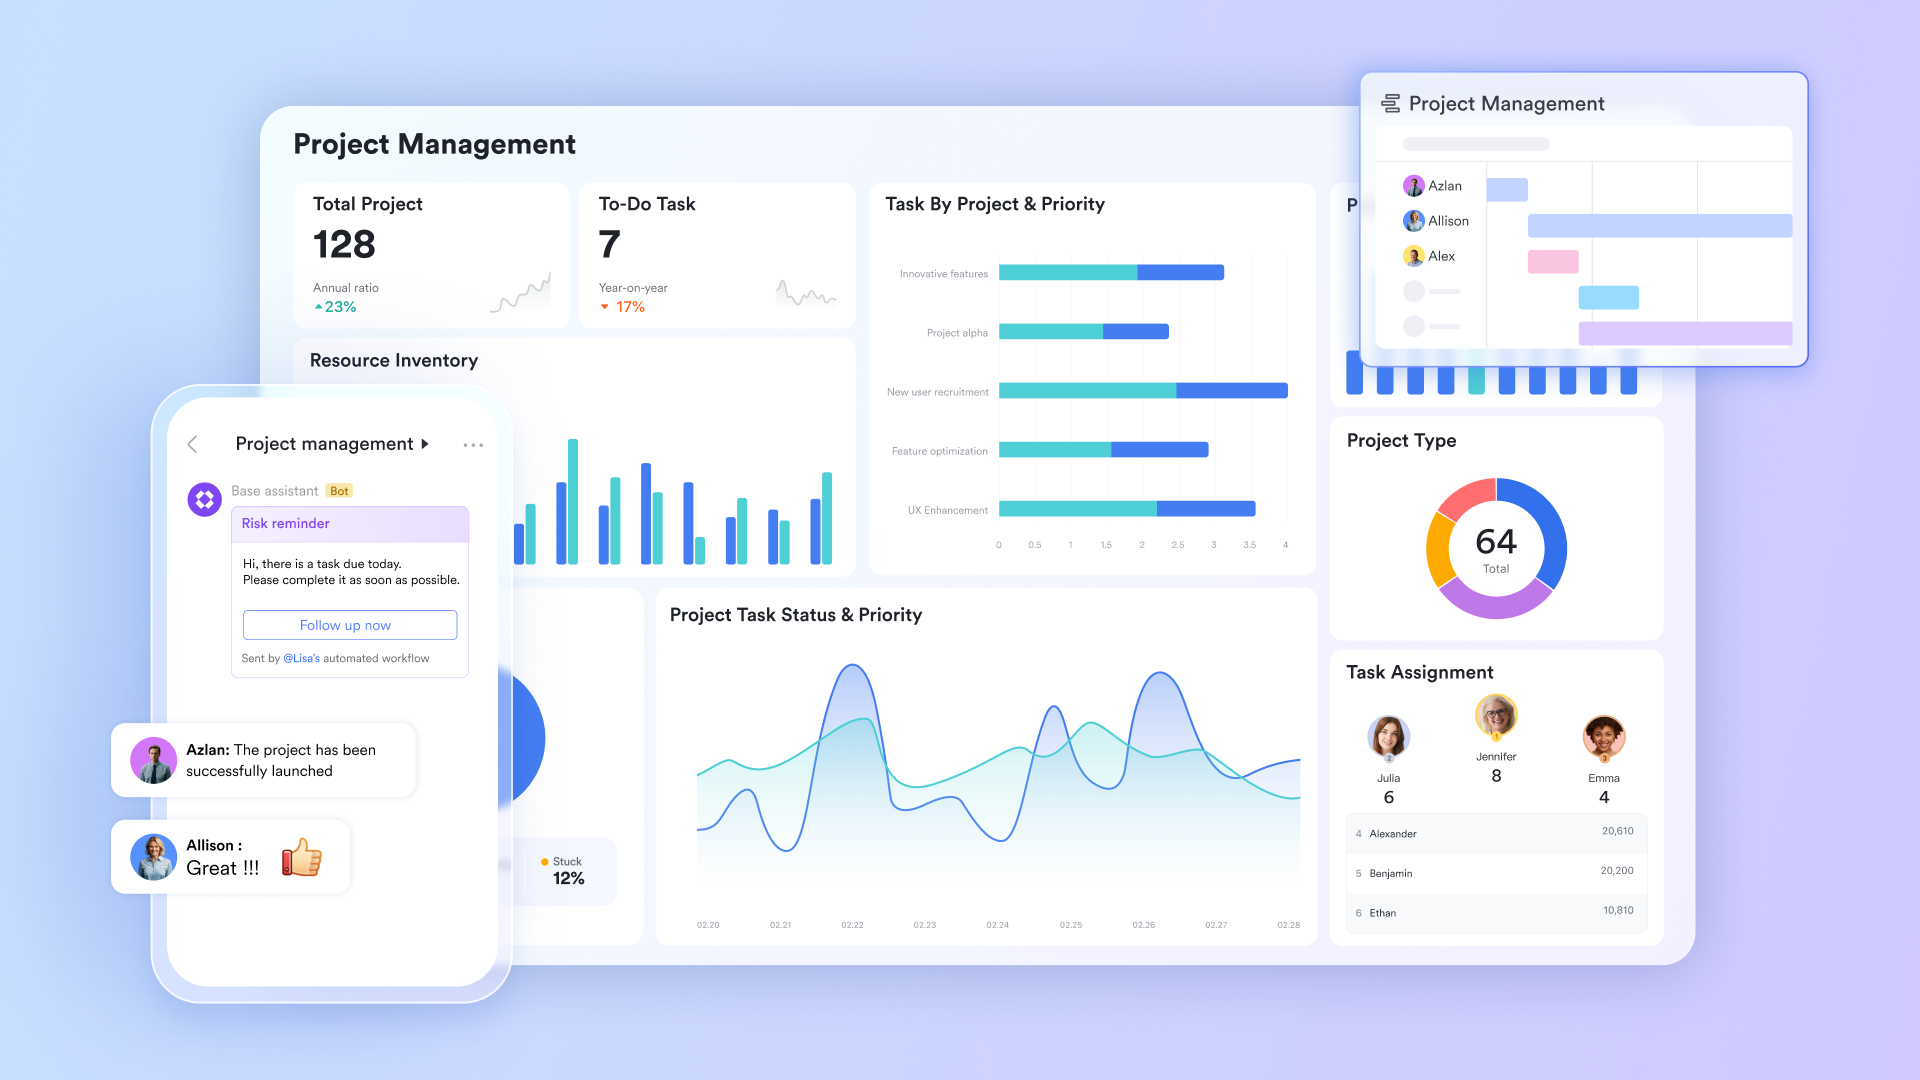
A PERT chart is far more than a static diagram — in practical project management, you need to apply it dynamically. And here, leveraging that enhance this process can make a significant difference. While traditional tools often make this approach static and complex, transforms this experience by combining the entire process—from data collection to real-time tracking—in one collaborative platform. Turn complex PERT theory into an actionable living plan your team can execute together.
Streamline task management
A core strength of Lark is its well-developed task management system, which provides crucial support for the effective implementation of the PERT. When creating a PERT chart, you can break down complex projects into manageable tasks and subtasks within Lark Tasks, aligning perfectly with PERT methodology. Each task can be assigned to specific team members with clear deadlines, ensuring everyone understands their responsibilities. More importantly, Lark Tasks allows you to establish clear dependency links between these tasks. When you switch the view to the Gantt chart, its visual interface helps team members intuitively grasp task flow logic and dependencies. These dependencies are presented visually with arrows, automatically generating the project's network diagram. This is essential for efficiently managing the project timeline. 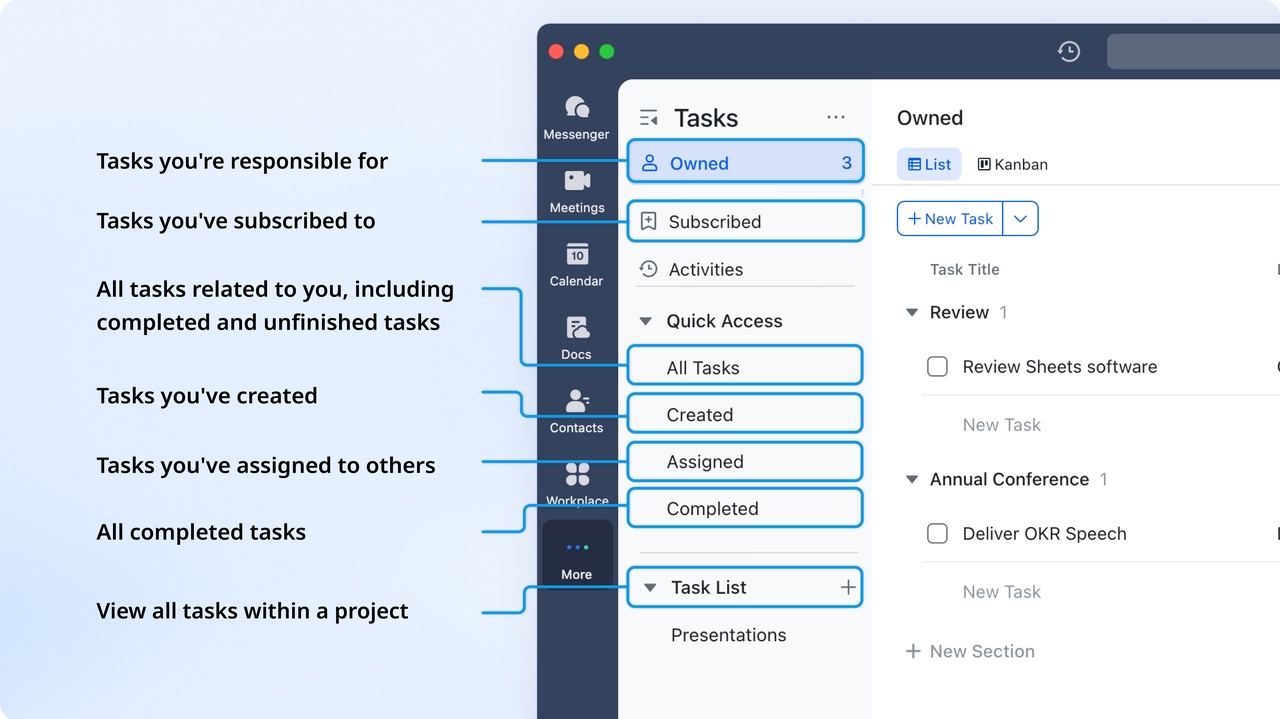
Dynamically calculate and visualize the critical path
Identifying the critical path is central to PERT. In , this no longer requires manual calculation. After you set up separate fields in the Base to record the optimistic, most likely, and pessimistic durations for tasks, you can use formula fields (such as applying the PERT formula: (Optimistic + 4 * Most Likely + Pessimistic) / 6) to automatically calculate the expected duration. By analyzing the sequence of tasks with zero or the smallest total float, you can quickly identify the project's critical path. You can highlight these critical tasks on the Gantt chart using custom colors or labels, keeping the entire team highly focused on the project's lifeline. 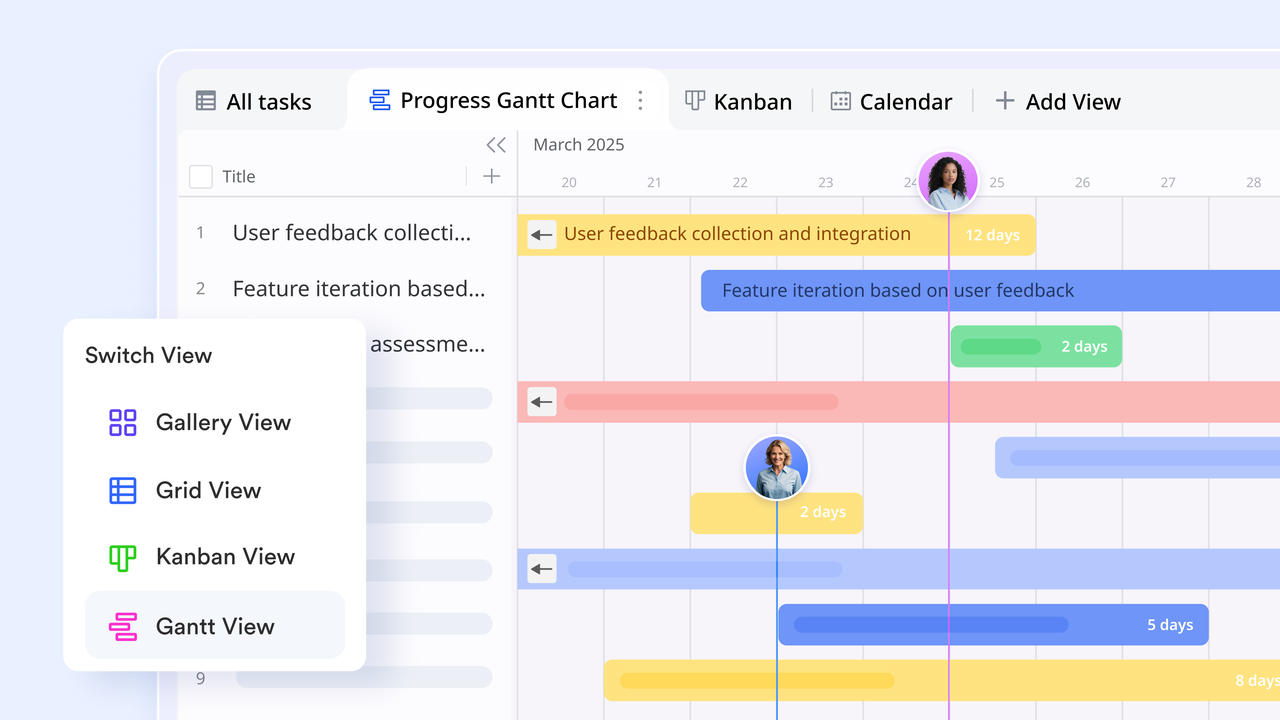
Monitor project progress and risks with real-time data
The value of PERT lies in responding to change. After the project launches, you can use the same Base table for dynamic tracking.
Add fields like "Actual Start Time" and "Completion Percentage" for each task in the Base. When responsible persons update the progress percentage or dates, the entire Gantt chart and timeline are automatically updated in real-time. By comparing this against the initial three-point estimation baseline, you can clearly see which tasks are deviating from the plan. For delays in tasks on the critical path, automation rules can be set—for example, to automatically send notifications to the project group or the responsible person—enabling risk alerts and shifting management from reactive response to proactive intervention. 
Collaborate on visualizing the PERT chart
supports real-time team collaboration on PERT charts, ensuring all relevant parties are synchronized. You can also embed references to Lark Sheets within Docs to interactively present project tasks, dependencies, and timelines. Multiple team members can participate in editing the chart simultaneously, offering input on task durations and dependencies. This collaborative visual workspace allows all project participants to see chart changes in real-time, helping the team make faster decisions and adjust plans promptly. Managing PERT charts visually through Lark effectively enhances communication efficiency and information transparency within the project team.

Foster collaborative estimation and knowledge retention
The three-point estimation in PERT itself requires pooling collective wisdom. Lark's collaboration features make this process more efficient and transparent.
You can directly @mention relevant members within task records to invite their comments on time estimates or share discussion links in project group chats for quick synchronization. After project completion, all historical estimates, actual data, and critical path analysis results can be saved with one click and archived in , forming a reusable . This provides valuable data references for estimating similar future projects, allowing team experience to be continuously accumulated and optimized.

for Lark:
- Starter plan: Free forever plan that includes 11 powerful tools for up to 20 users. It also comes with 100GB of storage, 1000 automation runs, AI translations, and more.
- Pro plan: $12/user/month (billed annually) for up to 500 users. It includes everything in Basic plus group calling for up to 500 attendees, 15TB of storage, 50,000 automation runs, and more.
- Enterprise plan: for custom pricing. Supports unlimited users and includes even more automation runs and advanced security, compliance, and management features.
For small teams with simple communication needs

18 months message history
1000 Base automation runs/month
2000 rows per table in Base
Most POPULAR
For companies with comprehensive collaboration and management needs
Unlimited message history
500-participant video meetings
50k Base automation runs/month
20k rows per table in Base
For large companies with advanced security and organizational management needs
Get a personalized demo and pricing
Unlimited message history
500-participant video meetings
15 TB storage + 30 GB storage/user
500k Base automation runs/month
50k Base automation runs/month
Most POPULAR
For companies with comprehensive collaboration and management needs
Unlimited message history
500-participant video meetings
50k Base automation runs/month
20k rows per table in Base
PERT vs. CPM vs. Gantt: What's the difference?
Understanding the differences between PERT project management, CPM, and Gantt charts is essential for selecting the right project management tool. Here's a direct comparison based on key aspects:
When to use a PERT chart
Knowing when to use a PERT chart can significantly enhance project planning and execution, particularly in situations where complexity and uncertainty dominate. Here are key scenarios when implementing a PERT chart proves beneficial:
High complexity projects: Use a PERT chart when managing projects with numerous tasks, dependencies, and variables. For example, projects in aerospace or often involve intricate tasks that rely on the completion of others before they can begin. A PERT chart can provide a clear visual representation of these dependencies, helping teams grasp how tasks interconnect.
Uncertain task durations: When your project involves tasks with uncertain durations—common in research and development projects—PERT is an ideal choice. Its ability to incorporate different time estimates (optimistic, pessimistic, and most likely) allows for more accurate planning and . By understanding potential variations in timelines, teams can prepare better contingency plans.
Resource allocation: If you need to across multiple tasks, PERT charts provide a way to visualize the project's critical path and prioritize essential tasks. By identifying which activities are crucial for project completion, you can allocate resources effectively, ensuring that high-priority tasks receive the attention they need.
Improved communication: When presenting project plans to stakeholders, a PERT chart can facilitate communication. By using a visual representation, team members and stakeholders can quickly understand tasks, their durations, and dependencies, leading to better discussions and alignment on project objectives.
Streamlining complex processes: For projects that require careful coordination between various teams or departments, PERT can help streamline processes by clarifying roles and responsibilities. Teams can clearly see who is responsible for each task and how their work impacts the project timeline, fostering collaboration and accountability.
Build your own PERT chart and master management now
Conclusion
In conclusion, understanding what PERT is in project management opens the door to more effective planning and execution of projects across various fields. By leveraging the advantages and structure that PERT provides, you can navigate uncertainties and complexities with greater confidence. For those looking to incorporate PERT into their workflows, consider using , a powerful tool that enhances collaboration and project management efficiency. By embracing these methodologies, you're one step closer to achieving your project goals successfully.
FAQs
What is a PERT chart used for?
A PERT chart is a visual tool used in project management to analyze the tasks involved in completing a project. It helps project managers understand task dependencies, estimate timeframes, and identify critical paths. Using Lark can streamline the creation and update of PERT charts, ensuring your team stays aligned.
How do you estimate task durations for PERT?
Task durations in PERT are typically estimated using three-point estimates: optimistic, pessimistic, and most likely durations. This approach helps account for uncertainty in project timelines. By utilizing Lark, teams can collaborate in real time to refine these estimates, increasing accuracy and efficiency.
Can PERT charts help identify potential bottlenecks in a project?
Yes, PERT charts are excellent for identifying potential bottlenecks as they visually represent task dependencies and timelines. By analyzing the critical path, project managers can focus on tasks that could delay the project. Lark's collaborative environment allows teams to communicate about these bottlenecks and work on solutions together.
How can you keep your PERT chart updated throughout the project lifecycle?
To keep a PERT chart updated, regular review and adjustments are necessary as project dynamics change. Incorporating project management tools like Lark can facilitate this process. With Lark, teams can easily share updates and make revisions in real time, ensuring that everyone is on the same page regarding project status and timelines.
Related reading