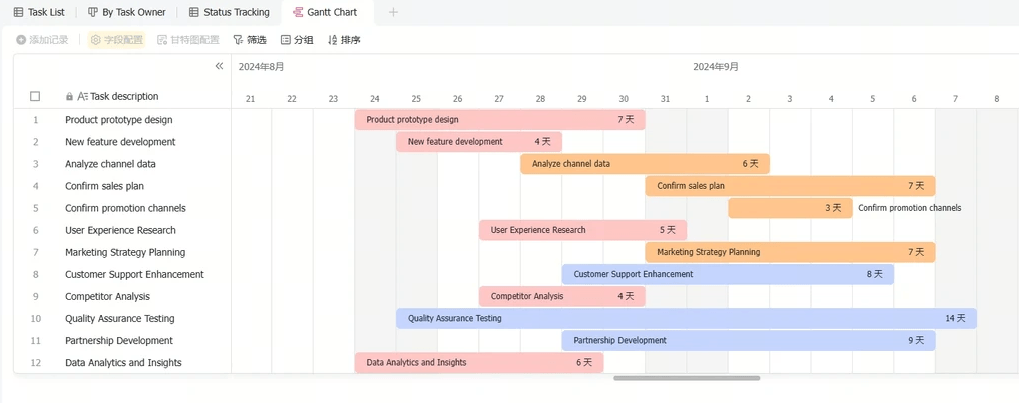
Let's admit it: building project timelines from scratch takes up time you should be spending on actual work. If you have ever dragged tiny colored blocks across a spreadsheet just to watch a single delay ruin the whole schedule, you know the frustration. A Gantt chart AI changes this dynamic. By turning simple text prompts or task lists into structured, visual timelines, you get hours of your week back. I will show you how these tools work, why standalone generators are not enough, and how to connect your automated timeline to real team execution.
What is a Gantt chart AI, and why do you need one?
At its core, a Gantt chart is a visual project management tool that maps out tasks as horizontal bars along a timeline. It gives you an immediate, clear view of start and end dates, durations, dependencies, and overall progress. Project managers have relied on them for decades to keep software development sprints, marketing campaigns, and complex operations on track.
The problem has always been the setup. Traditional methods require you to manually input every date, link every dependency, and redraw the map every time a stakeholder requests a change.
An AI Gantt chart completely overhauls this process. Instead of acting as a manual drawing tool, an AI Gantt chart generator acts as a data processor. It can read unstructured information—like meeting notes, project briefs, or a simple text list of deliverables—and automatically structure it into a comprehensive timeline.
Imagine you just finished a kickoff meeting for a new product launch. You have a raw text document detailing the phases: research, design, development, and marketing. Instead of spending your afternoon plotting these out, you feed the text into an AI gantt chart maker. The AI understands the context, recognizes that design must happen before development, and instantly generates a visual chart with all dependencies mapped out. You move straight from planning to execution.
The hidden cost of isolated timeline visualization tools
While generating a timeline in seconds feels like a massive win, I often see teams fall into a common trap. They use an impressive AI tool to build their chart, export it as a static PDF or a standalone link, and then... no one looks at it again.
Generating a chart is only step one. The actual value of timeline visualization comes from how well it guides daily work. When your timeline lives in one application, but your team discusses the project in a separate chat app, shares files in a distinct cloud drive, and tracks approvals in yet another system, perhaps even using separate , you create a disconnected environment.
This fragmentation forces your team to pay a heavy "" Every time a project phase shifts, someone has to leave their chat window, log into the separate timeline tool, manually adjust the chart, and then go back to the chat to notify the team.
The reality is that having more specialized tools often hurts productivity if those tools do not talk to each other. An AI-generated chart is just a pretty picture if it sits in a silo. For a timeline to be effective, especially for remote or hybrid teams, it needs to live precisely where the team is already communicating and collaborating. Project management should not just track work; it must connect it.
Unify timelines and teamwork with a Gantt chart today
How an AI Gantt chart generator actually works
Most professionals assume that creating a timeline requires specialized knowledge of project management software, so they look for the to simplify the process. An AI gantt chart generator removes that barrier by relying on natural language processing rather than manual data entry. When you use these tools, the system scans your unstructured input to identify core project entities: action verbs (tasks), timeframes (durations or deadlines), and names (assignees). The engine then analyzes the logical relationship between these elements to establish dependencies.
Here is how this process works in practice across common scenarios:
Use case 1: Structuring a marketing campaign from raw notes
Marketing teams often leave brainstorming sessions with a messy text document full of ideas and rough deadlines. Instead of manually translating these notes into a spreadsheet, you can paste the raw text—such as "Launch social ads by Friday, but only after John finalizes the copy on Wednesday"—directly into the AI generator. The tool reads this, identifies the finish-to-start dependency, and instantly plots the sequential timeline so the campaign is ready to execute.
Use case 2: Planning software development sprints
Technical teams deal with complex scopes and multiple overlapping phases. A product manager can input a simple bulleted list of features, bug fixes, and expected rollout dates, similar to how they might structure a . The AI gantt chart maker processes this list, categorizes tasks into structured development sprints, and visualizes the critical path. If the text specifies that "QA testing must follow front-end deployment," the AI automatically maps that physical constraint on the timeline.
Use case 3: Organizing research projects from audio transcripts
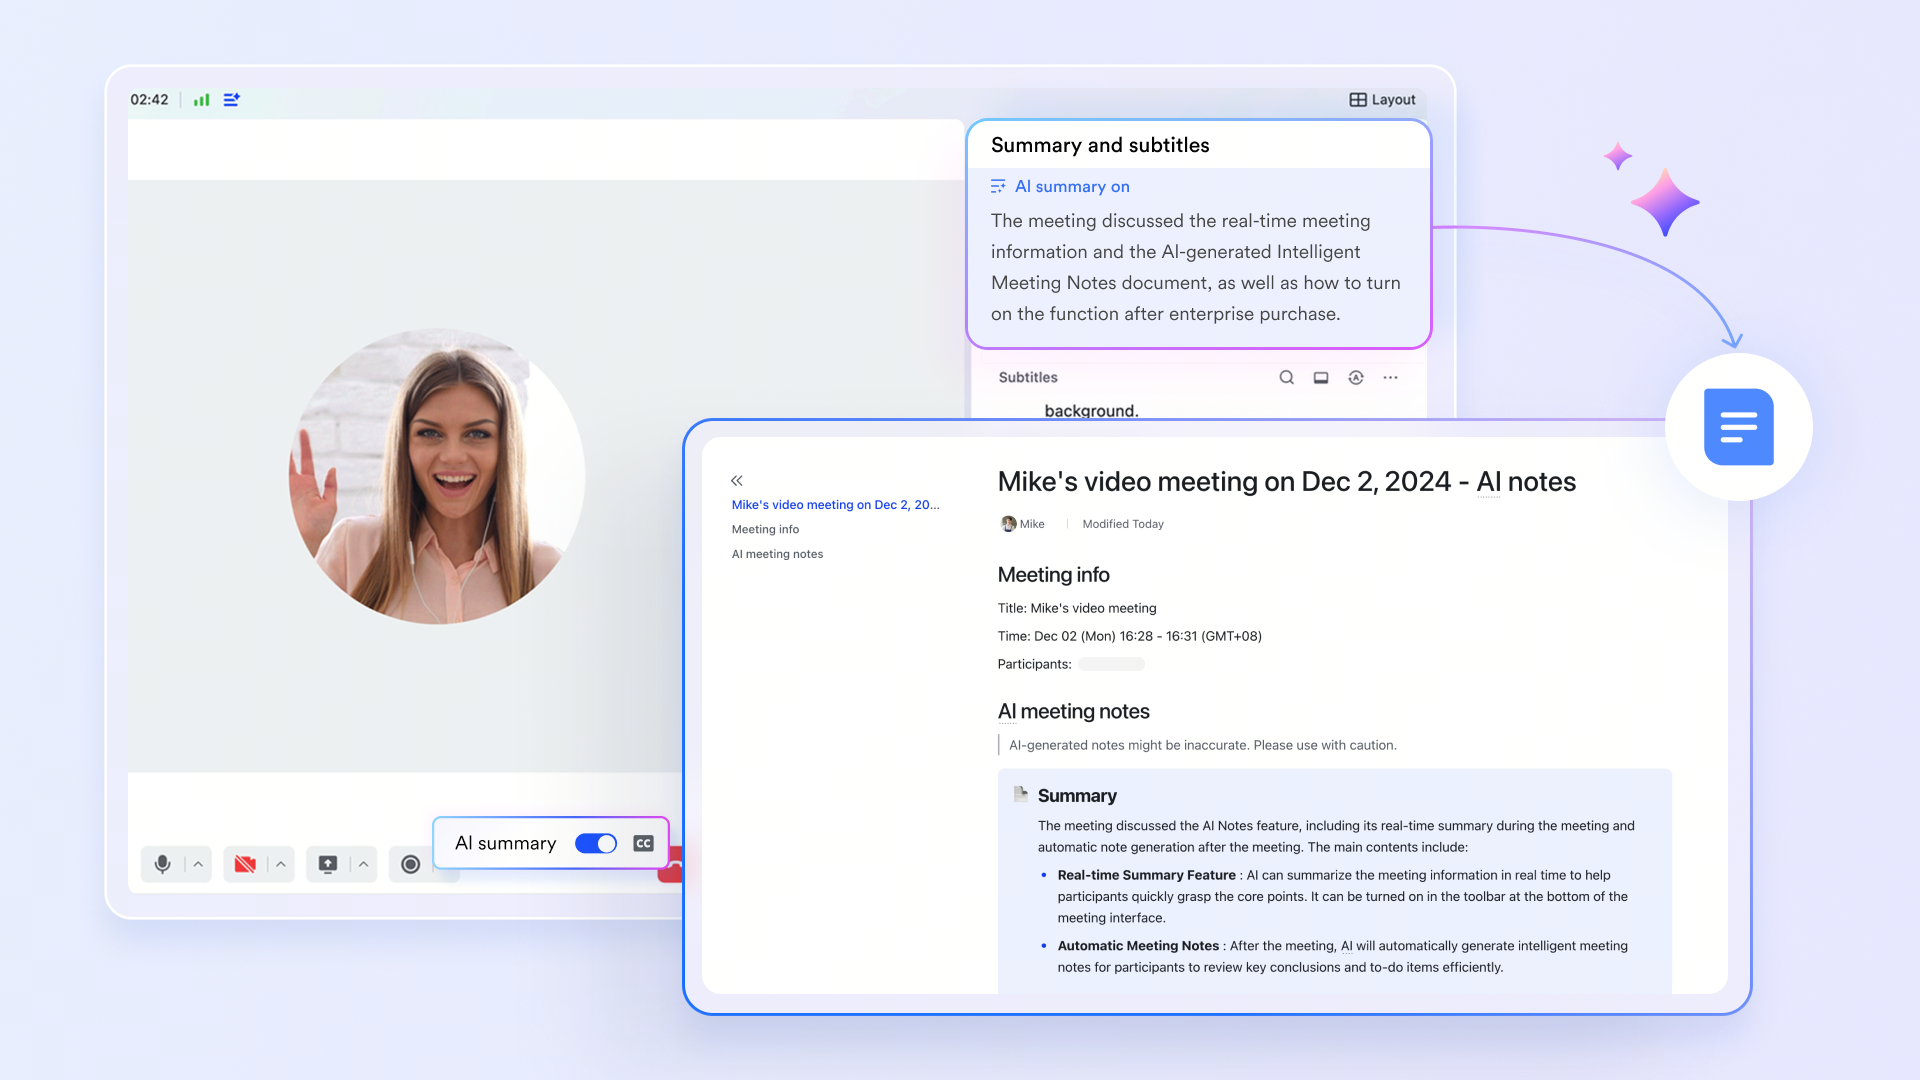
Some advanced AI tools allow users to bypass typing altogether by processing transcripts from recorded audio or video files. A research team can upload the transcript of their weekly planning meeting. The AI scans the conversation for verbal commitments like "I will finish the literature review in two weeks," similar to how , extracts those deadlines, and builds a visual timeline that keeps the entire research project on schedule.
Step-by-step: Building an automated project timeline
Transitioning from manual plotting to using an AI gantt chart maker requires a slight shift in how you prepare your project data, similar to how you would think about any . Here is a reliable framework to get you from a blank page to a functional timeline.
Step 1: Gather and dump your unstructured data
Do not worry about formatting cells or creating clean tables. Gather your project briefs, meeting notes, or even a stream-of-consciousness list of deliverables, just as you would when adapting one of many . Ensure that the core components are present: what needs to be done, rough estimates of how long things will take, and the logical order of operations.
Scenario: You are managing a marketing campaign. Your input might just be: "Kickoff on Monday. Spend two weeks researching competitors. Draft the ad copy (takes 3 days) right after research. John will review the copy. Once approved, launch the ads."
Step 2: Feed the generator and set your constraints
Input your raw text into the AI tool. At this stage, you will usually define the global parameters. Tell the AI the official project start date, designate working days versus weekends, and specify the overall timeframe. The engine will process your text and render the initial horizontal bars, milestones, and progress markers.
Step 3: Refine dependencies and adjust the critical path
AI is highly efficient at processing text, but it lacks the contextual nuance of human experience. Review the generated chart to ensure the dependencies make sense. You might know that John is out of the office during the copy review phase, so you will need to manually adjust that specific duration bar or reassign the task. Use the AI's output as your strong baseline, then apply your managerial judgment to finalize the critical path.
Connecting your Gantt chart AI to team execution
Having a perfectly generated timeline is only half the battle. If you export that chart and drop it into a static email, it will be outdated within a week. To keep your project moving, the timeline must live inside a unified workspace where your team actually does their work.
This is where integrating your timeline with an all-in-one suite like Lark changes the operational dynamic. Instead of juggling a standalone project timeline, a separate chat app, and a distinct cloud drive, growing SMEs and enterprise teams can consolidate everything. You can embed your project milestones directly within cloud-native documents and sheets.
When a timeline is connected to your communication channels, execution becomes significantly easier, especially when paired with a centralized . You can discuss an upcoming bottleneck via messaging or jump into a video meeting without leaving the environment where your project data lives.
Furthermore, you can move from passive tracking to active workflow automation, much like adopting dedicated . For example, using Lark's free forever Starter plan—which supports up to 20 users and includes 1,000 automation runs—you can set up specific triggers. When a team member marks a critical timeline phase as complete in your shared sheet, the system can automatically send an alert to the project channel or initiate an approval workflow for the next phase. This keeps the entire team aligned on the timeline without anyone having to manually send update emails.
Manage projects better with a Gantt chart today
Meet Lark: The unified workspace for your AI-assisted timelines
Using a Gantt chart AI generator is the fastest way to turn raw text into a project plan. But once that initial timeline is generated, you need a dynamic platform to execute it. While standalone AI tools often leave you with static exports, provides native Gantt views that bring your automated project plans to life. With built-in , , and , Lark helps teams take their AI-drafted schedules and manage ongoing complexities effortlessly—making it the ideal home for projects of any size. Smart Gantt views inside Lark Base
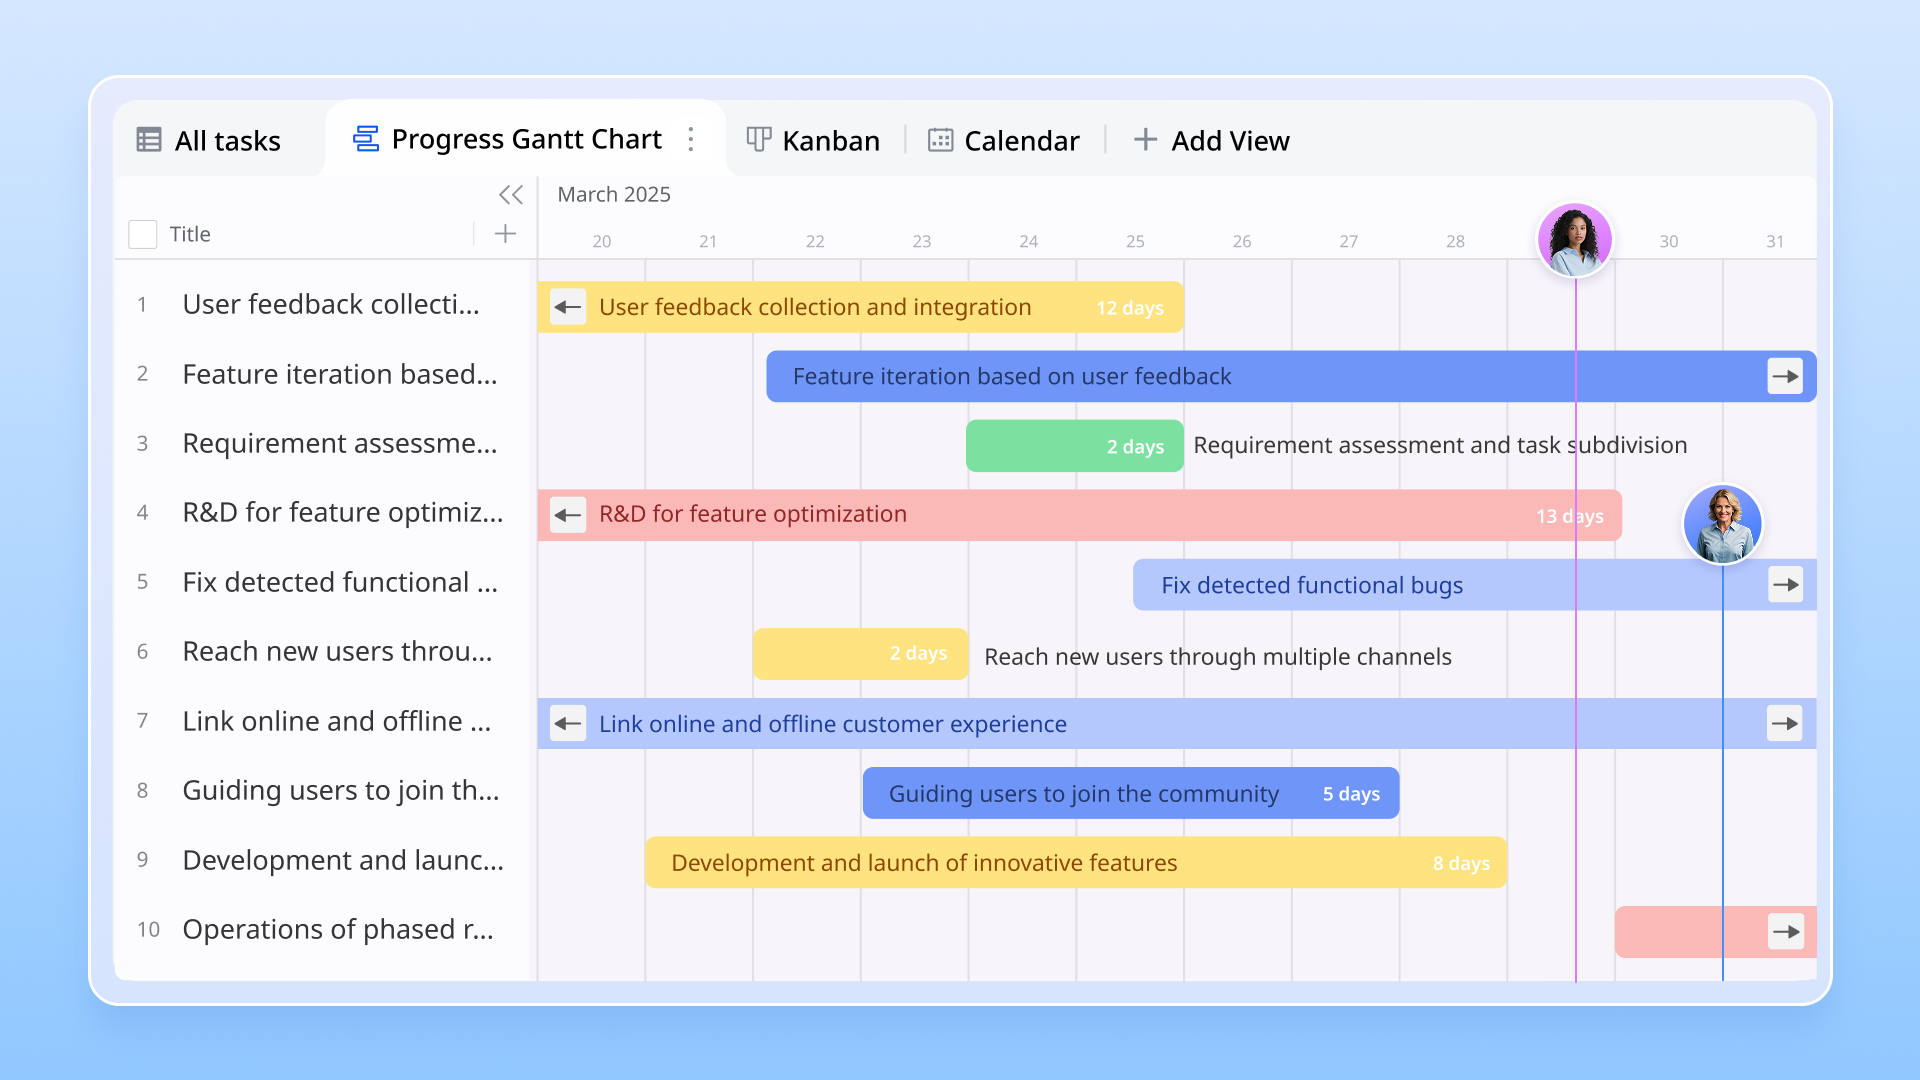
Whether you are importing an AI-generated task list or building one from scratch, acts as an intelligent visualization engine. It automatically transforms your data fields into a timeline without the need for manual chart configuration. Unlike Google Sheets, where you must build a fragile stacked bar chart to visualize time, Lark allows you to toggle between a standard data Grid and a in one click. You can intuitively drag and drop the time bars to extend durations or shift dates, and these changes instantly update the underlying data across all other views and dashboards.
Intelligent dependency mapping with Gantt views
An AI-generated timeline is only useful if it can adapt to reality. In Lark Tasks, users can build their Gantt chart view by dragging the boundaries of task bars to set start and end dates. The system handles schedule shifts through advanced dependency mapping, allowing you to link tasks, manage time buffers, and check task dependencies to ensure a logical workflow. To safeguard your automated deadlines, you can highlight the "critical path" to identify the most vital sequences of tasks or mark essential phases as milestones for clear tracking. 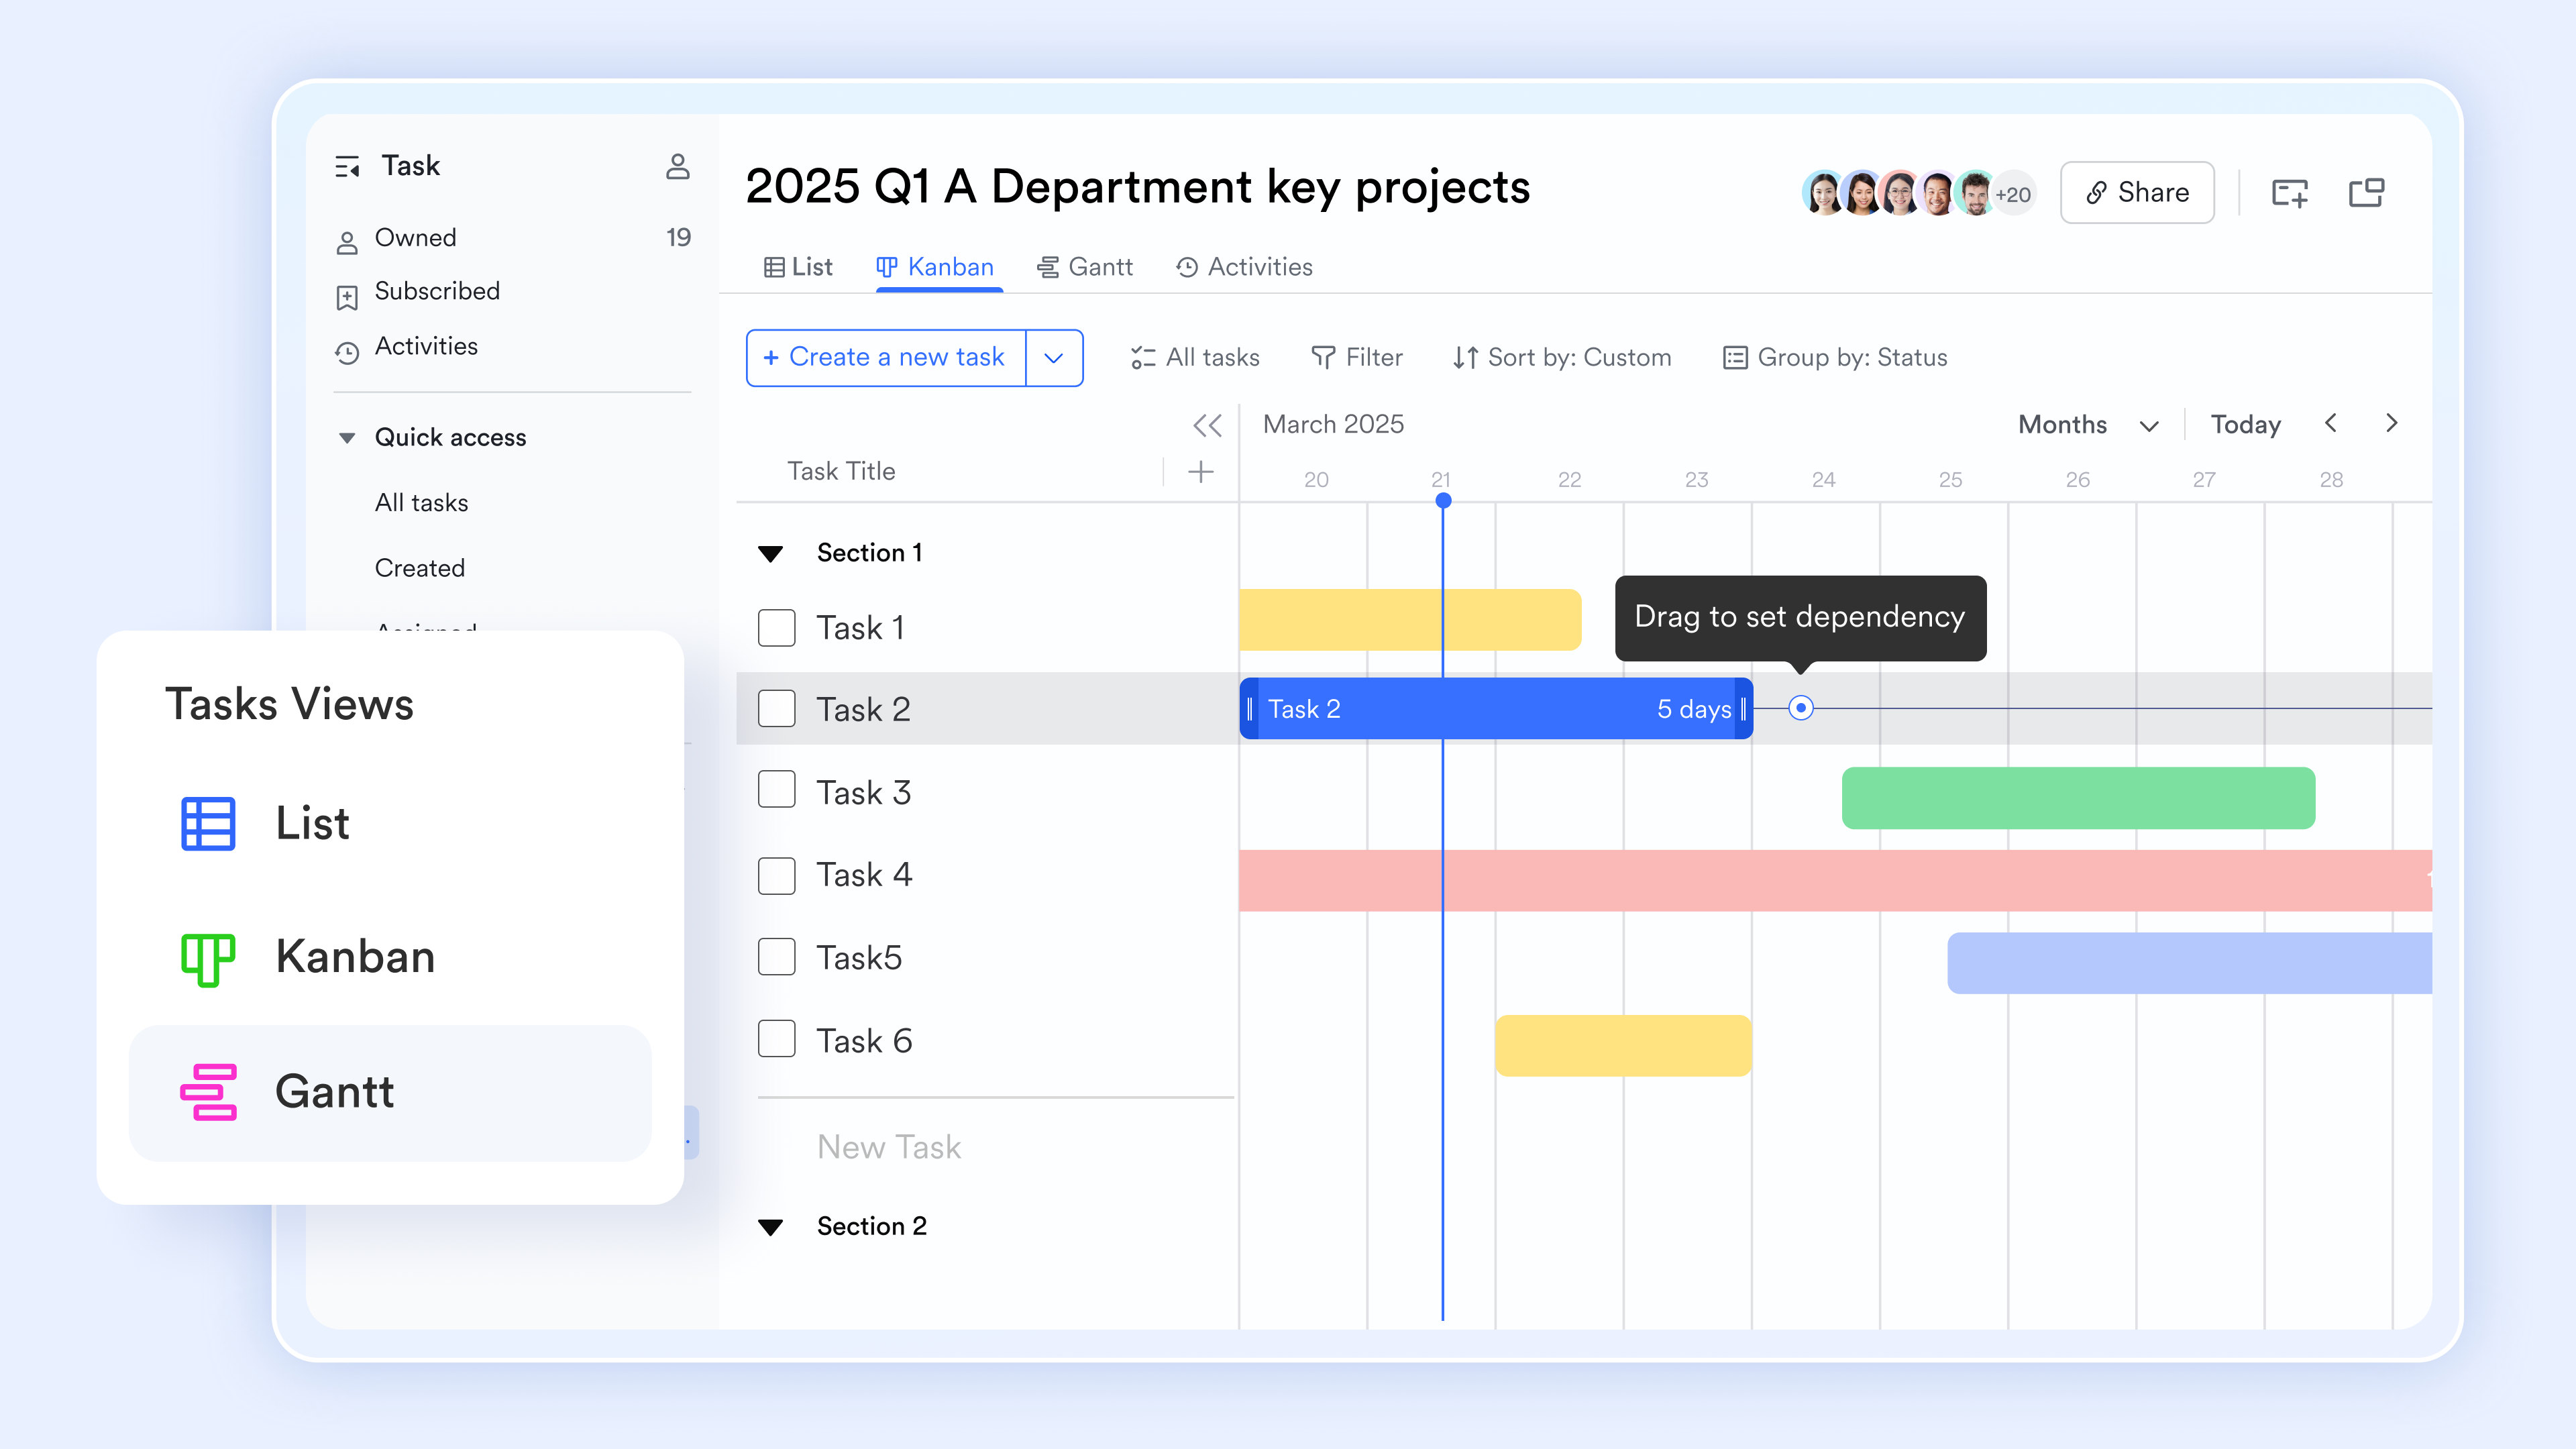
Real-time collaboration with AI translation
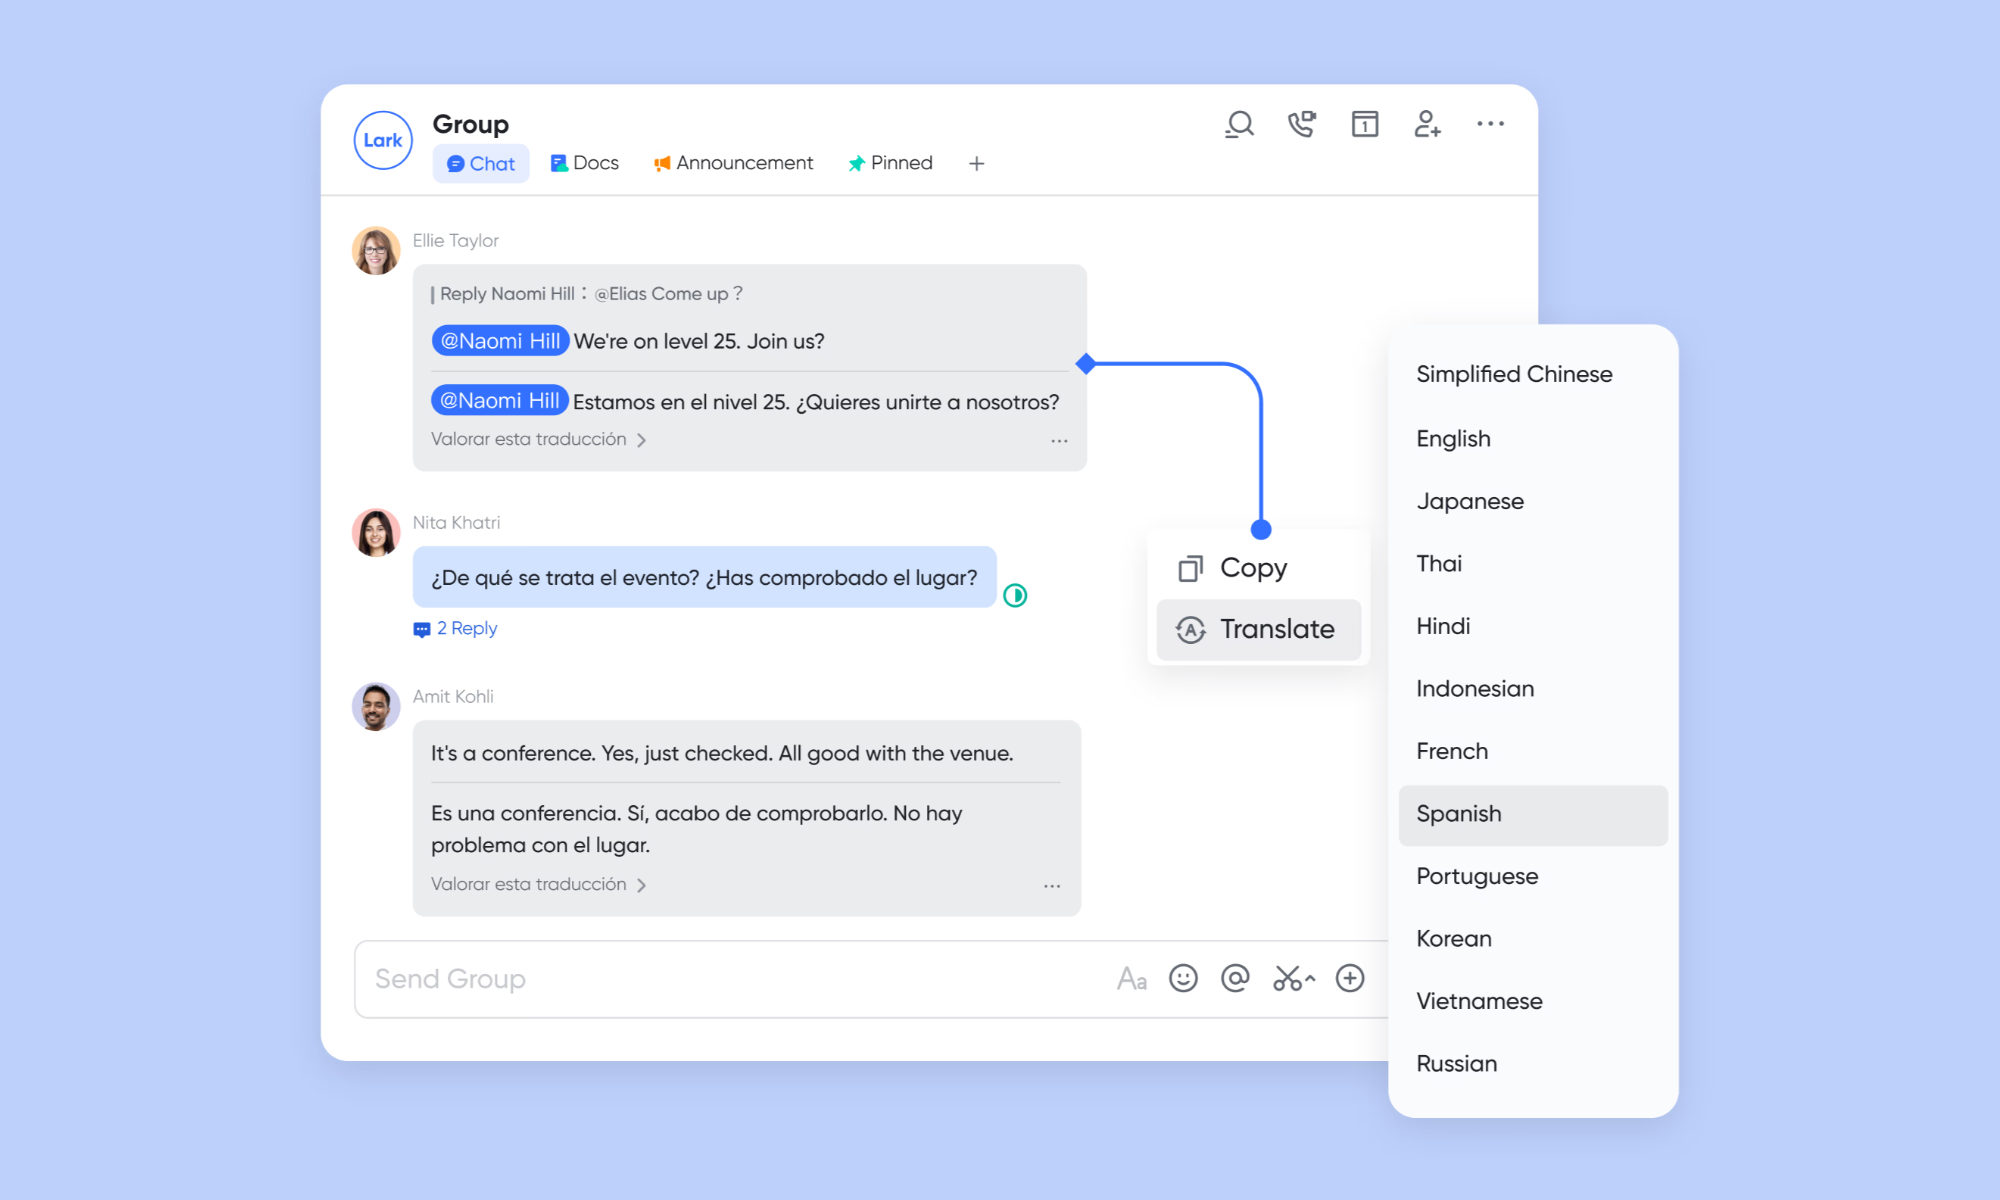
Lark includes built-in AI translations. This means a global team can discuss a timeline bottleneck, and the text will instantly translate into each user's native language. The context for a "Timeline shift" is permanently attached to the record, allowing team members to collaborate on the schedule seamlessly.
Secure sharing & full traceability
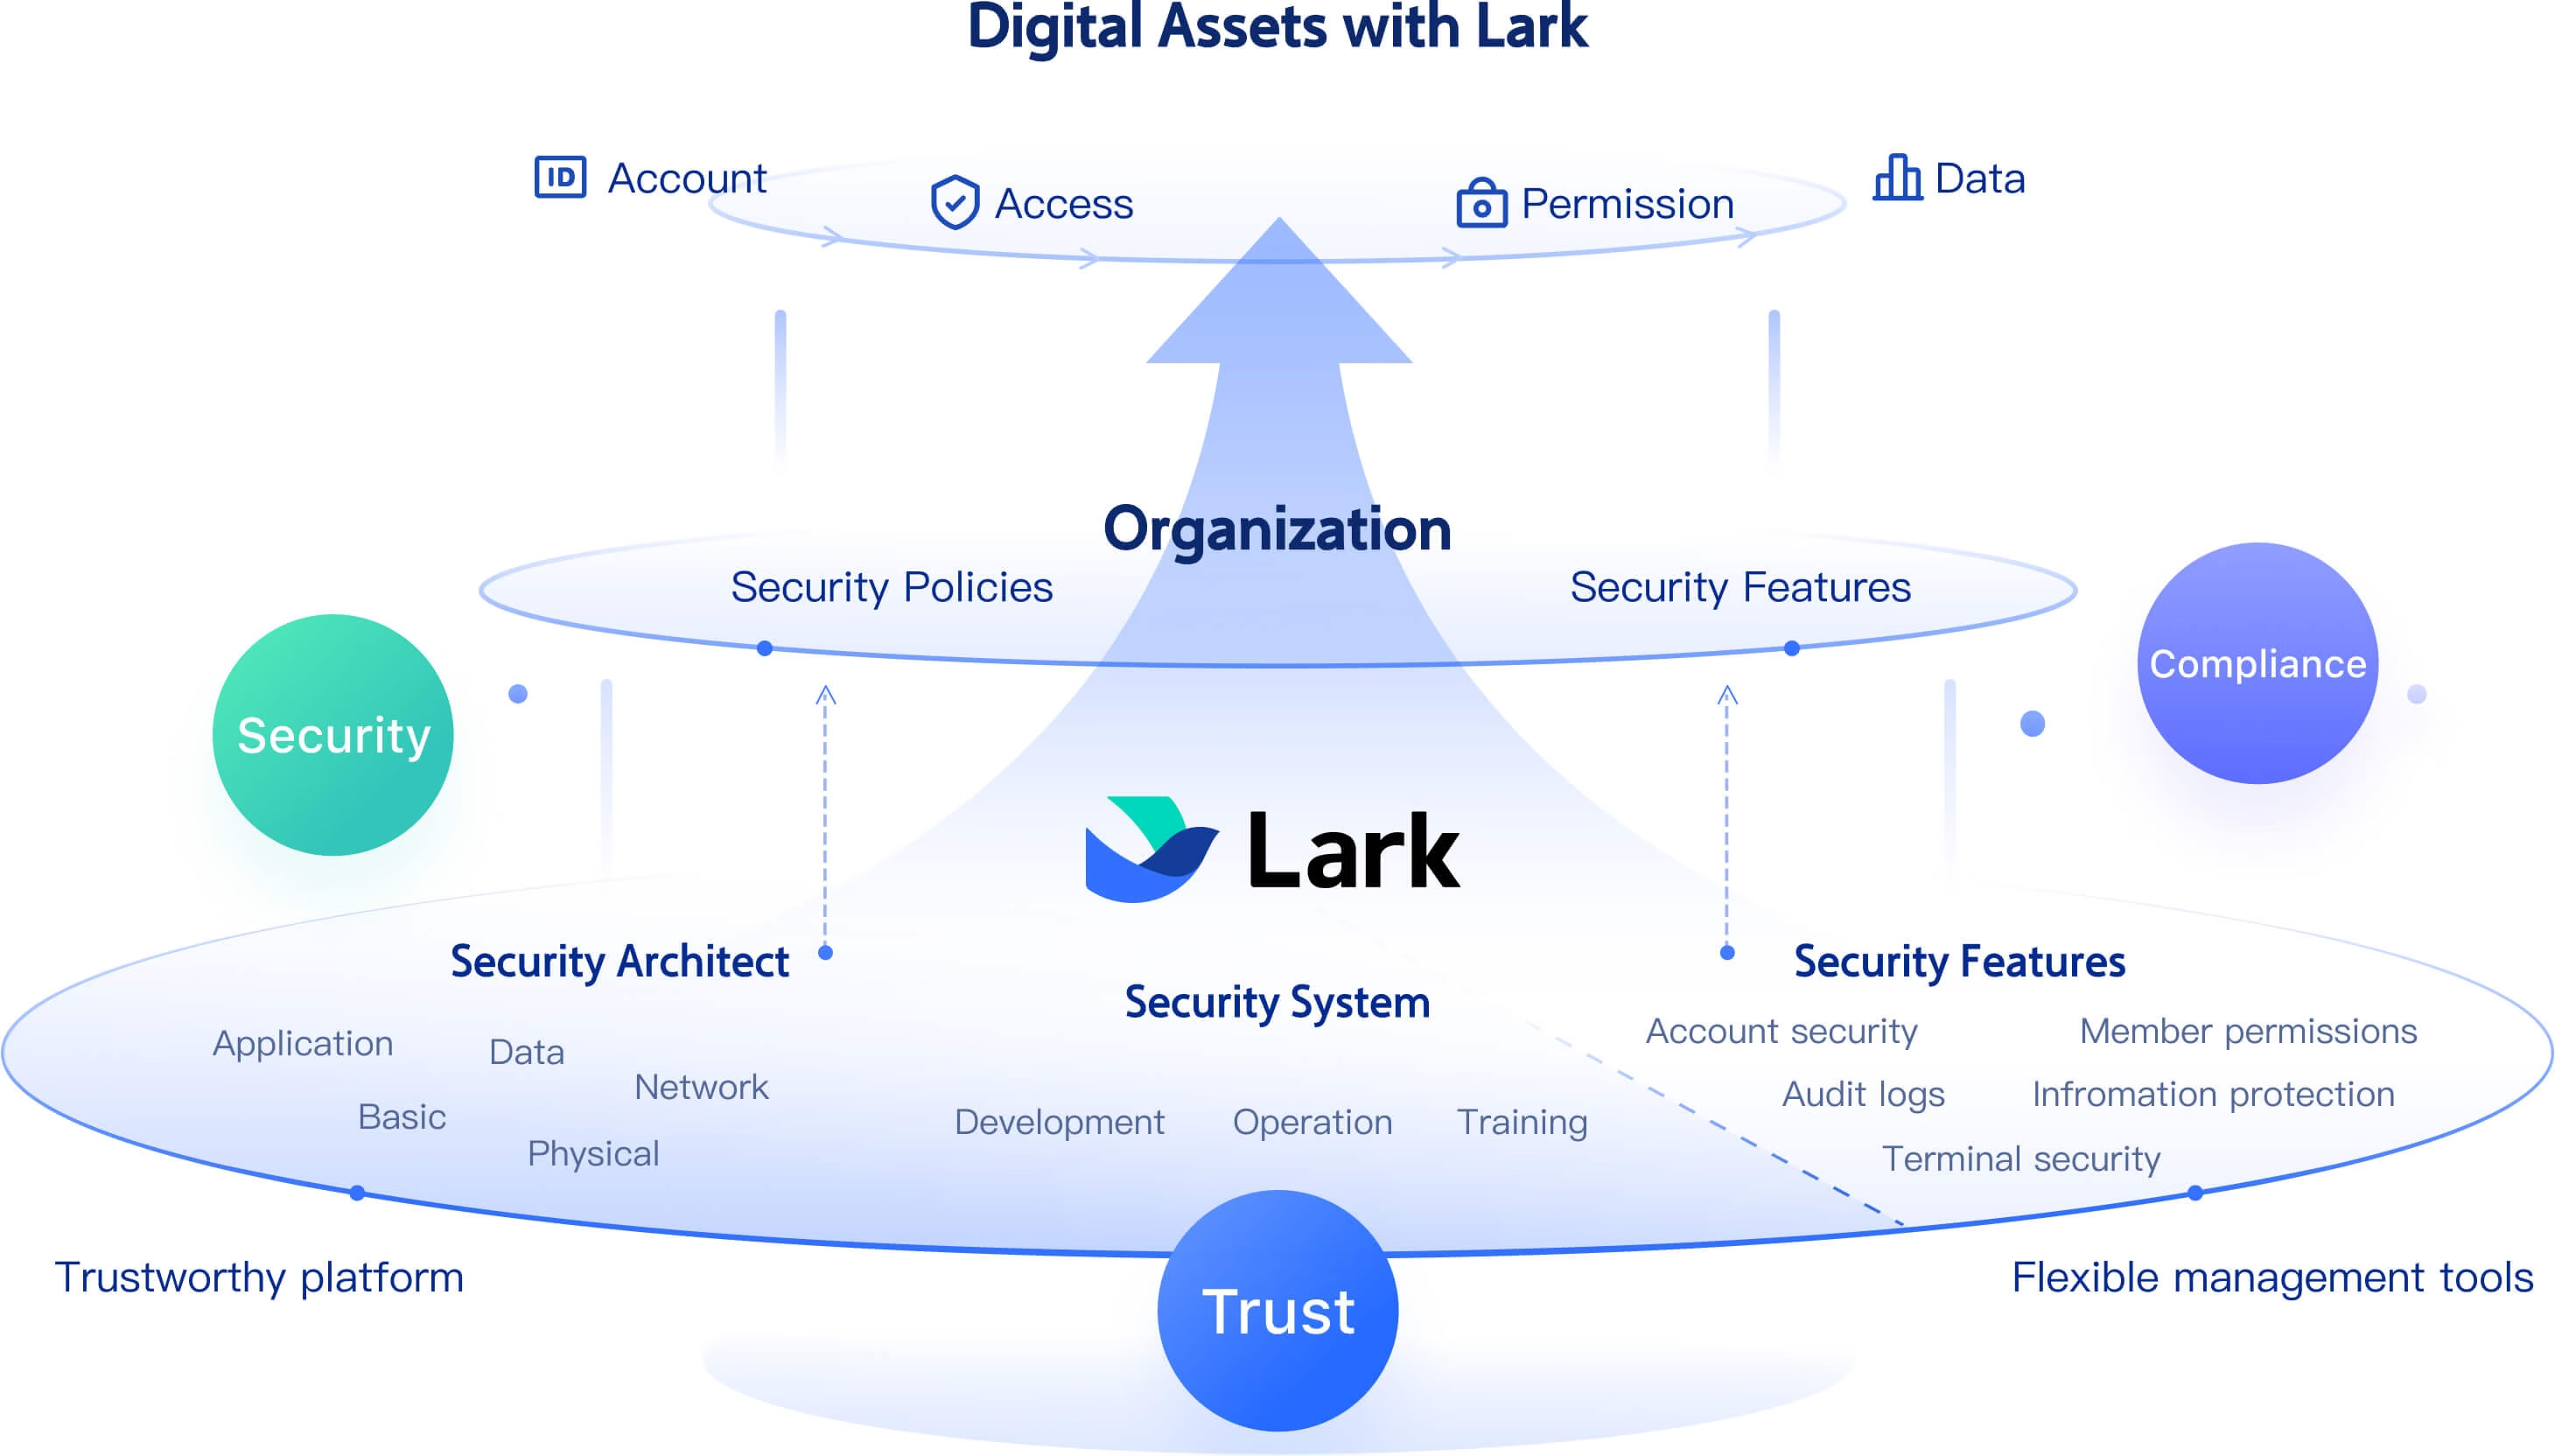
Lark provides for your Gantt charts. Managers can safely share specific views externally without exposing sensitive internal data. Unlike messy, emailed spreadsheets, Lark maintains a live, secure single source of truth. Detailed audit trails track every single change, ensuring complete accountability, data integrity, and real-time alignment for all stakeholders.
Multiple built-in Gantt chart templates
Getting started with Lark Base is effortless thanks to a library of . These templates simplify setup and help teams start tracking projects instantly.
- Project roadmap Gantt chart template: Ideal for project managers and team leads. This template provides a time-based overview of tasks, owners, and deliverables. Use it to align cross-functional teams on goals, timelines, and key milestones. Perfect for product roadmaps, campaign launches, and multi-department initiatives.
- R&D personnel Gantt chart template: Designed for engineering and research teams, this template helps coordinate experiments, sprints, and lab projects. It visualises workloads, priorities, and dependencies, allowing managers to balance resources and identify gaps early.
- Employee task tracker template: A flexible, all-purpose Gantt chart designed for HR managers, supervisors, and project coordinators. It provides both a big-picture timeline and granular task-level views, helping teams manage day-to-day operations alongside long-term goals.
Each template supports custom fields, filters, and grouped views, allowing users to pivot between Gantt, , and grid modes without rebuilding setups. This adaptability makes Lark a universal tool for structured planning, execution, and tracking across industries.
:
- Starter plan: Free forever plan that includes 11 powerful tools for up to 20 users. It also comes with 100GB of storage, 1000 automation runs, AI translations, and more.
- Basic plan: $6/user/month (billed annually) for up to 500 users. It includes everything in Starter plus group calling for up to 500 attendees, 5TB of storage, 1000 automation runs, and more. For more details, please .
- Pro plan: $12/user/month (billed annually) for up to 500 users. It includes everything in Basic plus group calling for up to 500 attendees, 15TB of storage, 50,000 automation runs, and more.
- Enterprise plan: for custom pricing. Supports unlimited users and includes even more automation runs and advanced security, compliance, and management features.
For small teams with simple communication needs

18 months message history
1000 Base automation runs/month
2000 rows per table in Base
Most POPULAR
For companies with comprehensive collaboration and management needs
Unlimited message history
500-participant video meetings
50k Base automation runs/month
20k rows per table in Base
For large companies with advanced security and organizational management needs
Get a personalized demo and pricing
Unlimited message history
500-participant video meetings
15 TB storage + 30 GB storage/user
500k Base automation runs/month
50k Base automation runs/month
Most POPULAR
For companies with comprehensive collaboration and management needs
Unlimited message history
500-participant video meetings
50k Base automation runs/month
20k rows per table in Base
Conclusion
Relying on manual spreadsheet updates for project timelines is an outdated approach. A Gantt chart AI saves you hours of formatting, but to truly transform your productivity, that timeline must connect to your daily execution. By integrating your project planning, chat, and document collaboration into a single unified workspace like , you eliminate the friction of jumping between apps and keep your team aligned. Stop relying on isolated utilities and start connecting your work effectively.
FAQs
Can AI make me a Gantt chart?
Yes. Modern AI tools can read unstructured text—such as meeting notes, task lists, or even audio transcripts—and automatically convert that information into a structured visual timeline. The system identifies tasks, durations, and dependencies, generating the horizontal bars and milestones without manual data entry.
Can ChatGPT do Gantt charts?
ChatGPT can outline project schedules and generate code (such as Mermaid.js syntax) that represents a Gantt chart, but it does not have a built-in, interactive visual interface. To actually see and interact with the timeline, you typically have to copy that code into a third-party rendering tool or specialized timeline software.
Can I generate a Gantt chart in Excel?
You can build one in Excel using stacked bar charts or conditional formatting, but it is a highly manual process. Unlike dedicated project management software, a standard spreadsheet will not automatically adjust subsequent task dates when a single dependency changes, forcing you to spend significant time manually updating cells.
Is there a free Gantt chart software?
Yes, many platforms offer free tiers, though they vary wildly in capability. Standalone generators often limit how many tasks you can visualize. For a more comprehensive solution, unified platforms like Lark offer robust free plans (the Starter plan is free forever for up to 20 users) that include timeline management within cloud-native sheets, alongside chat and automation capabilities.
Related reading