


PERT Critical Path: Guide to Realistic Project Scheduling

Matthew Sia
Product Marketing Manager
Aug 5, 2026
Matthew Sia
Aug 5, 2026

14 min read


Accurate project scheduling is one of the most persistent challenges in management. Even the most detailed plans can fail when they encounter the friction of real-world execution. This discrepancy often stems from a single flaw: traditional schedules assume fixed durations for tasks that are inherently uncertain.
To solve this, experienced project managers rely on the PERT Critical Path. This methodology bridges the gap between statistical probability and strict timeline logic. By integrating the Program Evaluation Review Technique (PERT) with the Critical Path Method (CPM), you create a schedule that accounts for risks rather than ignoring them.
Instead of asking simply how long a task takes, this approach helps you understand the probability of finishing on time. It transforms a rigid timeline into a flexible instrument for decision-making. This guide explores how these two powerful frameworks function together, detailing the calculations, the benefits, and how to apply them to build schedules that withstand the pressure of complex projects.
What is the Program Evaluation Review Technique (PERT)?
The Program Evaluation Review Technique (PERT) is a statistical tool used to model the tasks involved in a project. Unlike standard schedules that use single "best-guess" estimates, the PERT Critical Path Method assumes that duration is a variable, not a constant.
PERT is designed to handle high uncertainty in massive, first-of-its-kind initiatives. Its core philosophy is managing time risk by using three distinct estimates for every task:
- Optimistic time (O): The minimum time required if everything goes perfectly.
- Pessimistic time (P): The maximum time required if significant issues arise.
- Most likely time (M): The duration expected under normal conditions.
By combining these into a weighted average, PERT produces a probabilistic schedule rather than a deterministic one. When viewing critical path analysis and PERT charts, you aren't just seeing a timeline; you are seeing a risk map that highlights variance and potential bottlenecks before they happen.
Understanding the Critical Path Method (CPM)
While PERT focuses on calculating realistic task durations, the Critical Path Method (CPM) focuses on the sequence and dependencies of those tasks. The "Critical Path" is simply the longest sequence of dependent tasks that must be completed on time for the project to finish by its deadline.
Think of it like baking a cake while washing dishes. Baking the cake takes 60 minutes; washing dishes takes 15. The baking process is your critical path. If the oven runs slowly, dinner will be late. If you wash dishes slowly, it doesn't matter because you have plenty of spare time ("float") while the cake bakes.
In a PERT chart example with critical path analysis, tasks are divided into two categories:
- Critical tasks (zero float): Any delay here delays the entire project.
- Non-critical tasks (positive float): These tasks have a buffer and can be delayed without impacting the final deadline.
By combining CPM's logic with PERT's realistic data, critical path analysis PERT becomes a powerful system. CPM tells you which tasks matter most, and PERT tells you how likely those tasks are to finish on time.
PERT vs CPM: What is the actual difference?
If you are confused about the difference between PERT and CPM, you are not alone. In modern project management software, the lines between these two have blurred significantly. Most project management tools today use a hybrid approach, but understanding their distinct origins helps you use them better.
The fundamental difference lies in how they treat time and uncertainty.
- CPM is deterministic. It assumes that the duration of a task is a known fact. If you are building a house, you know from experience that pouring the foundation takes exactly three days. CPM focuses on cost-time trade-offs—if I pay for more workers, can I shorten the duration? It is about optimization in a predictable environment.
- PERT is probabilistic. It assumes that the duration is variable. If you are coding a new AI feature, it might take two days, or it might take two weeks if bugs appear. PERT focuses on time management in an unpredictable environment.
Think of it this way: CPM is like taking a train. You have a schedule, and you expect to arrive at a specific time. Critical path analysis PERT, on the other hand, is like driving through heavy traffic. You know the route, but your arrival time depends on variables you cannot fully control.
In the real world, few projects are 100% predictable. That is why the PERT Critical Path Method—which applies the statistical estimations of PERT to the logic of CPM—is the most robust way to plan. You get the structure of the critical path with the realistic safety buffers of PERT.
Benefits of using PERT and CPM together
Why go through the trouble of calculating formulas and drawing diagrams? Why not just make a to-do list? Implementing critical path analysis and PERT charts offers specific advantages that simple lists cannot match.
- Improved accuracy through psychology: Human beings are terrible at estimating time. We suffer from "optimism bias," assuming everything will go right. By forcing your team to provide a "Pessimistic" estimate (the P in PERT), you psychologically anchor the schedule in reality. You are no longer planning for the best-case scenario; you are planning for the average scenario.
- Visualizing dependencies: A critical path PERT diagram exposes the hidden relationships between tasks. You might not realize that the marketing team cannot start their campaign until the legal team approves the copy. Seeing these dependencies helps you prevent bottlenecks before they happen.
- Dynamic resource allocation: When you identify the critical path of a PERT chart, you know exactly which tasks matter. If a non-critical task is delayed, you don't need to panic. You can use that insight to shift resources (people, budget) from tasks with "float" to tasks on the critical path, ensuring the project deadline stays safe.

How to identify the PERT Critical Path in 6 steps
Identifying the critical path using PERT isn't just about drawing circles and arrows; it is a systematic process of breaking down a project to understand its true duration. While you can do this on a whiteboard, modern teams often use collaborative platforms to streamline data collection.
Step 1: List tasks and the work breakdown structure (WBS)
Before you can analyze a path, you need a map. Start by breaking your project down into specific, actionable tasks. This is your Work Breakdown Structure (WBS).
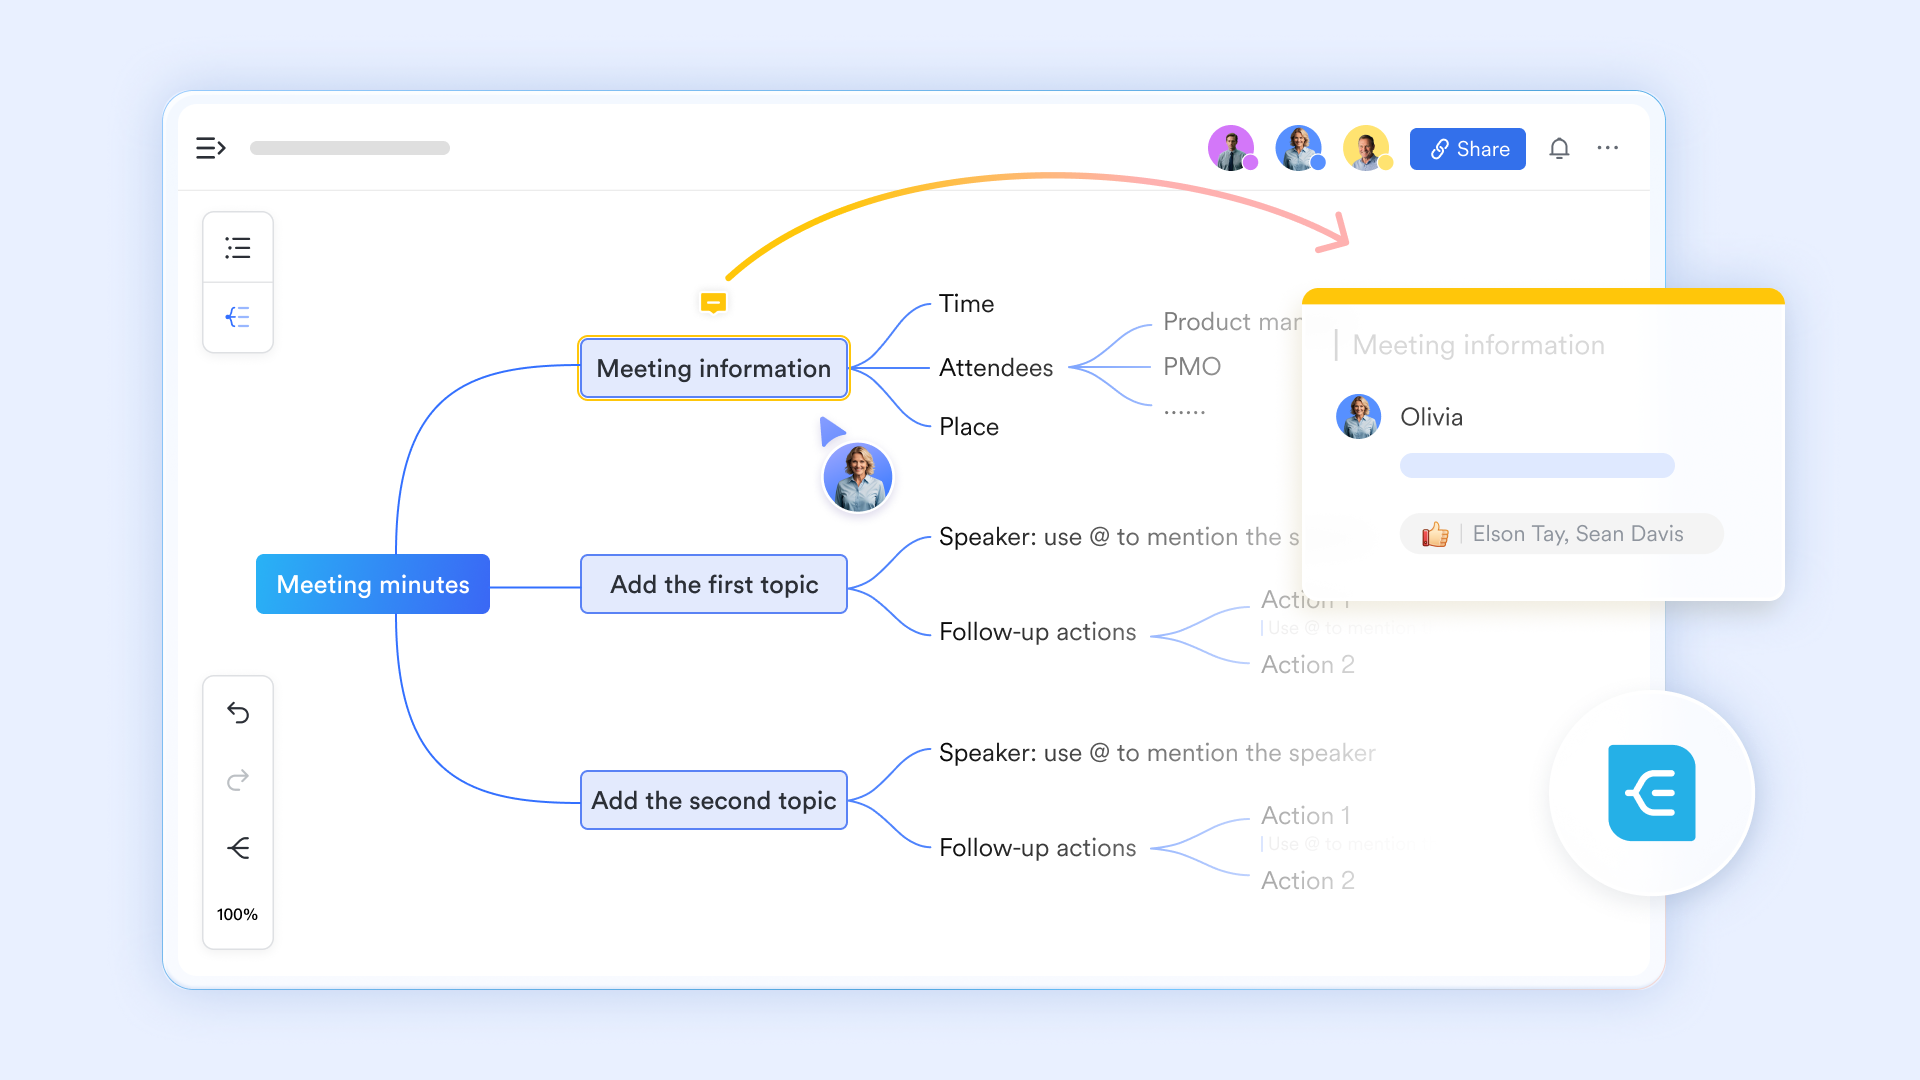
The key here is granularity. A task like "Build App" is too big. A task like "Design Login Screen" is just right. You need tasks that are small enough to be estimated accurately but not so small that you drown in micromanagement. In a collaborative suite like Lark, you can start this process in shared MindNotes. This allows the whole team to brainstorm tasks simultaneously, ensuring nothing is forgotten.
Step 2: Define dependencies and sequence
Once you have your list, you must determine the sequence. You cannot put the roof on a house before the walls are built.
- Predecessors: Which tasks must happen before this one?
- Successors: Which tasks can happen after this one?
In critical path analysis PERT, the most common relationship is "Finish-to-Start" (Task A must finish before Task B starts). To know more about project dependencies, click Guide to Project Dependencies: Types, Identification & Management
Step 3: Gather the 3-point estimates
This is the heart of the PERT method. For each task in your WBS, you need to gather three time estimates.
- Optimistic (O): The "miracle" timeline.
- Pessimistic (P): The "Murphy's law" timeline.
- Most likely (M): The realistic timeline.
Crucial advice: Do not guess these numbers yourself. As a project manager, your guess is likely wrong. Ask the person doing the work.
How to automate this: Instead of chasing people with emails, it's suggested to use a feature like Lark Forms. Send a form to your developers or designers asking for their O, P, and M estimates for their specific tasks. The data will flow directly into your project table, ready for calculation.

Step 4: Calculate the expected time (TE)
Now, we apply math. We use a weighted average formula to determine the expected time ($TE$) for each task. The formula favors the "most likely" estimate but drags it slightly toward the "Pessimistic" side to account for risk.
The PERT formula: TE = (O+4M+P)/6
For example, if a task has:
- Optimistic: 2 days
- Most likely: 5 days
- Pessimistic: 12 days
TE = (2+4*5+12)/6 = 34/6 = 5.67 days
In a standard schedule, you might have just written "5 days". PERT tells you that 5.67 days is statistically more accurate. If you're using a database with automatic calculation capabilities, you can set up a formula column to automatically calculate the TE value the moment your team submits their estimates via the form.
Step 5: Construct the network diagram
Now you draw the map. A PERT chart example with critical path typically places tasks on nodes (boxes) connected by arrows.
You will perform two "passes" through this diagram to find the timing:
- Forward pass: Start at the beginning (Day 0) and add the duration ($TE$) of each task to find the Early Start (ES) and Early Finish (EF). If a task has two predecessors, its Early Start is the latest of the predecessors' Early Finish times.
- Backward pass: Start at the end of the project and work backward. Subtract durations to find the Late Start (LS) and Late Finish (LF). This tells you the latest possible moment a task can start without delaying the project.
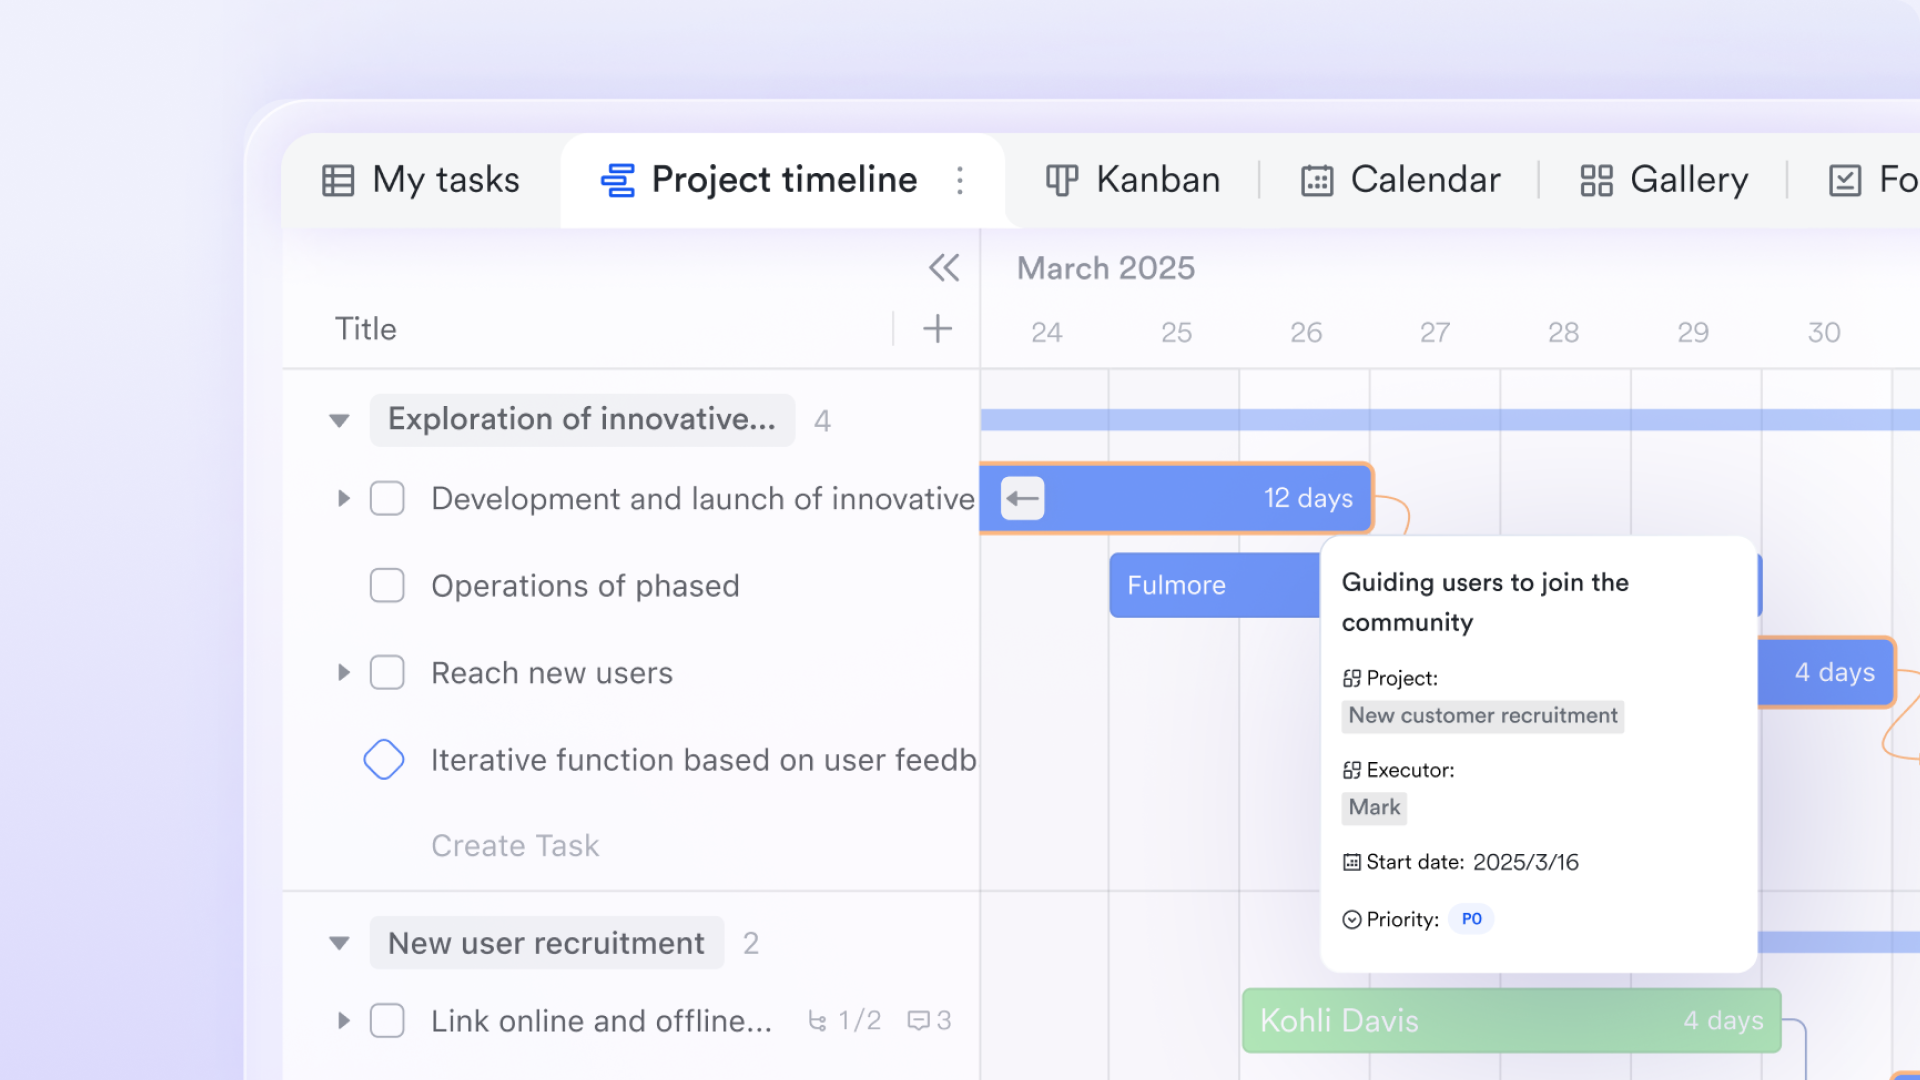
While manual diagrams are great for learning, they are static. Using a digital Gantt chart view essentially visualizes this network for you, adjusting the bars based on the dependencies you set in Step 2.
Step 6: Identify the critical path and float
Finally, compare your numbers. The critical path of a PERT chart is the sequence of tasks where the "Early Start" equals the "Late Start" (or where $EF = LF$).
This means there is zero float (slack). $$Float = LS - ES$$
If the result is 0, that task is critical. Connect all the tasks with zero float, and you have your PERT chart critical path.
- Critical tasks: These must be monitored closely. Any delay here equals project delay.
- Non-critical tasks: These have positive floats. If a task has 3 days of float, it can slip by 3 days without impacting the final deadline.
By following these six steps, you move from a vague "guesstimate" to a mathematically sound schedule. You know not only how long the project should take but also which specific levers to pull if you need to speed it up.
Common challenges when using pert charts manually
While the math behind the PERT Critical Path method is solid, executing it manually is often a nightmare. If you have ever tried to maintain a PERT chart on a whiteboard or a static spreadsheet, you have likely encountered these friction points.
- The "static snapshot" problem: The moment you draw a critical path PERT diagram on paper, it is obsolete. Projects are living organisms. A task finishes early, a vendor delays shipment, or the scope changes. In a manual system, every single change requires you to erase, recalculate, and redraw the entire network. This administrative burden often leads project managers to abandon the method halfway through the project.
- The complexity of updates: Recalculating the PERT Critical Path isn't just about changing one number. If "Task A" changes duration, it ripples through the entire network. You have to redo the "Forward Pass" to find new "Early Finishes", redo the "Backward Pass" to find new "Late Starts", and recalculate the float for every dependent task. Doing this manually for a project with 50+ tasks is not just tedious; it is prone to human error. A single math mistake can lead you to believe you have a buffer when you actually have none.
- Siloed estimation: Gathering the three estimates (Optimistic, Pessimistic, Most Likely) is difficult when done manually. It usually involves chasing team members via email or Slack. Often, the project manager gets tired of waiting and just guesses the numbers themselves. This defeats the entire purpose of PERT. The accuracy of critical path analysis and PERT charts relies entirely on the wisdom of the crowd—the people actually doing the work. If you guess for them, you are just validating your own biases.
Managing the PERT Critical Path dynamically with Lark
The solution to these manual headaches isn't to abandon methodology; it is to automate the drudgery. This is where a modern collaboration platform like Lark changes the game. By combining communication, database management, and visualization into one tool, Lark transforms the PERT Critical Path from a static diagram into a dynamic engine that drives your project.
Automating the complex math
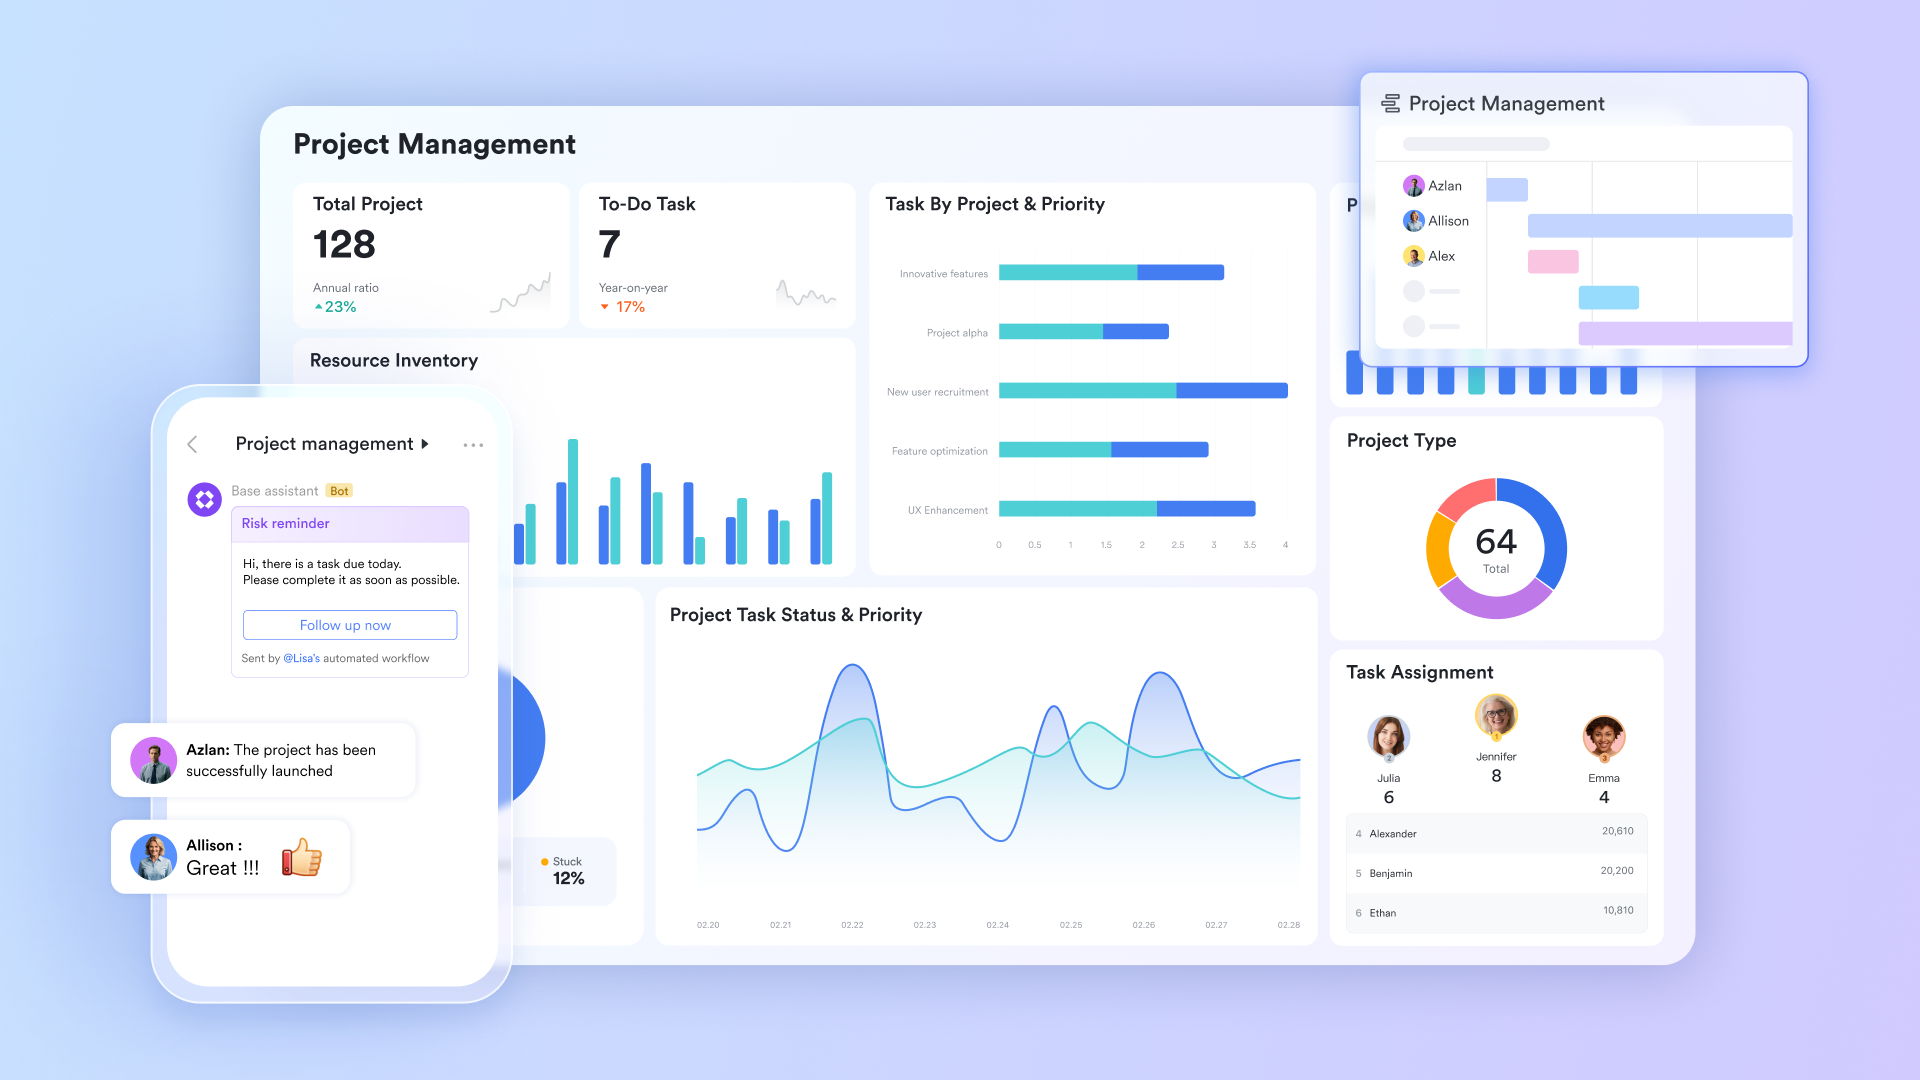
Once the estimates are in your Base, you shouldn't be reaching for a calculator. Lark Base allows you to create formula columns that handle the PERT logic automatically.
You can set up a "Duration" column with the standard PERT formula: (Optimistic + 4*Likely + Pessimistic) / 6. As soon as a team member submits their estimates, the system instantly calculates the weighted average duration ($TE$) and even the Standard Deviation ($\sigma$) if you want to track risk variance. This means your project schedule is always based on the latest, most accurate statistical data, updated in real-time.
Visualizing the critical path instantly
Spreadsheets are great for data, but they are terrible for seeing dependencies. You need to see the flow.
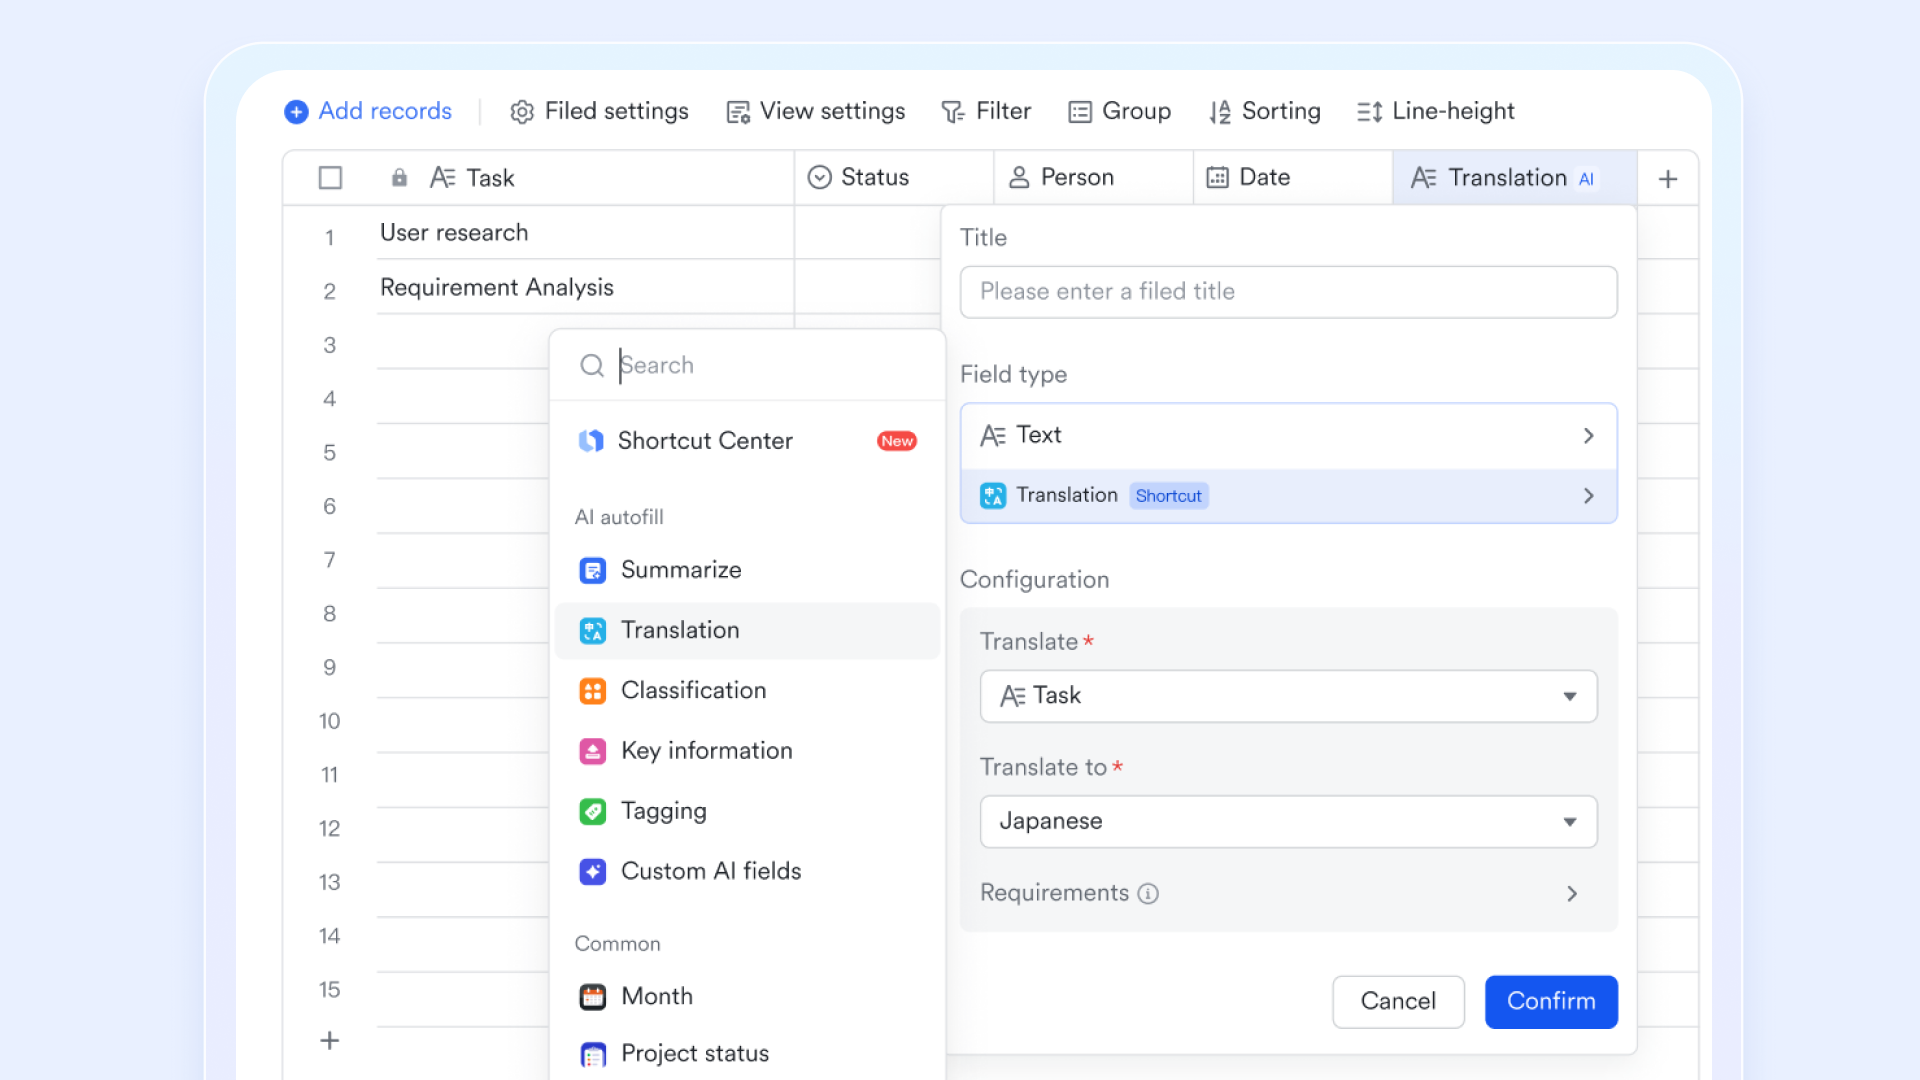
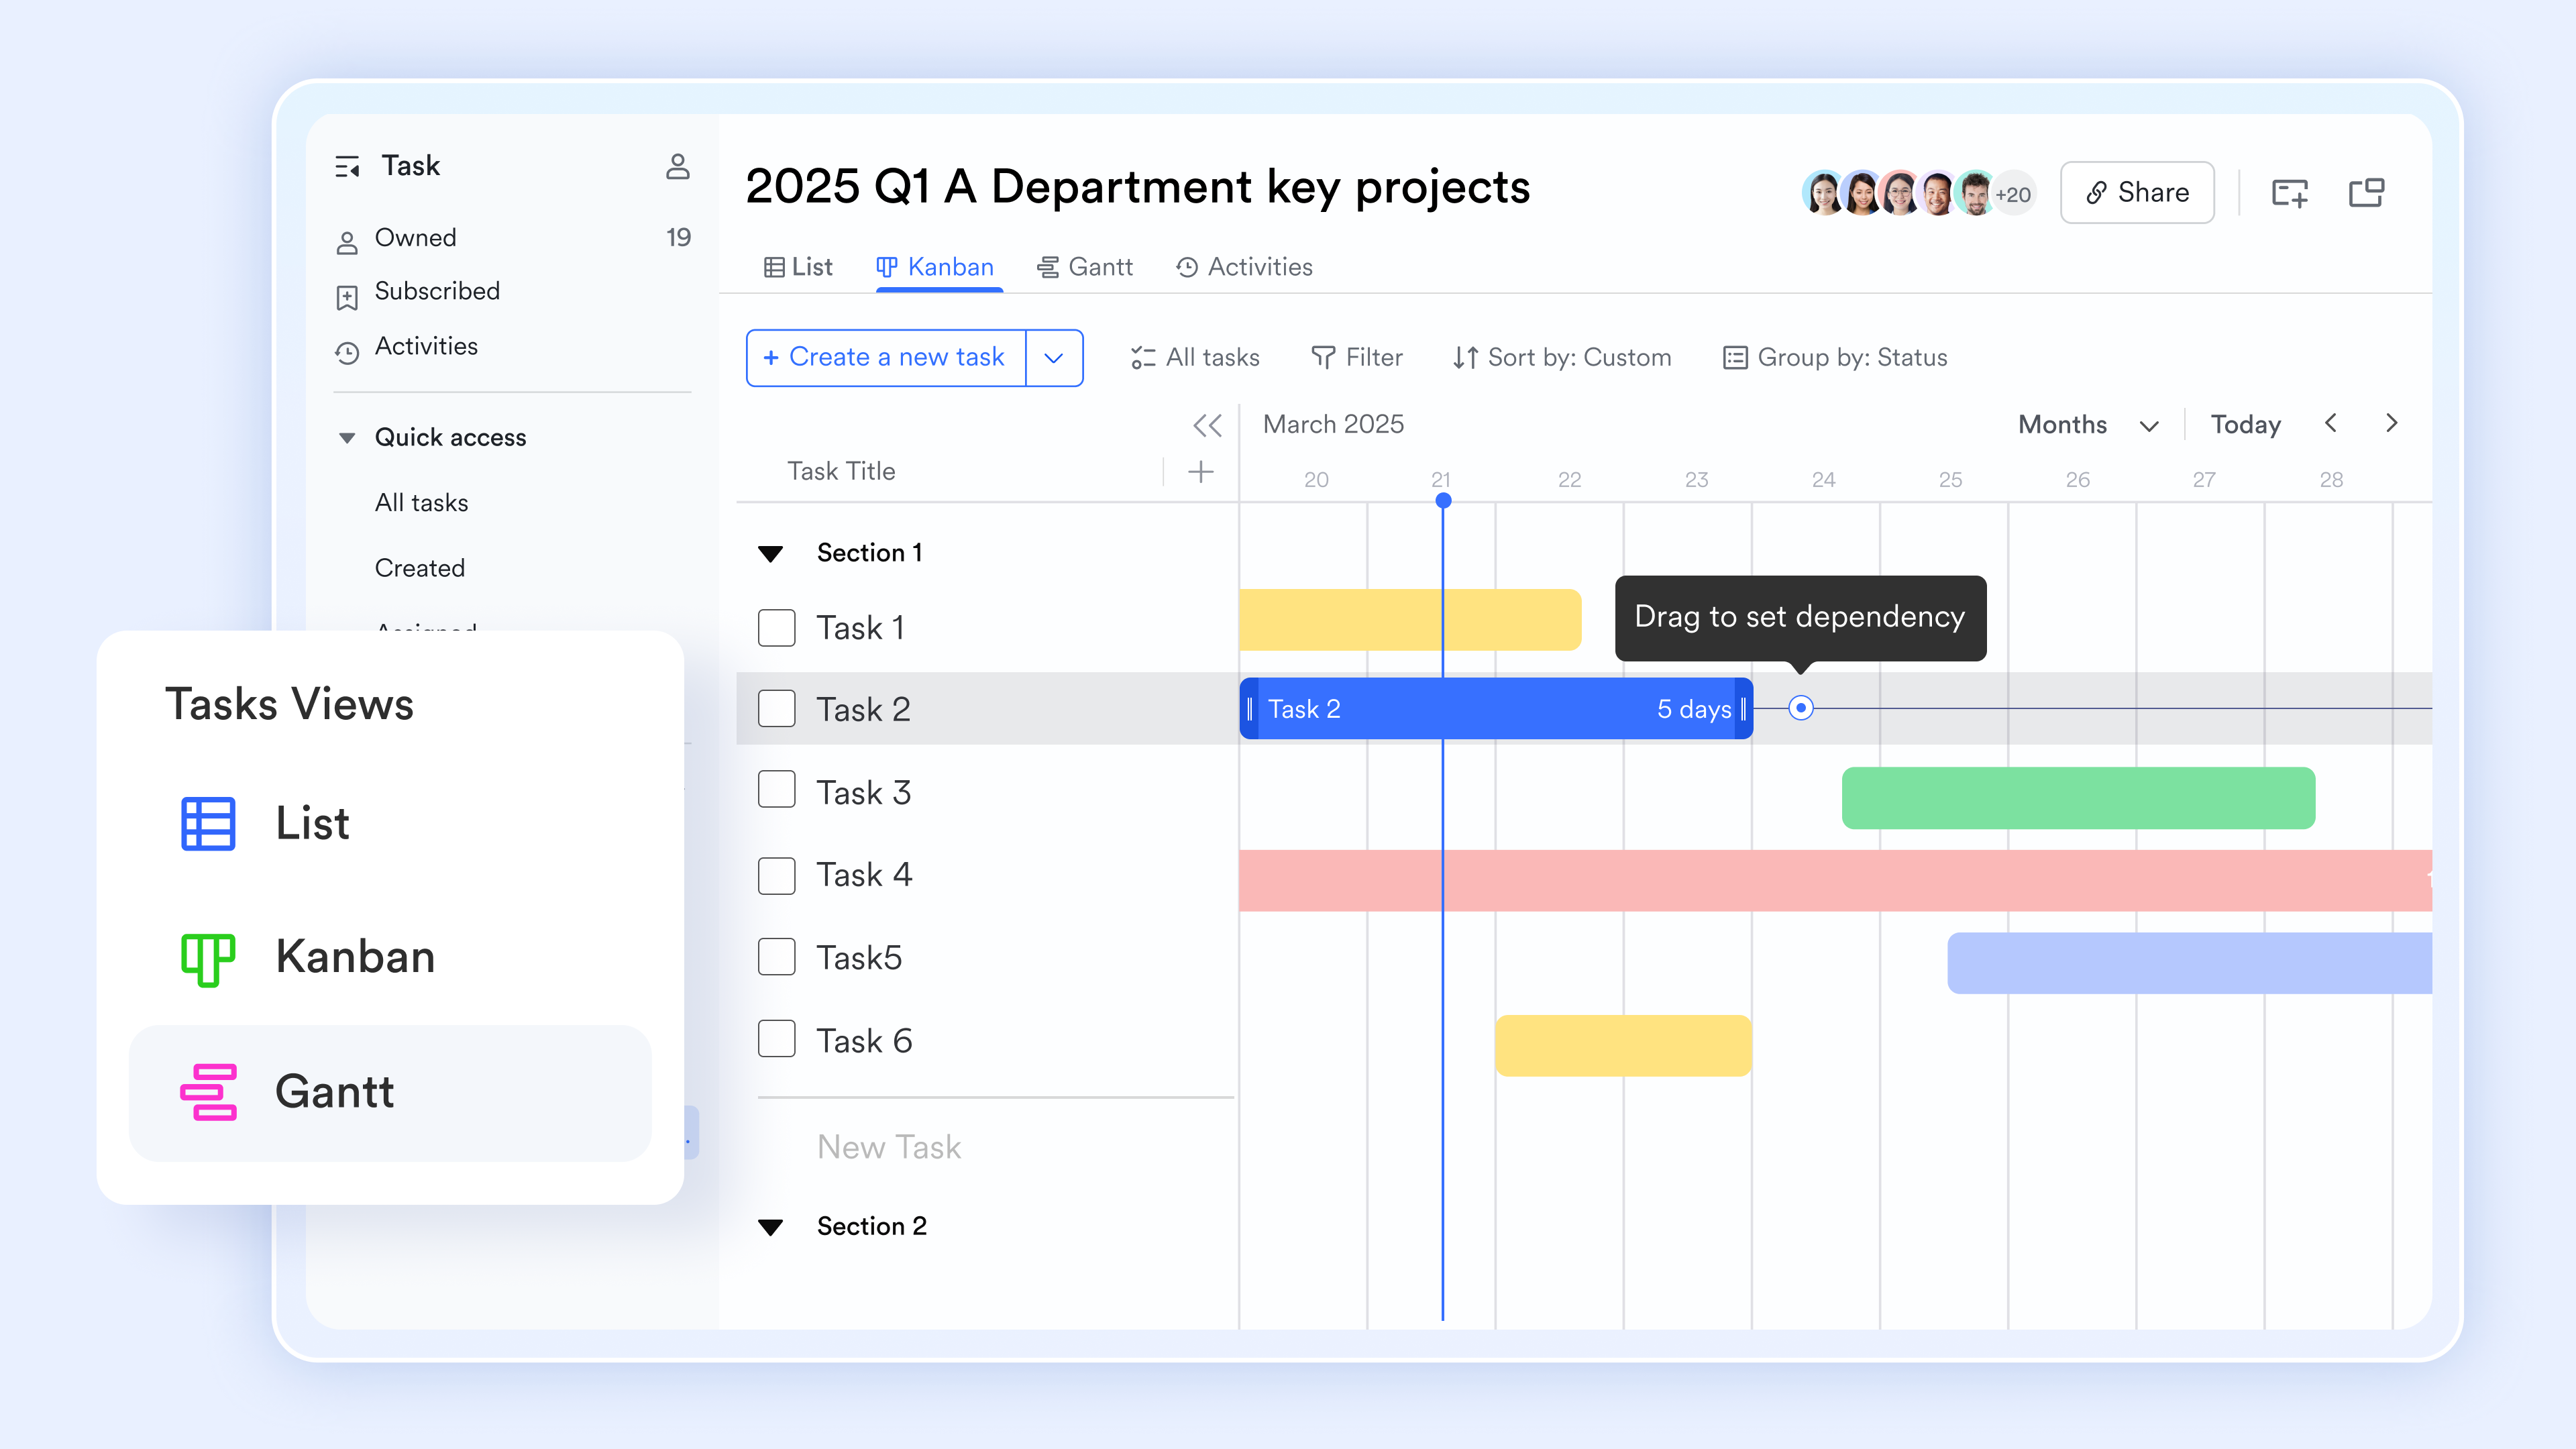
Lark Tasks includes a built-in Gantt view that visualizes your data without you needing to draw a single box. By mapping your "Start Date" and "Dependency" columns, the system generates a dynamic timeline. It automatically links tasks based on the predecessors you defined.
Facilitating rapid context switching
In traditional setups, the project plan lives in one app (like Microsoft Project), and the conversation lives in another (like Slack or Email). This disconnection kills momentum.
Lark Messenger combines communication directly with the project record. If you see a task on the PERT chart example with critical path that looks risky—perhaps the variance between the Optimistic and Pessimistic times is huge—you can click on that record and start a chat thread right there.
You can tag the assignee: "Hey, I see a big gap between your best and worst case here. What's driving that risk?" This keeps the conversation focused and contextual. You aren't searching through endless chat history to find the discussion about "Task 4B"; it is permanently attached to the task itself.

Managing document dependencies
Often, the critical path is blocked not by work but by approvals or documentation. "We can't start coding until the spec is signed off."
Lark Docs allows you to embed your project timelines and Base tables directly into the requirement documents. This creates a single source of truth. When a stakeholder is reading the project spec, they can see the live PERT Critical Path embedded right below it. They can see exactly how their delay in signing the document impacts the final delivery date. This transparency is a powerful motivator for keeping the project moving.

Advanced strategies: What to do when the project is late
Even with the most detailed critical path analysis and PERT charts, reality can still interfere. When you find your PERT Critical Path extending beyond the deadline, panic is not a strategy. Instead, you need to apply specific schedule compression techniques to get back on track.
Here are three proven ways to recover time without abandoning your plan:
Fast tracking
This involves running sequential tasks in parallel. Look at your PERT chart example with the critical path and ask: "Does Task B really need to wait until Task A is 100% finished?" For instance, you might start writing code before the design documentation is fully approved.
- The Trade-off: You buy time but increase the risk of rework if the initial task changes.
Crashing means adding resources to tasks specifically on the critical path to shorten their duration. If a critical task is estimated to take two weeks, adding a second engineer might cut it to one week.
- The Trade-off: This almost always increases cost. It works best for divisible tasks (like data entry) rather than cognitive tasks (like complex problem solving).
If you cannot move the timeline or add resources, you must reduce the workload. Use your critical path PERT diagram to identify features on the critical path that are "nice to have" rather than essential. Deferring a risky, non-critical feature to Phase 2 instantly reduces your project's expected duration.
PERT, CPM, and PERT/CPM: When to use each
We have discussed these concepts as a unified system, but there are times when you might want to use just one. Understanding the distinction ensures you don't over-engineer a simple project or under-plan a complex one.
When to use CPM alone
The Critical Path Method (without PERT's 3-point estimation) is best for repetitive, predictable projects.
- Examples: Construction of a standard suburban home, manufacturing runs, or routine maintenance.
- Why: If you have done the project 50 times, you have historical data. You know exactly how long tasks take. You don't need probability; you need to optimize the logistics.
- Recommended reading: Critical Path Examples: Make Projects Stay on Schedule
When to use PERT alone
Using PERT without a full network diagram is rare but useful for high-level estimations.
- Examples: Initial budget proposals or feasibility studies.
- Why: Sometimes you just need a rough "Expected Time" for a few key deliverables to see if a deadline is even mathematically possible before you commit to building a full schedule.
- Recommended reading: Understanding PERT in Project Management: Insights & Methods
When to use the combined PERT Critical Path Method
This is the sweet spot for modern knowledge work. You should use the integrated critical path analysis PERT approach for complex, unique, or high-stakes projects.
- Examples: Software development, new product launches, or research initiatives.
- Why: In these fields, "standard" times don't exist. You need the structure of CPM to manage dependencies, but you need the flexibility of PERT to handle the fact that you simply don't know if a task will take 3 days or 6.
Conclusion
The goal of project management isn't to create a perfect chart; it is to deliver value on time. The PERT Critical Path shifts your mindset from the comforting illusion of certainty to the necessary reality of probability. By combining network logic with realistic 3-point estimates, you stop being a victim of unexpected delays and start becoming a manager of risk.
However, calculating weighted averages and redrawing diagrams manually is a recipe for burnout. To make this method work, you need a platform that is as dynamic as your team. Lark offers the perfect environment to automate your estimates, visualize your critical path, and communicate in real-time.
Don't let uncertainty derail your next delivery. Start building your dynamic schedule in Lark today and turn your "best guesses" into a plan you can trust.
FAQs
What is the difference between PERT and Critical Path?
The main difference lies in how they handle time. CPM is deterministic, using a single fixed duration for tasks, which works well for predictable projects. PERT is probabilistic, using three distinct time estimates (optimistic, pessimistic, and likely) to account for uncertainty, making the PERT Critical Path ideal for complex, non-linear projects.
What does PERT stand for?
PERT stands for Program Evaluation Review Technique. It is a statistical tool used in project management that was originally developed by the U.S. Navy. Its primary purpose is to analyze the tasks involved in completing a given project, specifically focusing on the time needed to complete each task under uncertain conditions.
Is CPM easier to understand than PERT?
Generally, yes, because CPM relies on a single time estimate and skips the weighted average calculations required by PERT. However, using CPM alone ignores risk. Modern tools like Lark make PERT just as easy to use as CPM by automating the complex math and instantly visualizing the critical path for you.
What do PERT and CPM stand for?
PERT stands for Program Evaluation Review Technique, and CPM stands for Critical Path Method. While they originated as separate methodologies—one for managing uncertainty and the other for optimizing sequence—they are frequently used together in critical path analysis PERT, to create robust, realistic project schedules.
Related reading
Table of contents
Start using Lark today

Manage all your work in one place
Boost team efficiency by 10x
Save up to 70% on software costs
Table of contents
Start using Lark today
Manage all your work in one place
Boost team efficiency by 10x
Save up to 70% on software costs



2026 Lark Technologies Pte. Ltd.
Headquartered in Singapore with offices worldwide.






Explore: