














Sales Forecast Templates: Top Examples to Plan and Predict Revenue

Ryan Tanner
Product Marketing Specialist
Sep 18, 2026
Ryan Tanner
Sep 18, 2026

15 min read


A sales forecast is a projection of future revenue based on historical data, market trends, and planned activities. It helps businesses plan budgets, allocate resources, and set realistic growth targets. While Excel and Google Sheets templates can be useful starting points, teams often outgrow these static tools as data complexity, collaboration needs, and reporting demands increase.
Sales forecasting helps businesses plan ahead, allocate resources wisely, and set achievable growth targets. Whether you're a small business or an enterprise, using the right template can make the process more accurate and efficient. In this article, you'll explore different types of sales forecast template—such as those provided by Lark—that simplify planning and revenue prediction.

What is a sales forecast template?
A sales forecast template is a structured layout used to predict revenue over specific timeframes, such as monthly, quarterly, or annually. It provides a clear view of expected sales, helping teams track targets, identify trends, and allocate resources effectively.
Templates simplify the forecasting process by organizing key data points like historical sales, pipeline opportunities, and projected growth. This makes it easier to spot patterns, plan inventory, or adjust marketing strategies in advance.
Common formats include Excel or Google Sheets, CRM dashboards, and connected database tools like Lark Base, which allow teams to link data, automate updates, and collaborate in real time.
Visual example: Picture a simple table with columns labeled month, projected sales, actual sales, variance, and notes. This format makes it easy to track performance, spot gaps, and adjust strategies with clarity.
Why sales forecasting matters
Accurate sales forecasting is more than just predicting numbers—it drives smarter business decisions and helps teams stay ahead of challenges. Key benefits include:
- Improved decision-making and resource planning: Forecasting guides staffing, inventory, and operational choices so resources are used efficiently.
- Early identification of revenue risks: Spotting trends or shortfalls early allows teams to adjust strategies before problems escalate.
- Better alignment between sales and marketing: Forecasts ensure both teams work toward shared goals, improving campaign effectiveness and lead management.
- Data-driven budgeting and goal setting: Reliable projections make it easier to set realistic targets, allocate budget, and track progress.
With these advantages in mind, let's explore some practical sales forecast templates you can use to get started.
Sales forecast templates recommended
Here are some common sales forecast templates that teams frequently use, along with when and why they're helpful:
Monthly sales forecast template
The monthly sales forecast template for sales analysts aims to assist you in evaluating and monitoring sales performance across various regions and products each month. Featuring in-depth information on overall sales, generated revenue, cost of goods sold (COGS), gross margin, sales targets, and performance against those targets, this template offers a thorough snapshot of your sales activities.
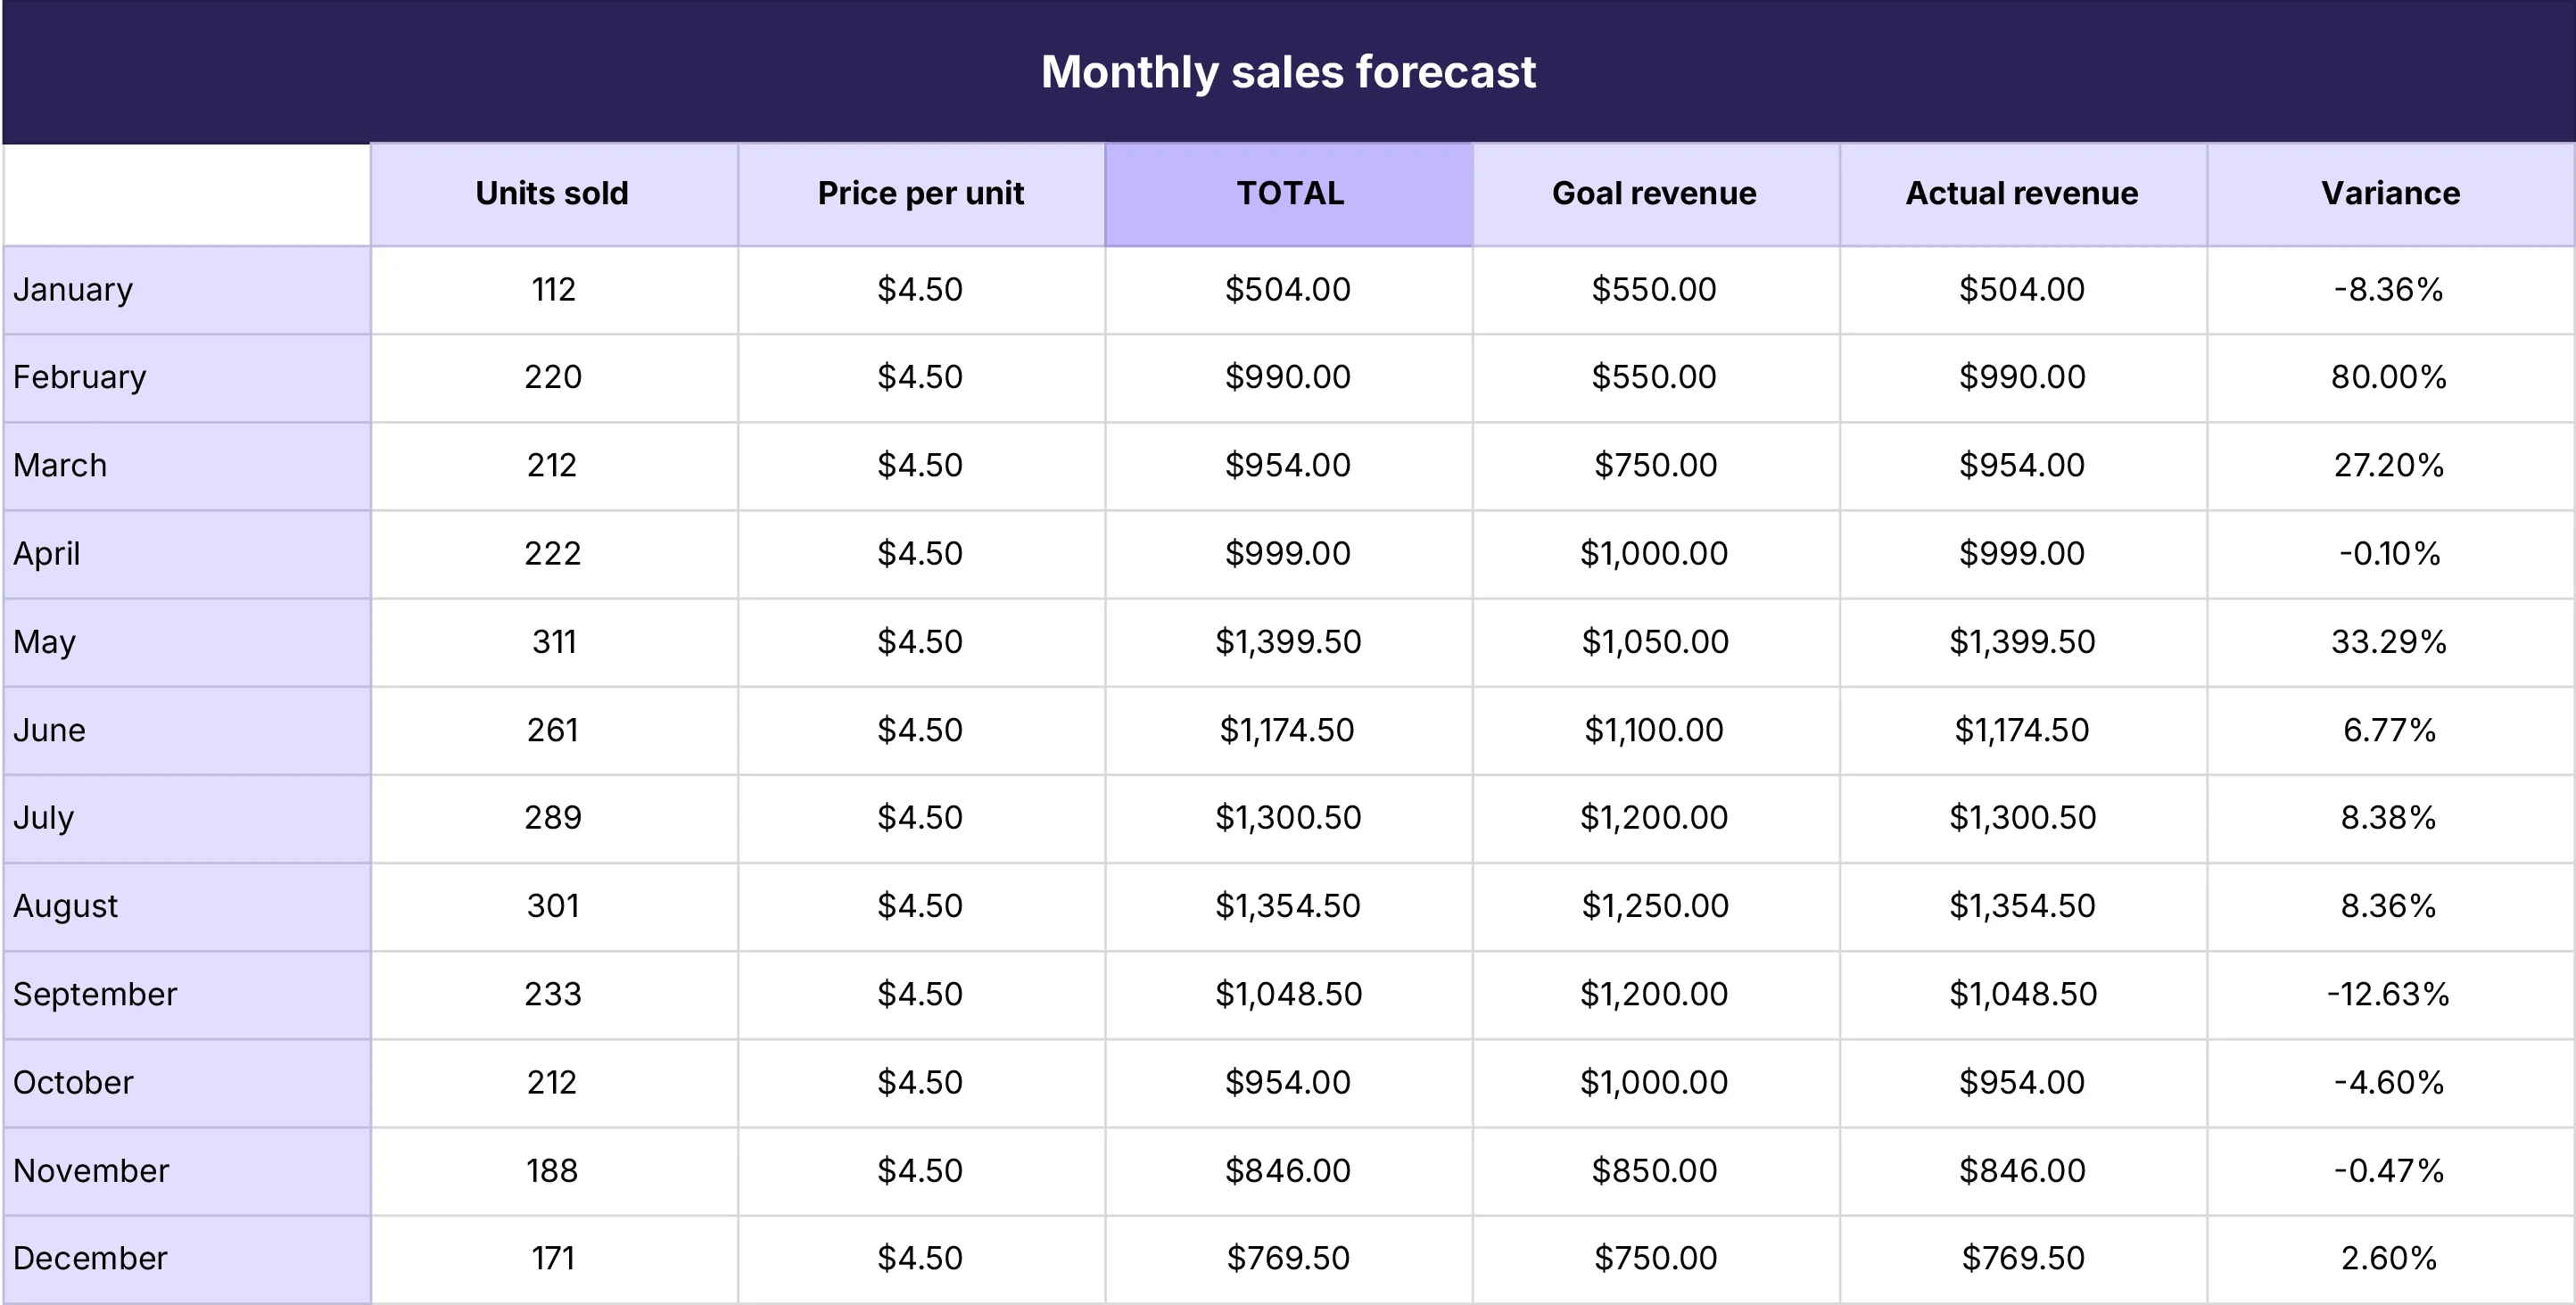
Image source: zapier.com
Quarterly or yearly sales forecast template
A quarterly or yearly sales forecast template helps businesses plan long-term revenue goals and monitor performance over extended periods. It typically includes sections for projected sales, actual sales, variance, and growth trends. By comparing data across quarters or years, evaluating performance, and making informed decisions for budgeting, marketing, and resource allocation.
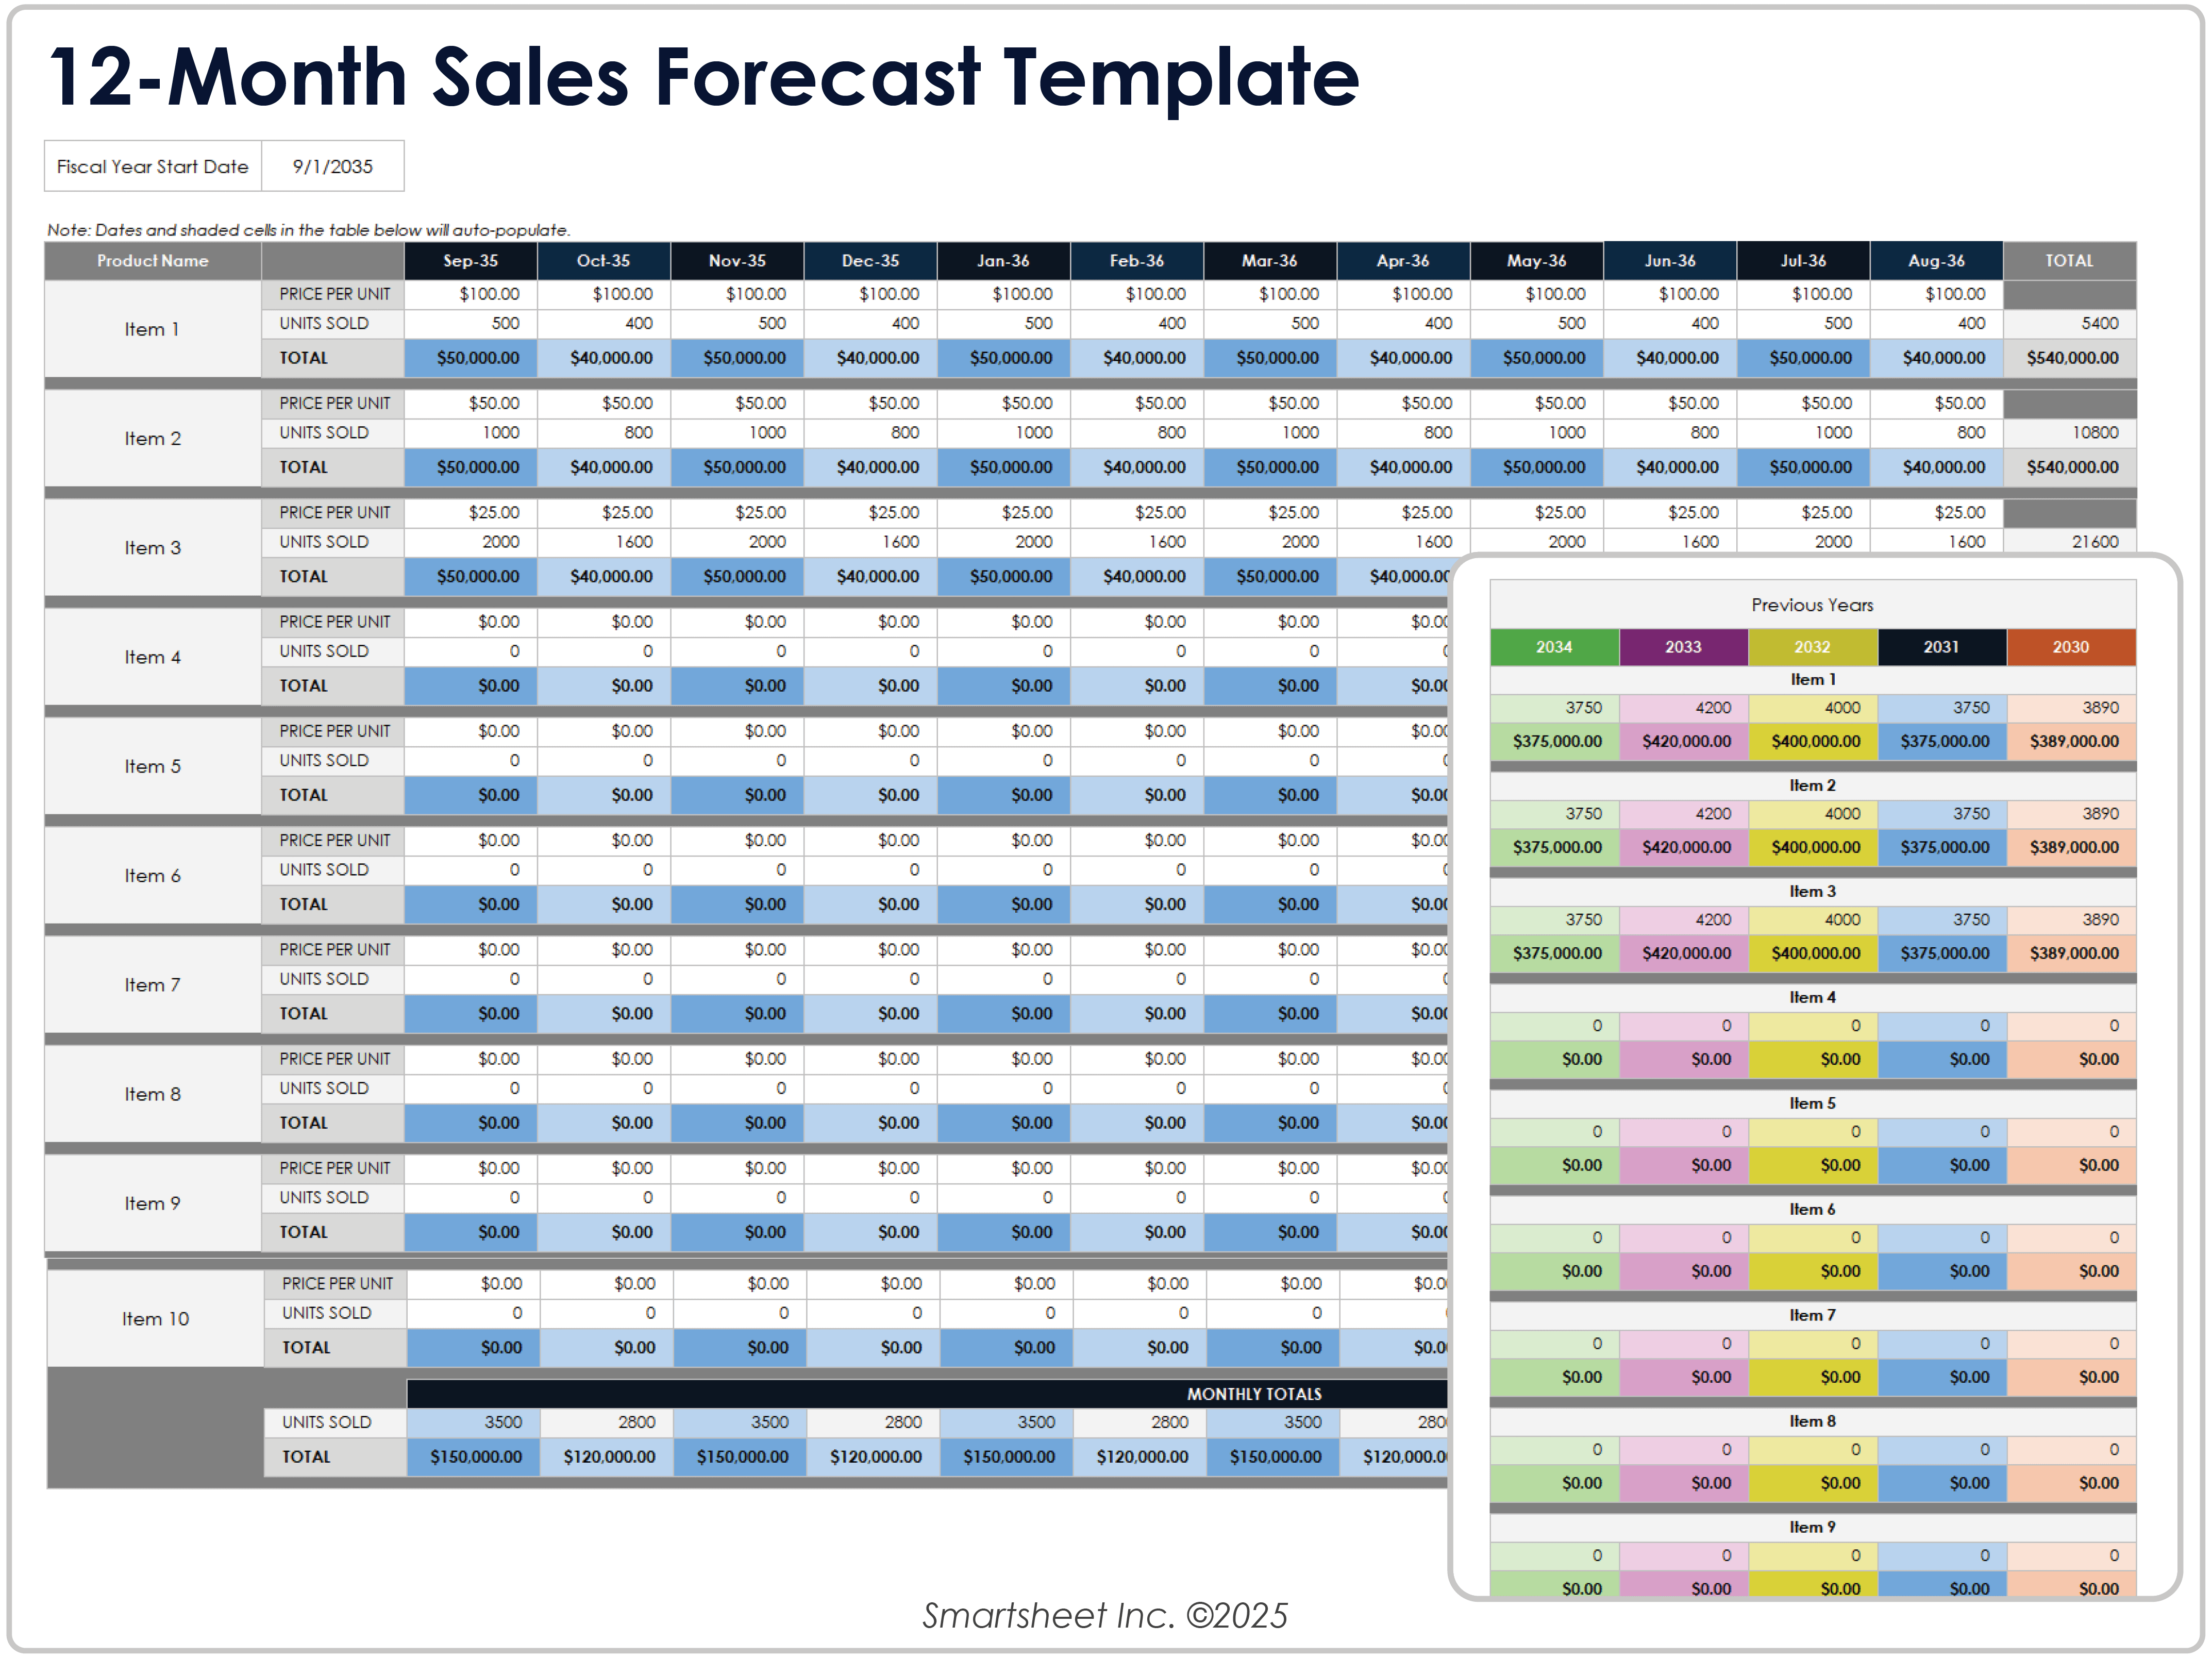
Image source: smartsheet.com
Excel sales forecast template
An Excel sales forecast template is a practical tool for estimating future sales using familiar spreadsheet functions. It allows you to organize data by product, region, or time period and automatically calculate totals, growth rates, and variances. With built-in formulas and customizable charts, it helps visualize trends and track performance against goals.
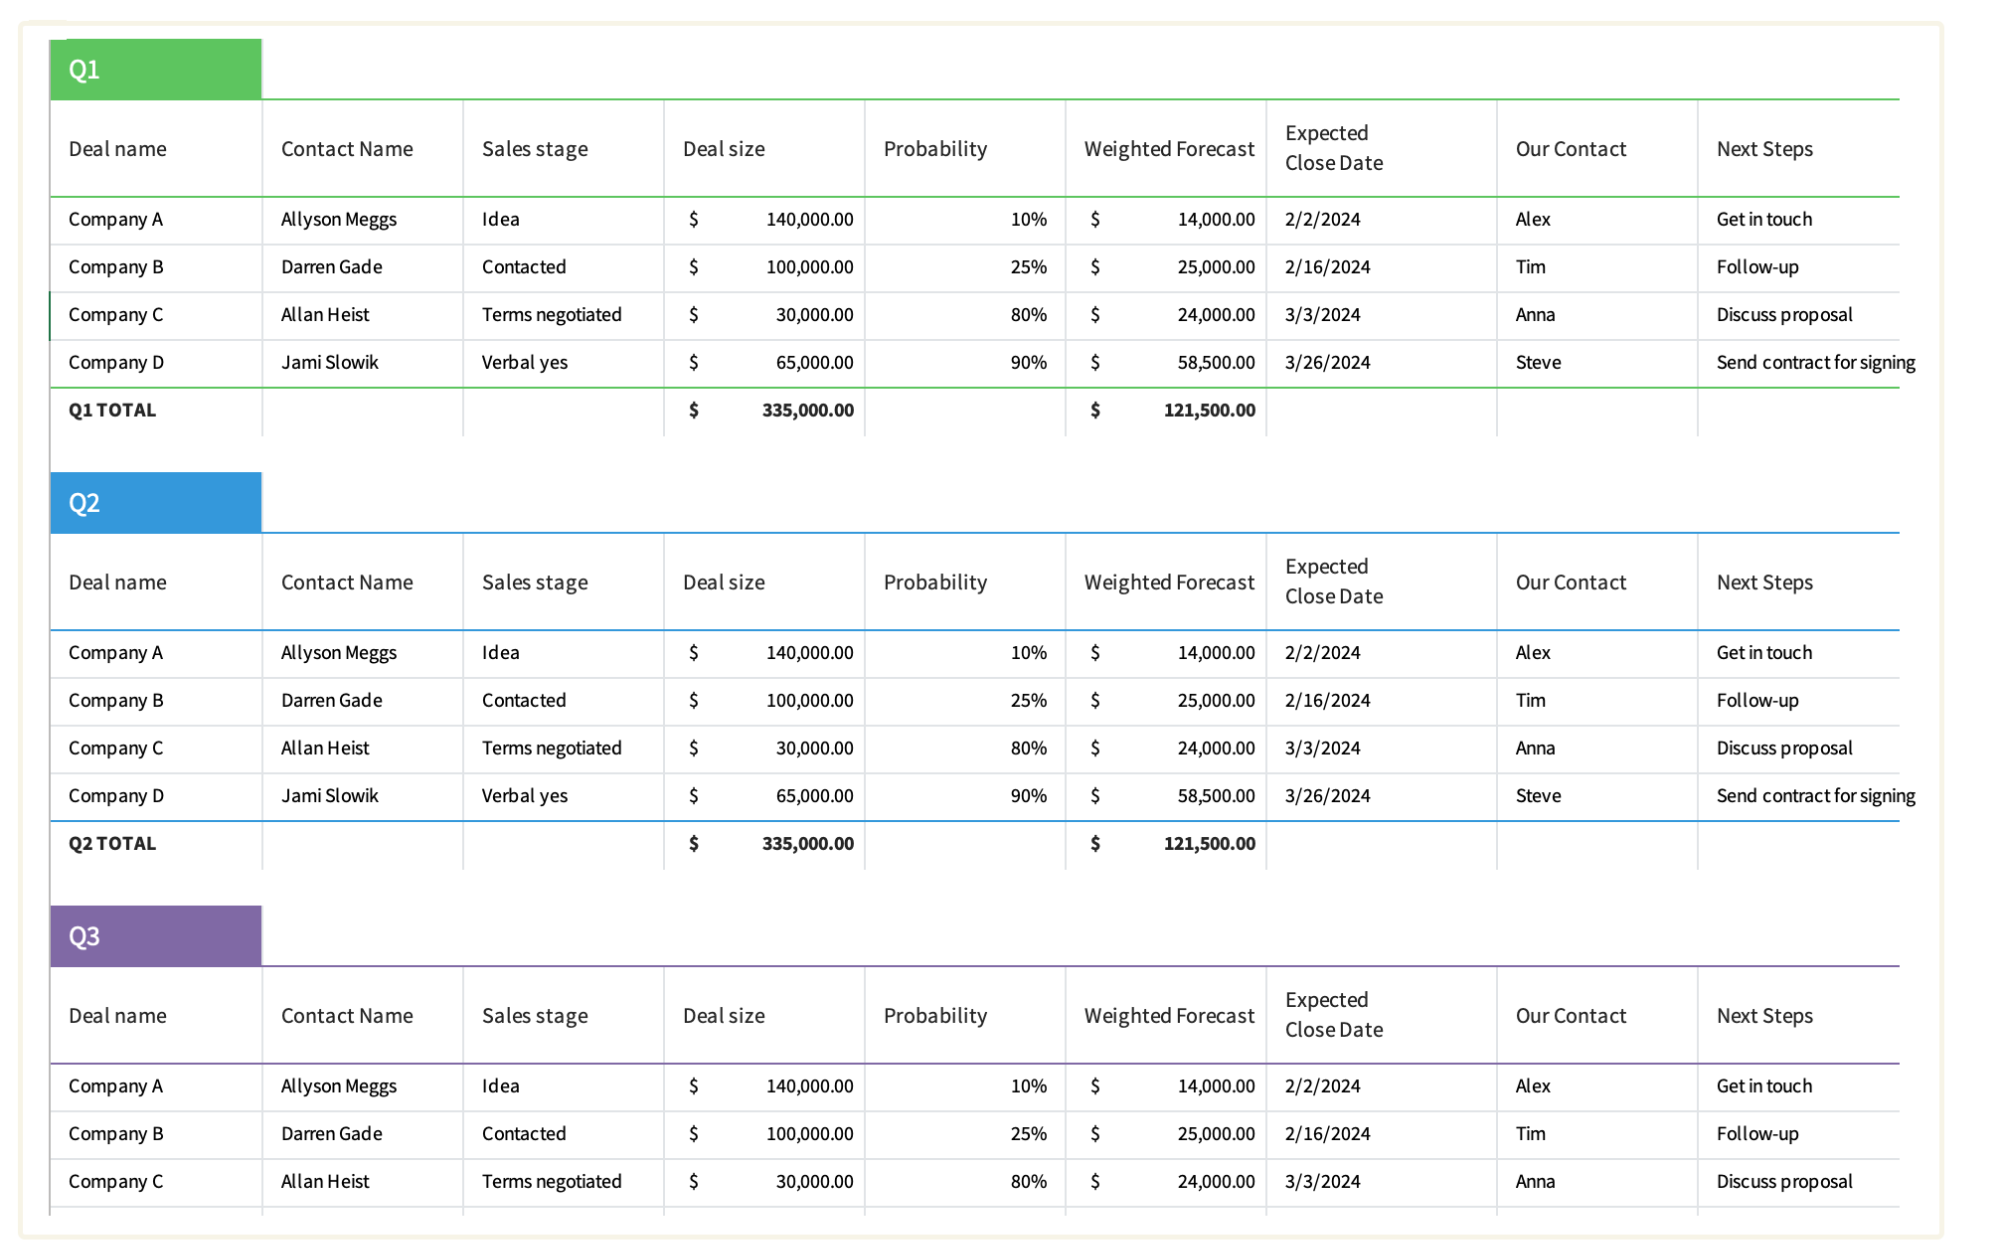
Image source: pipedrive.com
Google Sheets sales forecast template
A Google Sheets sales forecast template is a convenient option for teams that need real-time collaboration and easy access from anywhere. It allows multiple users to view and update projections simultaneously, keeping data current and transparent. With features like shared editing, and built-in charts, it simplifies tracking sales trends and comparing actual results to targets.
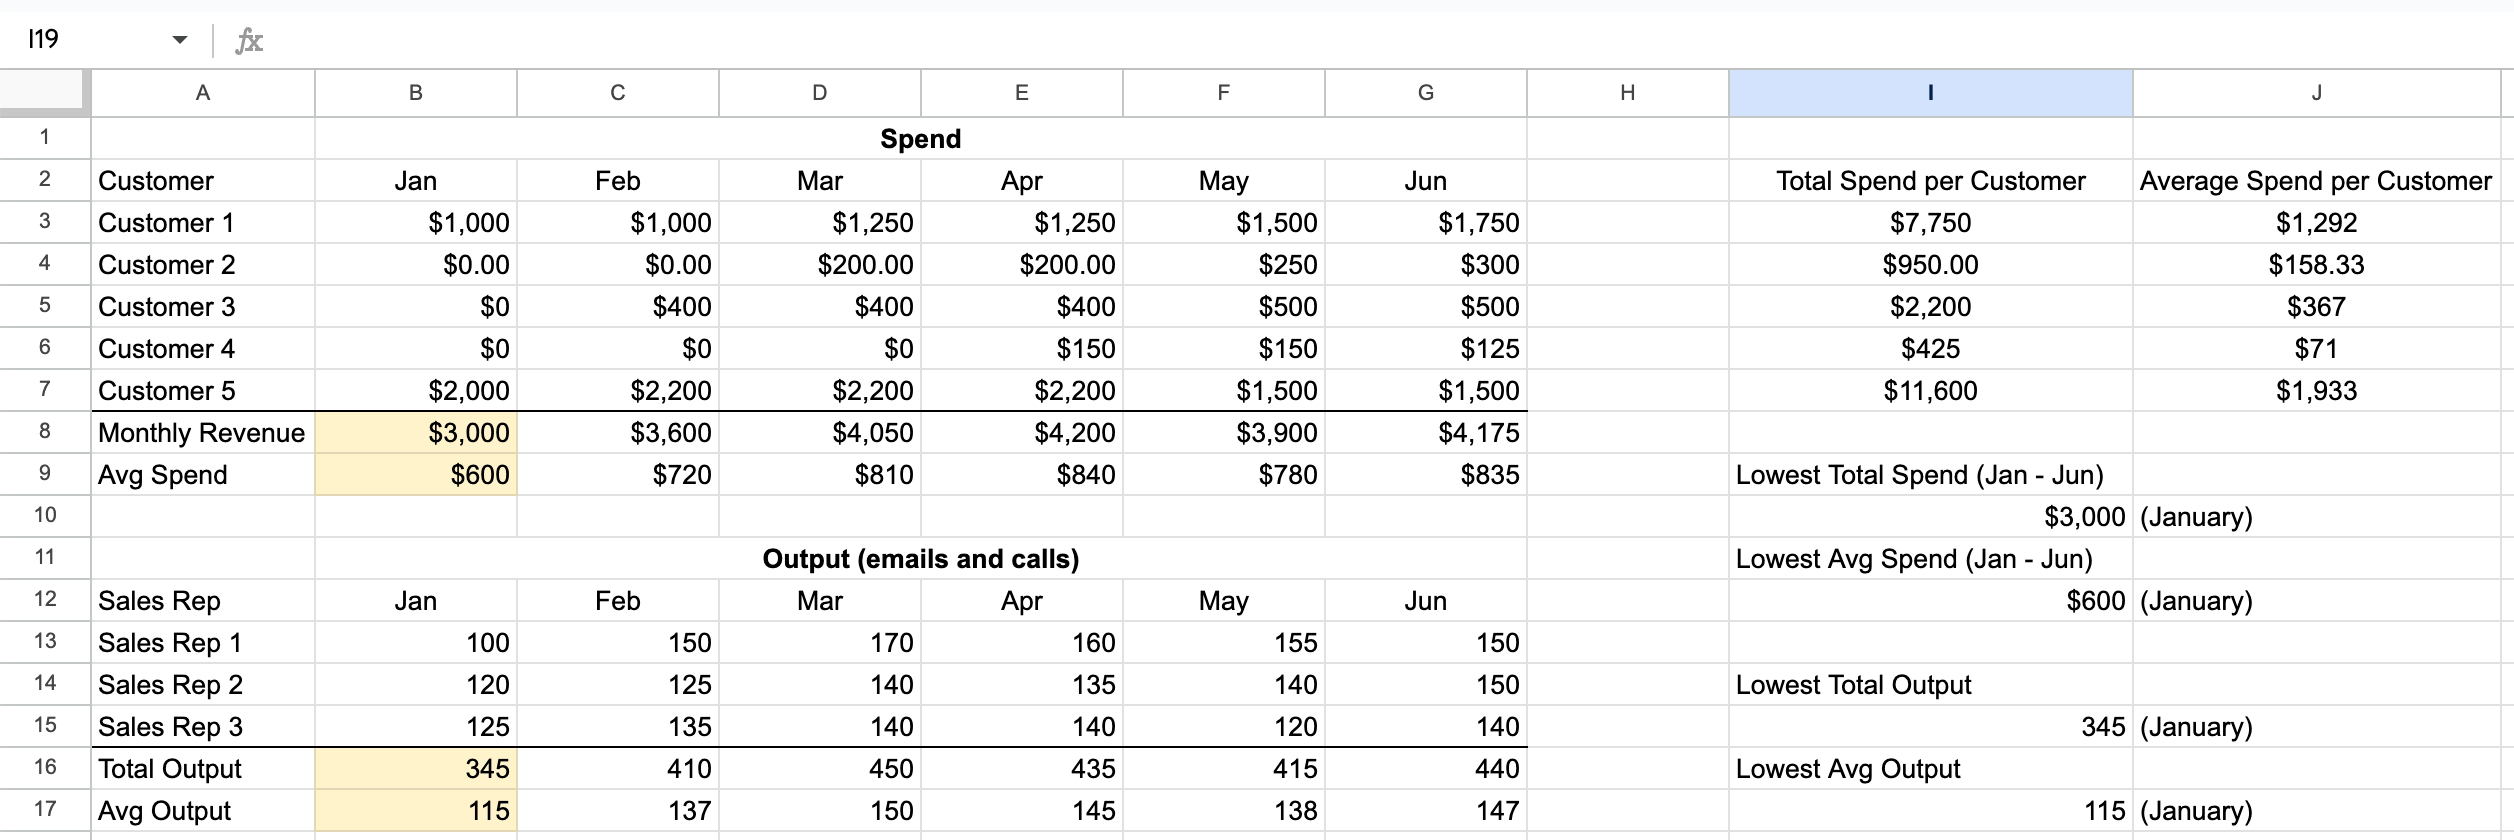
Image source: workspace.google.com
Restaurant or retail sales forecast template
A restaurant or retail sales forecast template is designed to help businesses predict revenue based on factors like foot traffic, menu or product pricing, and seasonal demand. It usually includes sections for daily, weekly, or monthly sales estimates, along with columns for actual performance and variance.
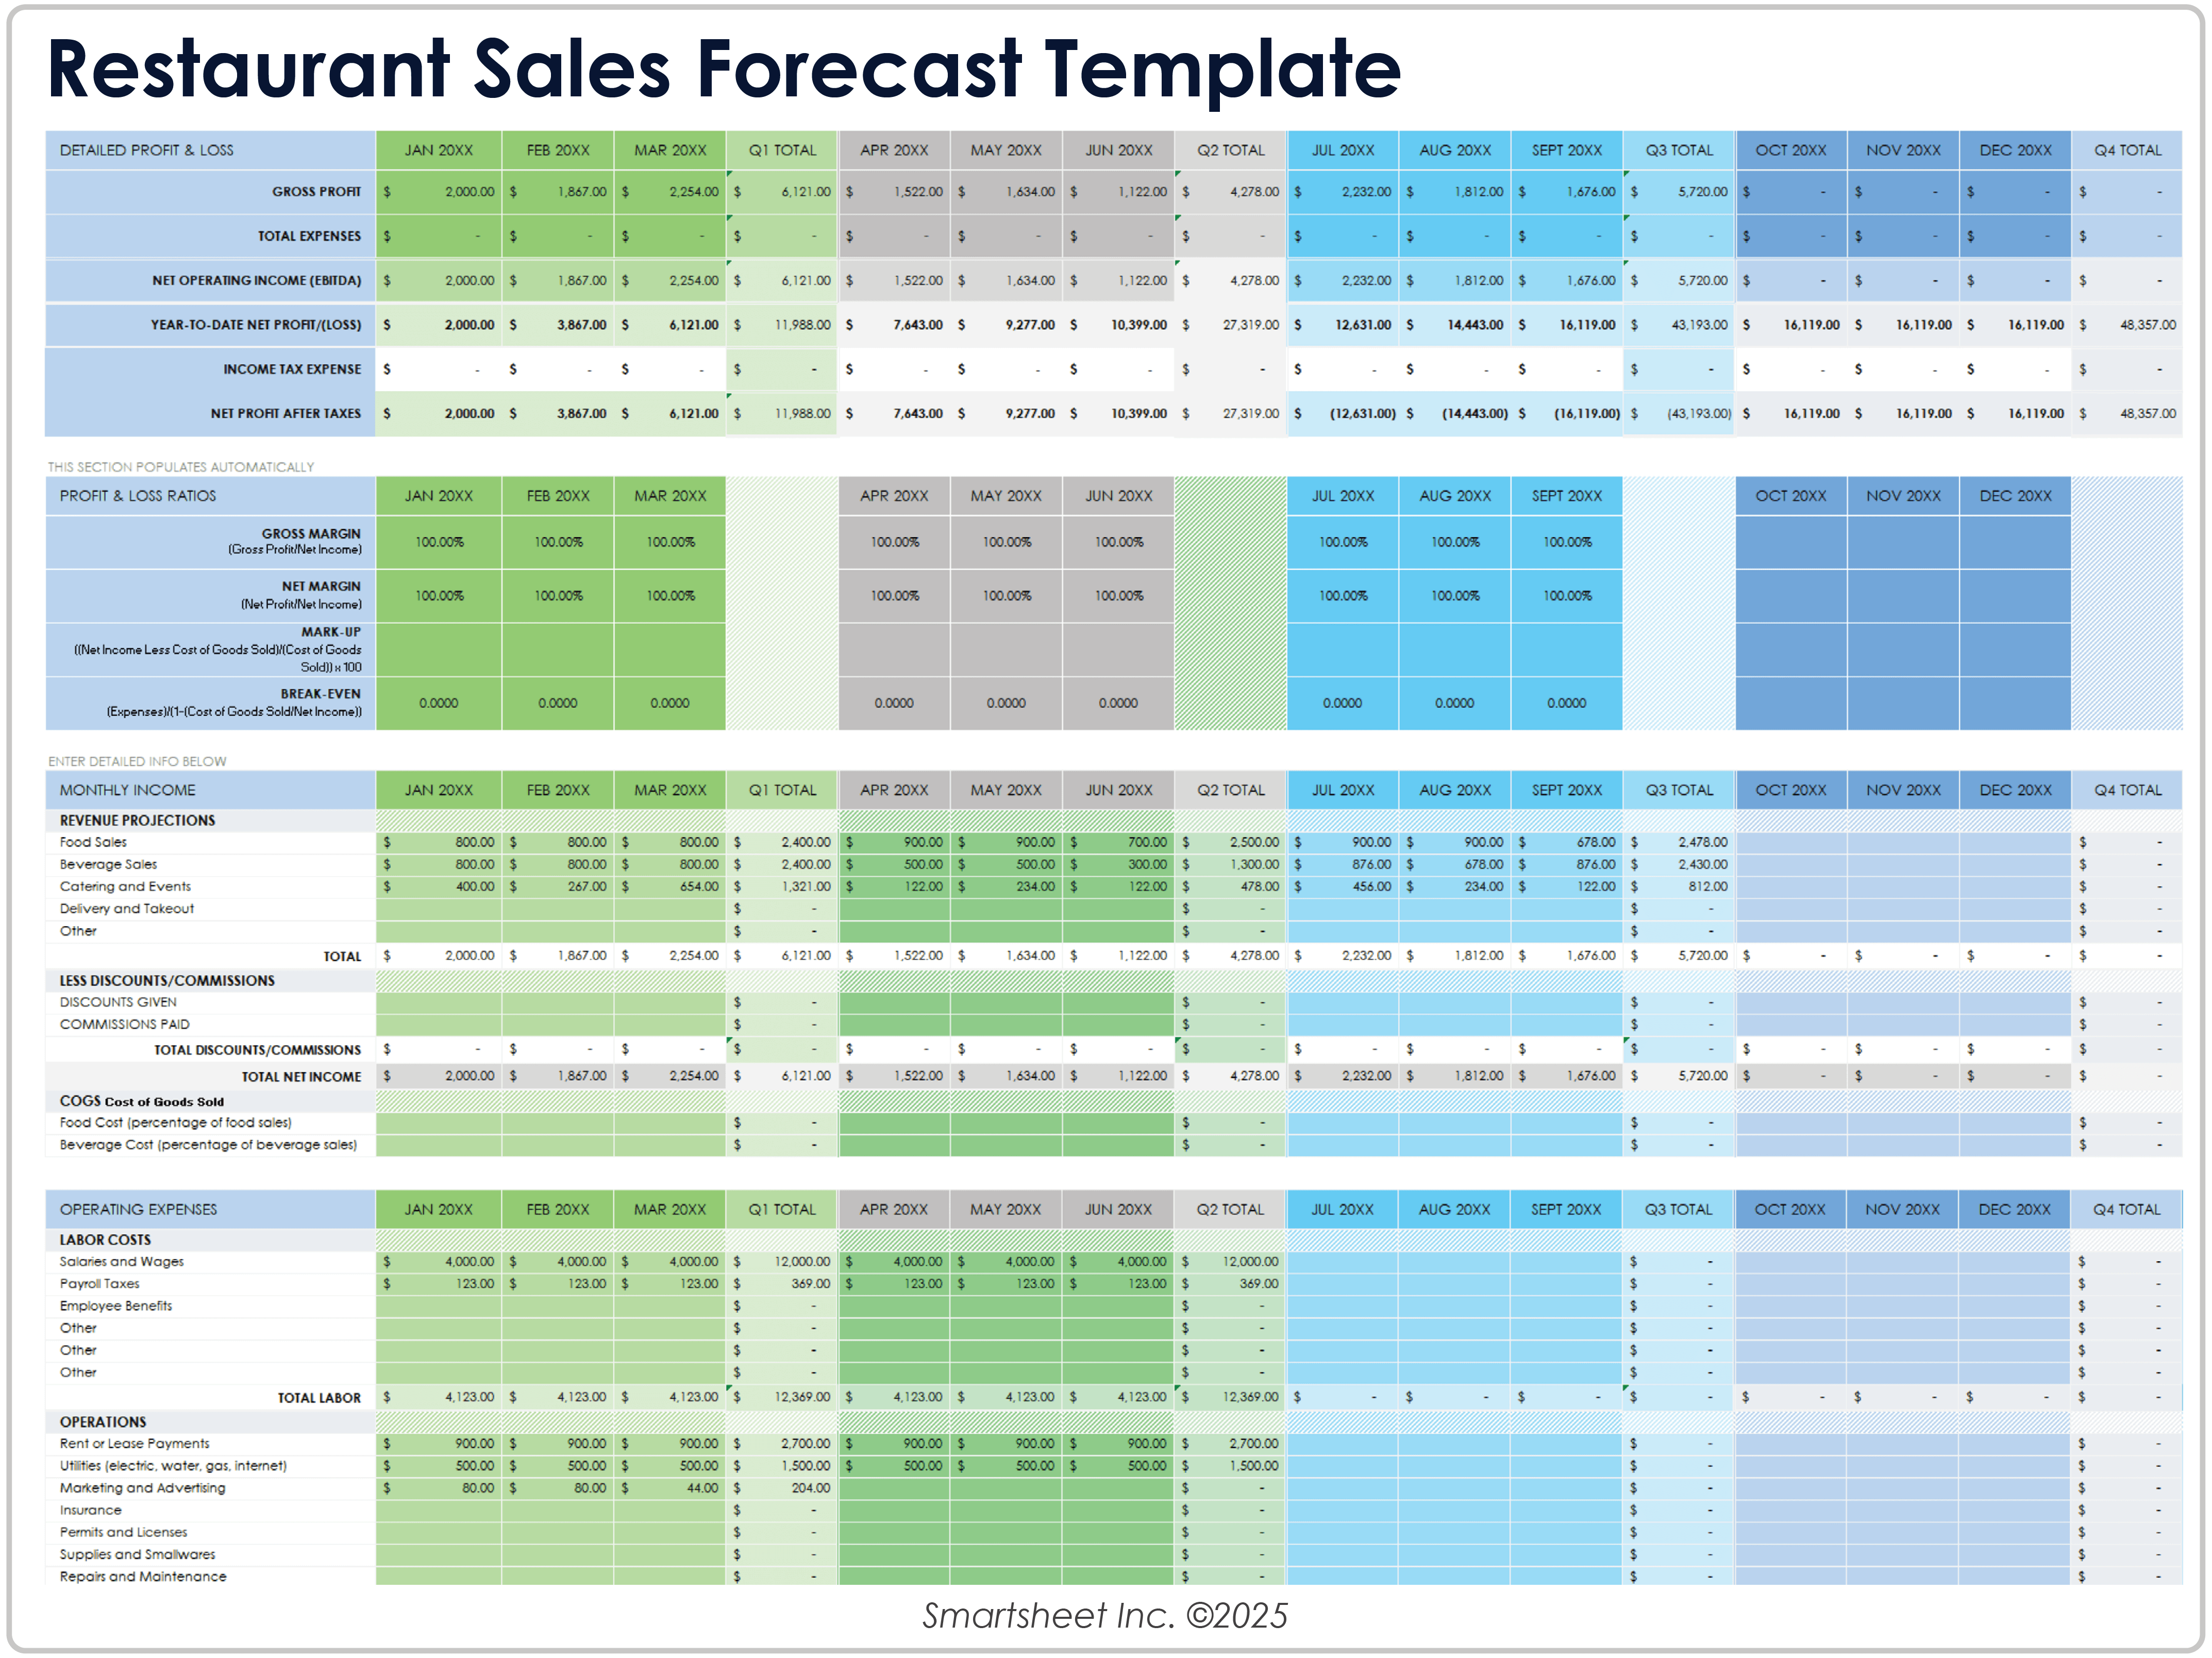
Image source: smartsheet.com
B2B pipeline-based forecast template
A B2B pipeline-based forecast template helps sales teams predict revenue by tracking deals at different stages of the sales funnel. It typically includes fields for lead source, deal size, stage probability, expected close date, and assigned sales rep. By combining this data, businesses can estimate potential revenue and identify which opportunities need attention.
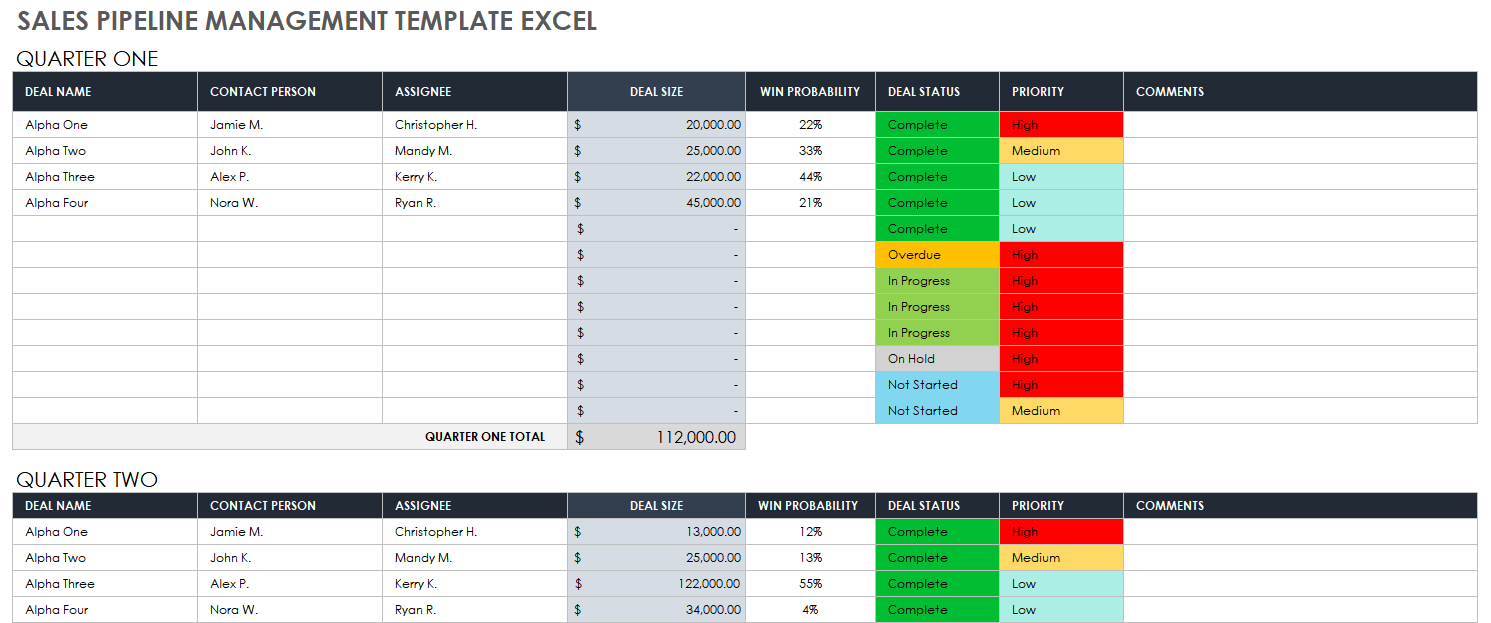
Image source: smartsheet.com
Ready-to-use sales forecasting templates: Smarter and more connected
Managing sales forecasts can get complicated when teams rely on static spreadsheets or disconnected tools. Lark's sales forecasting templates simplify the process by combining ready-to-use layouts, automation, and real-time collaboration in a single workspace.
Teams can input data, track targets, and update projections instantly, ensuring everyone works from the same information. Whether you're forecasting monthly sales, pipeline revenue, or long-term growth, Lark keeps your numbers accurate and actionable. With built-in charts, linked documents, and collaborative comment threads, these templates make it easy to plan, predict, and adjust strategies quickly—without the version-control headaches of traditional tools.
National sales data dashboard
The national sales data dashboard template gives teams a complete, real-time snapshot of performance across regions, channels, and product lines. It helps sales leaders quickly identify growth areas and underperforming zones with visual trend analysis. By consolidating data into one interactive view, teams can make faster, data-backed decisions. The dashboard also supports forecasting accuracy by spotting demand fluctuations early. Ideal for companies managing large, multi-location operations that rely on consistent national insights.
Daily sales forecast report
The daily sales forecast report template keeps teams aligned on short-term goals by tracking daily targets, actual sales, and performance gaps. It offers clear visualizations that reveal how today’s results shape future forecasts. Managers can use it to identify patterns, adjust strategies, or optimize promotions in real time. The report ensures forecasting is proactive rather than reactive, improving responsiveness to market changes. Perfect for retail, distribution, and e-commerce businesses needing agile daily insights.
Sales monthly report template
A sales monthly report template helps teams summarize performance for each month in a clear, organized way. It tracks actual sales against targets, highlights trends, and identifies areas needing attention. This template provides a structured layout for revenue, top-selling products, and key metrics. Managers can quickly review results and share insights with stakeholders. By using a monthly report template, teams can make informed decisions and adjust strategies before the next cycle begins.
Revenue forecasting template
A revenue forecasting template helps businesses predict future income based on historical data, market trends, and planned initiatives. It provides a structured format to project revenue across different periods, such as monthly, quarterly, or yearly. Teams can use it to plan budgets, allocate resources, and identify potential gaps before they impact performance. The template also makes it easier to track actual revenue against forecasts and adjust strategies in real time. By using a revenue forecasting template, businesses gain a clearer view of growth potential and can make data-driven decisions confidently.
Sales forecast report template
A daily sales forecast report template helps businesses predict and track sales on a day-to-day basis. It breaks down expected revenue, product performance, and customer trends for each day, allowing teams to respond quickly to fluctuations. This template is especially useful for retail, restaurants, or high-volume sales environments where daily insights drive operational decisions. By comparing actual sales with daily forecasts, teams can spot trends, adjust staffing, and optimize inventory. Using a daily sales forecast template ensures consistent monitoring and supports proactive decision-making to meet short-term targets efficiently.
Budget raw material cost forecast template
A budget raw material cost forecast template helps businesses plan and track the costs of raw materials needed for production. It provides a structured layout to estimate expenses, compare against actual costs, and adjust purchasing strategies. This template is particularly useful for manufacturing, food production, or any business relying on physical inventory. By forecasting raw material costs, teams can optimize budgets, reduce waste, and maintain healthy profit margins. Using this template ensures cost control while keeping procurement and production aligned with overall financial goals.
Forecasting inventory model template
A forecasting inventory model template helps businesses predict stock levels based on historical sales, seasonal trends, and upcoming demand. It provides a clear framework to plan orders, prevent stockouts, and minimize overstocking. This template is valuable for retail, e-commerce, and manufacturing teams that need to balance supply with customer demand. By using it, teams can optimize inventory, reduce holding costs, and improve cash flow. The forecasting inventory model template ensures products are available when needed while keeping storage and procurement efficient.
Lark: Dynamic, collaborative forecasting beyond templates
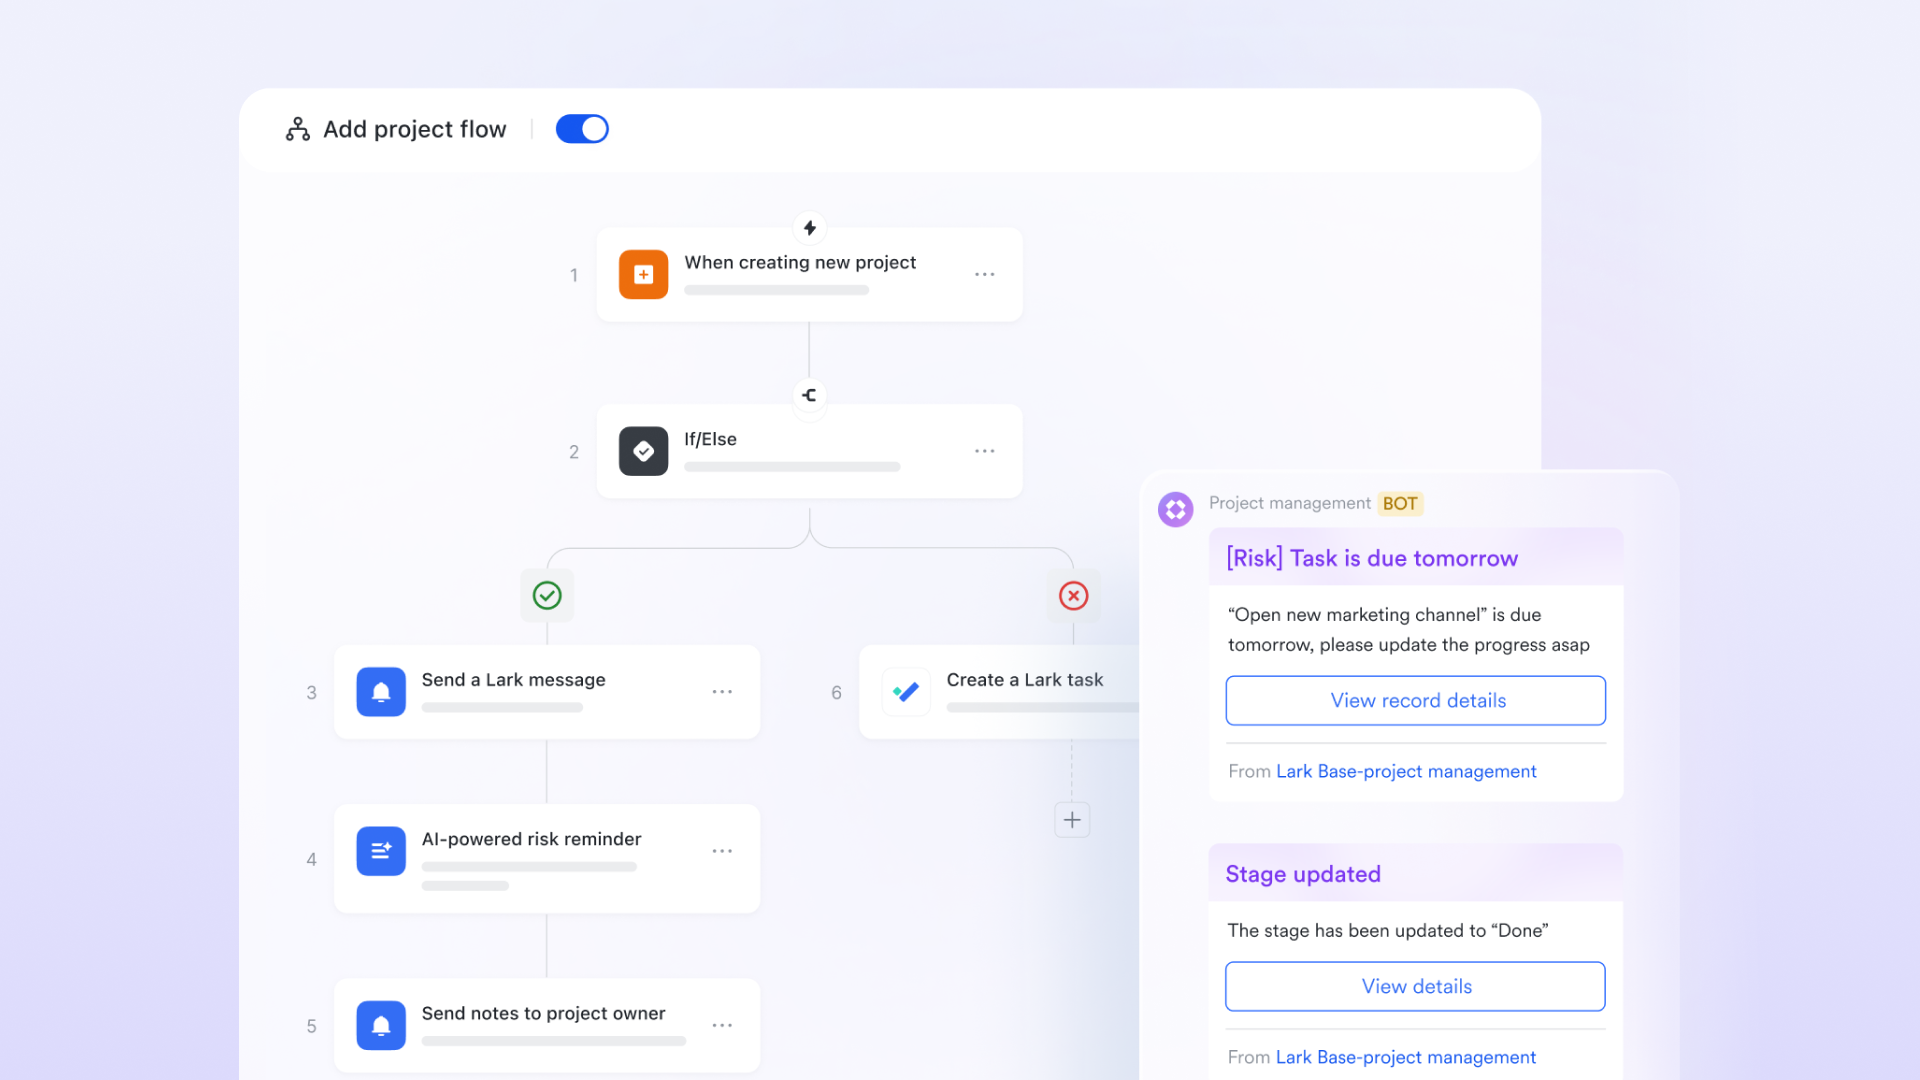
For sales forecasting, a suitable template is important, but the sales team also needs other aspects to promote sales results. Forecasting can be complex, especially when relying on rigid templates that don't adapt to changing needs. Lark offers a dynamic, collaborative approach that goes beyond traditional methods. With real-time updates, seamless team collaboration, and flexible planning tools, Lark empowers teams to make informed decisions faster. Whether tracking sales projections, resource allocation, or project timelines, it centralizes data while keeping everyone aligned.
Lark Base: Centralized forecasting and automation
Lark Base makes forecasting simple, organized, and automated. Teams can create relational sales databases with key fields like product, region, sales rep, forecasted amount, and close probability. Real-time dashboards provide a clear view of expected versus actual revenue, helping managers spot trends instantly. Automation keeps forecasts up to date—when a deal closes in Lark, base adjusts projections automatically, saving time and reducing errors. For example, sales managers can filter forecasts by rep, region, or deal stage with a single click, making it easy to focus on what matters most and make data-driven decisions.
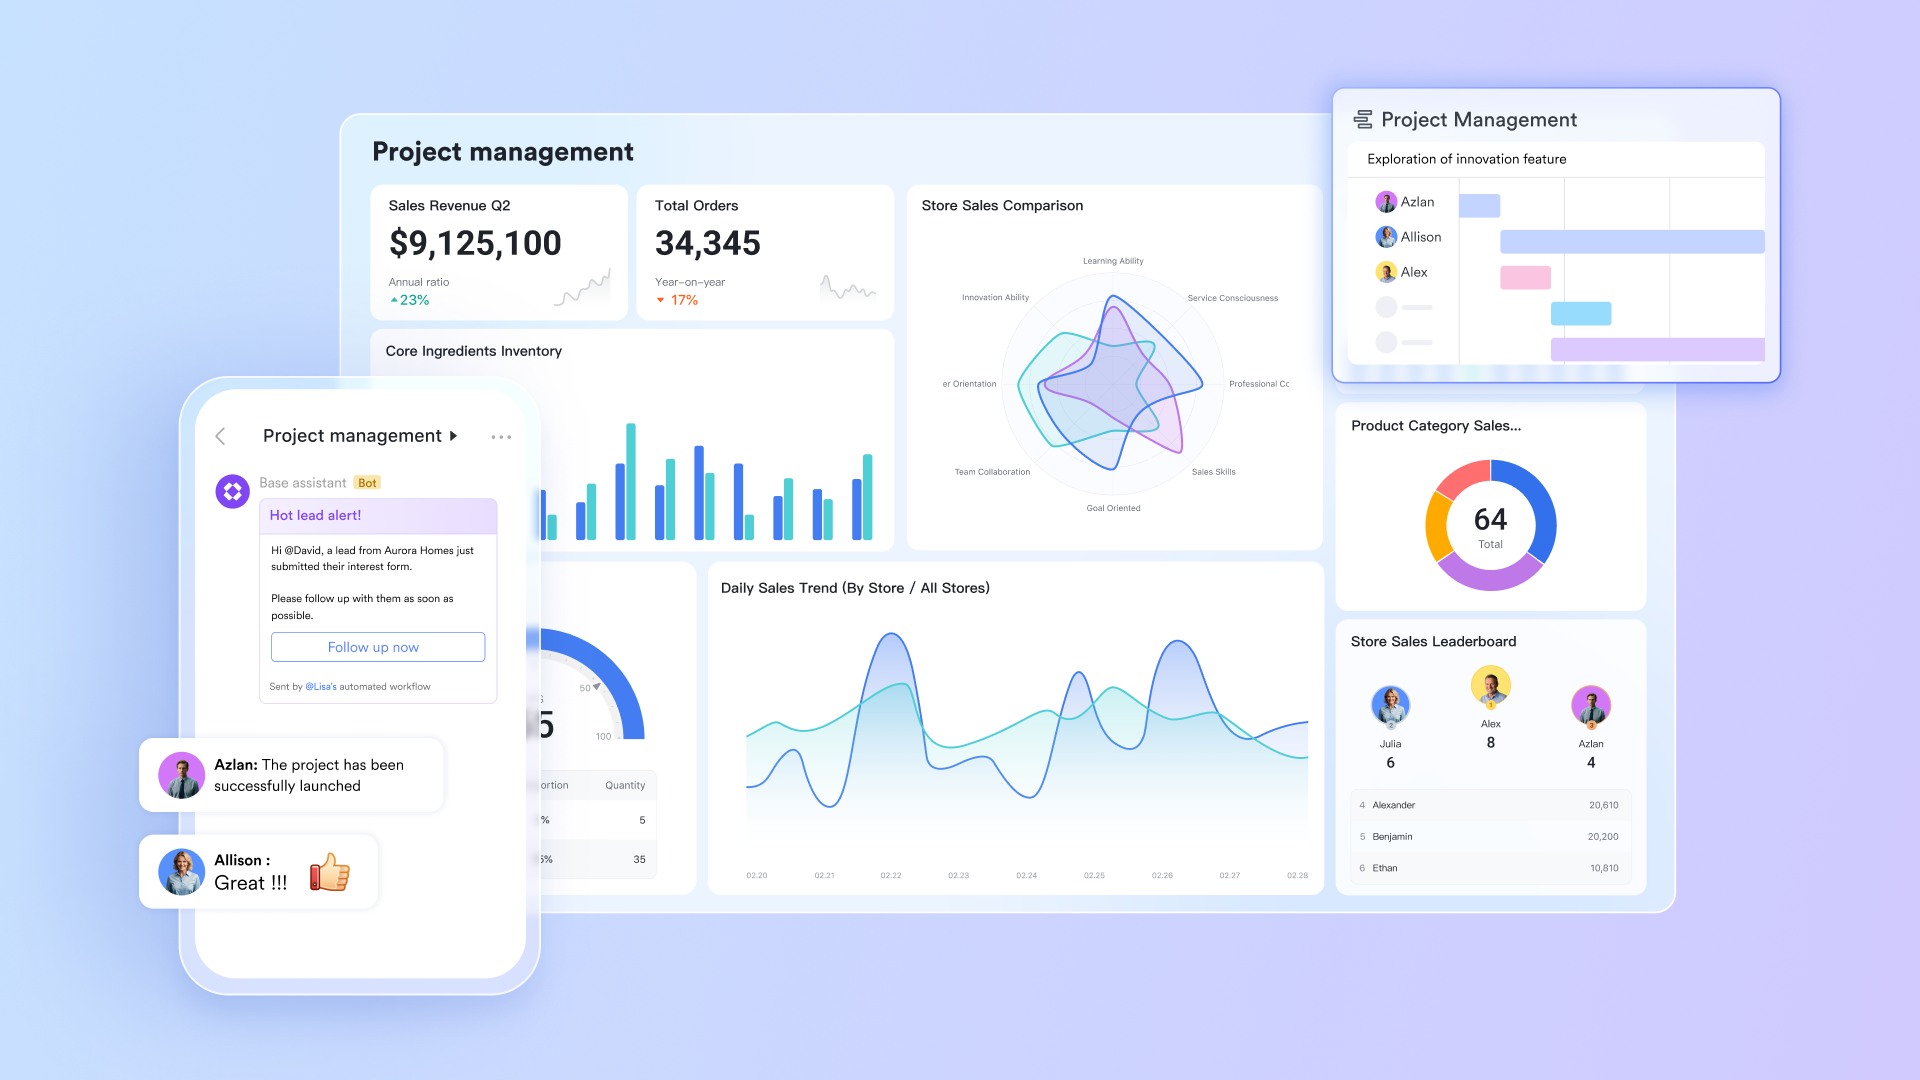
Lark Sheets: Flexible forecasting for teams
Lark Sheets gives teams the flexibility to run fast calculations, create pivot tables, and perform "what-if" analyses without hassle. By linking sheets directly to Lark Base data, forecasts stay live and up to date, eliminating manual entry and reducing errors. Teams can quickly compare projections to actual results, spot trends, and adjust plans on the fly. For example, monthly forecasts can be automatically compared to actual revenue, providing instant insights for better decision-making. With Lark Sheets, teams gain both the speed and accuracy needed to keep forecasting agile and collaborative.
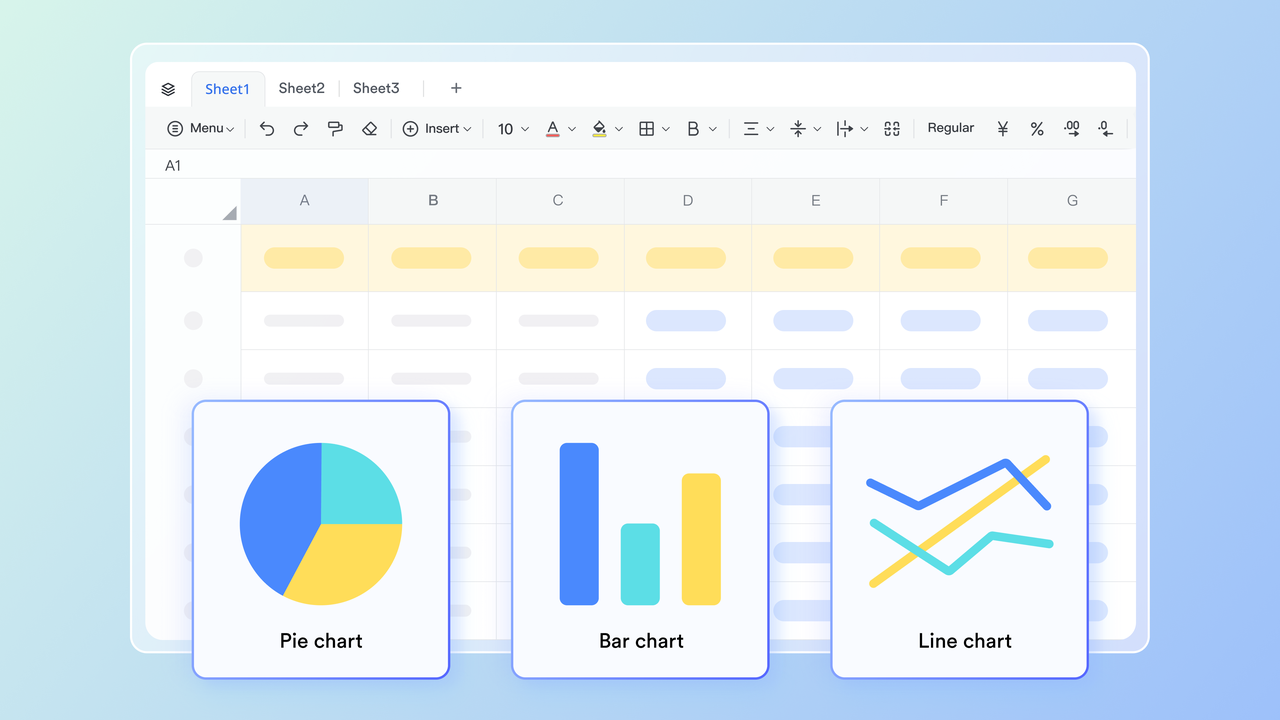
Lark Tasks: Manage forecasting accountability
Lark Tasks helps teams stay accountable and organized when it comes to forecasting. Managers can assign forecast reviews, data entry, and validation tasks to sales leads, ensuring every part of the process is covered. Progress can be tracked in real time, making it easy to see which updates are complete and which need attention. By keeping forecast responsibilities clear and on schedule, Lark Tasks ensures that projections remain accurate, timely, and reliable, so teams can make decisions with confidence.
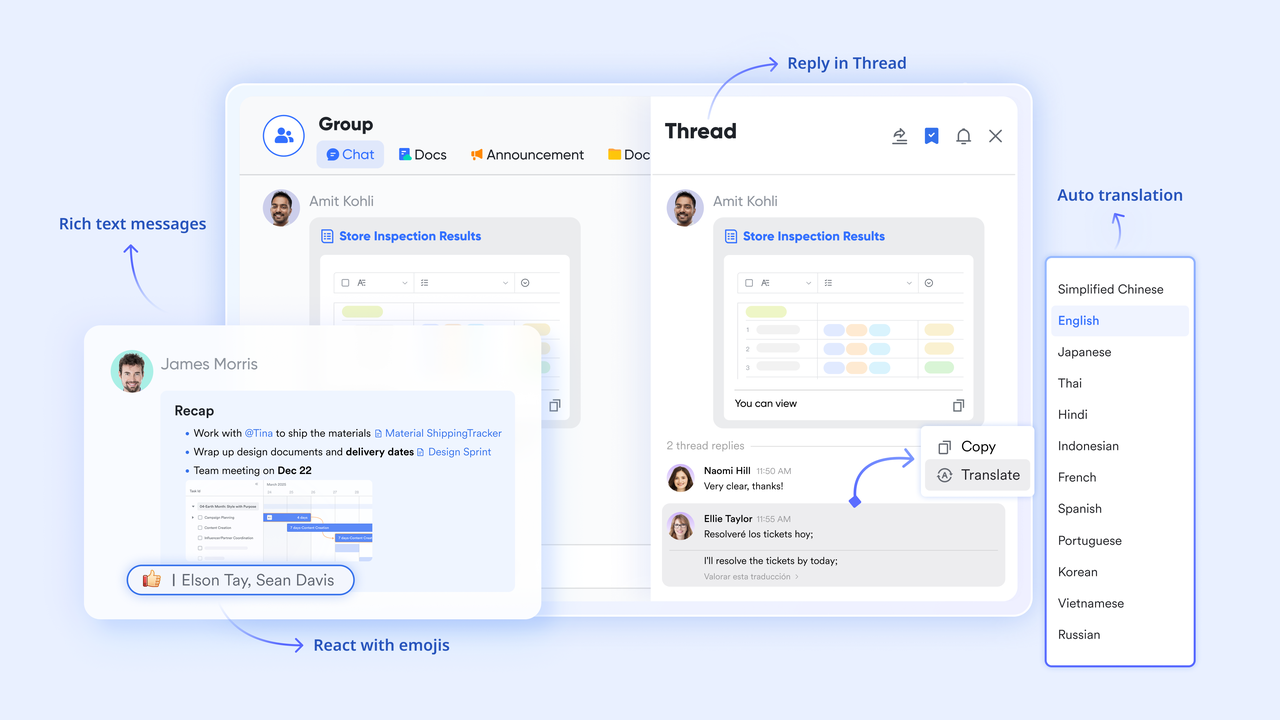
Lark Messenger & Lark Meetings: Real-time collaboration
Lark Messenger and Lark Meetings make it easy for teams to collaborate on forecasts in real time. Forecast adjustments can be discussed directly within chat threads, keeping conversations organized and accessible. Updates can also be shared during meetings, with live data pulled straight from Lark Base or Lark Sheets. For example, regional sales heads can review updated numbers during weekly syncs in Lark Meetings, ensuring everyone is aligned and decisions are based on the latest information. This seamless integration of communication and data keeps forecasting transparent, collaborative, and efficient.
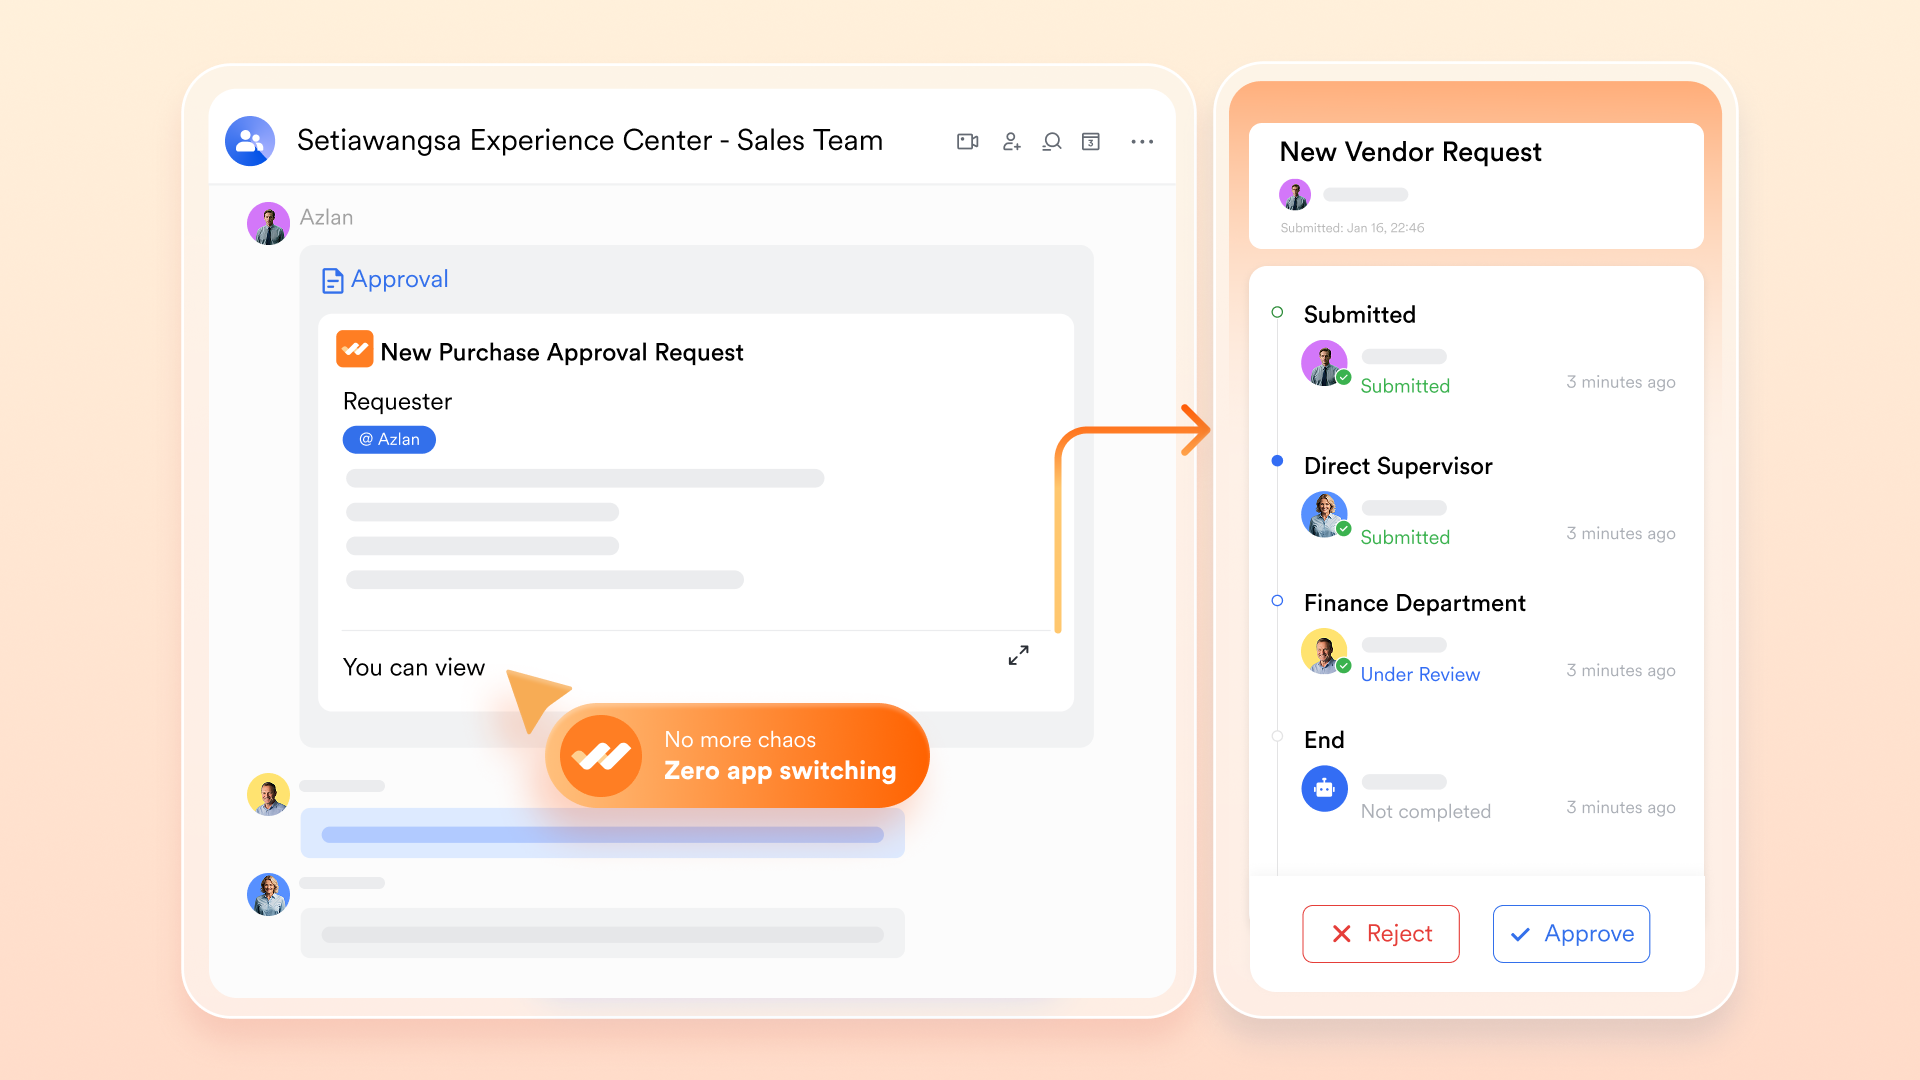
Lark Approval: Streamline forecast sign-offs
Lark Approval ensures that forecast validation is structured and transparent. Teams can formalize the approval process, moving forecasts seamlessly from sales to finance and then to leadership. Every change and sign-off is tracked, giving full visibility into who approved or edited key figures. This accountability not only reduces errors but also speeds up decision-making, ensuring that forecasts are accurate, reliable, and ready for action.
How to create a sales forecast in Lark (step-by-step)
Creating a sales forecast in Lark is simple and collaborative. Follow these steps to get started:
- Start with a Lark Base sales forecast template: Choose a ready-made template from the Lark library to structure your forecast quickly.
- Add key parameters: Input essential details such as region, sales representative, product, forecast value, probability, and expected close date to capture the full picture.
- Set automation: Configure rules so the system updates deal statuses automatically as opportunities move through the pipeline, reducing manual tracking.
- Build a dashboard view: Visualize performance with charts, graphs, and tables that highlight trends, targets, and gaps at a glance.
- Use AI summaries: Leverage Lark's built-in AI Meeting Notes to generate weekly insights, summaries, and recommendations to help your team stay informed and make data-driven decisions.
With these steps, Lark transforms sales forecasting from a static process into a dynamic, real-time workflow.
Sales forecast use cases by industry
Sales forecasting isn't one-size-fits-all—different industries use it to meet unique goals and challenges.
- SaaS and B2B sales: Track pipeline health, monitor subscription renewals, and predict startup recurring revenue to guide growth strategies.
- Retail and e-commerce: Plan inventory and staffing around seasonal demand peaks and promotional campaigns to maximize sales.
- Hospitality and restaurants: Forecast daily or weekly sales trends to optimize staffing, menu planning, and resource allocation.
- Manufacturing: Align production schedules with projected sales to reduce overstock, prevent shortages, and manage costs efficiently.
- Agencies and consultancies: Predict project-based revenue, helping with resource planning, client budgeting, and financial forecasting.
Using industry-specific sales forecasts ensures teams can make informed decisions, reduce risks, and improve operational efficiency.
Conclusion
Sales forecasting is essential for business growth—but its effectiveness depends on the system supporting it. While spreadsheets and templates offer structure, they can become fragmented and hard to maintain as teams scale. Lark takes forecasting to the next level by combining connected data, automation, and real-time collaboration in one platform. Teams can track performance, update projections, and generate insights seamlessly, ensuring everyone works from the same information. By using Lark's sales forecasting templates, businesses can plan more accurately, respond faster to changes, and make data-driven decisions with confidence.
FAQs
What is the best tool for sales forecasting?
The best tool depends on your business size, goals, and workflow. Some popular options include:
- Lark: Ideal for teams that need real-time collaboration and sync data management.
- Zoho analytics: Good for businesses that rely heavily on data visualization.
- HubSpot sales hub: Useful for sales teams already using HubSpot’s CRM.
- Pipedrive: Simple and effective for small to mid-sized sales teams.
Each tool offers different strengths, so the right choice depends on your specific needs.
Can I automate a sales forecast in Lark?
Yes, with Lark Base, you can automate data updates, create workflows, and schedule reports. This saves time and keeps your forecast accurate without manual input.
How is Lark better than Excel or Google Sheets for forecasting?
Excel and Google Sheets have their own strengths — Excel offers powerful formulas and customization, while Google Sheets makes sharing and editing simple. However, Lark takes forecasting a step further with real-time collaboration, workflow automation, and built-in dashboards. It helps teams update and track forecasts together without dealing with multiple versions or manual data entry.
Can teams from different departments access the same forecast in Lark?
Definitely, Lark allows multiple teams to access and update the same forecast with proper permissions. Everyone stays aligned, with one source of truth.
Related reading
Table of contents
Start using Lark today

Manage all your work in one place
Boost team efficiency by 10x
Save up to 70% on software costs
Table of contents
Start using Lark today
Manage all your work in one place
Boost team efficiency by 10x
Save up to 70% on software costs
Keep reading









2026 Lark Technologies Pte. Ltd.
Headquartered in Singapore with offices worldwide.






Explore: