Modern organizations rely on accurate, real-time visibility to deliver projects successfully across teams and departments. Project dashboards centralize critical data, including timelines, budgets, task progress, and resource allocation, into a single visual interface, enabling faster and more informed decisions.
Unlike manual reports that quickly become outdated, project management dashboards provide continuously updated insights, improving transparency and accountability. As businesses scale and workflows grow more complex, dashboards project management systems are becoming essential tools for maintaining alignment, reducing risk, and ensuring consistent performance across every stage of execution.
What are project dashboards in project management?
in project management are centralized visual interfaces that display real-time information about tasks, budgets, timelines, risks, and resource allocation. They consolidate data from multiple tools into charts, graphs, and summary panels, allowing teams to monitor performance without reviewing separate reports.
These dashboards and are designed to provide both operational and strategic visibility. Project status dashboards help managers track daily execution, while executives use high-level views to assess overall project health and alignment with business goals. By transforming raw data into visual metrics, project dashboards improve clarity, reduce reporting delays, and support faster, data-driven decision-making across the organization.
Key components of project management dashboards
Project dashboards rely on core performance indicators to deliver clear, actionable insights. These components ensure project management dashboards remain focused on execution and outcomes. Well-structured dashboards and project management systems connect daily activity with strategic goals.
- Task-tracking metrics: form the operational foundation of project dashboards. They display task completion rates, overdue items, priority levels, and workflow status in real time. Project status dashboards use these indicators to help managers quickly identify bottlenecks and maintain accountability across teams.
- Budget monitoring indicators provide financial visibility within project management dashboards. They track planned versus actual spending, cost variances, and burn rates to ensure projects remain financially aligned. Dashboards and project management tools help leaders detect overspending early and take corrective action before risks escalate.
- Timeline progress reports visualize milestone completion and schedule adherence. Project dashboards often incorporate Gantt charts or progress bars to highlight deviations from planned timelines. dashboards use these reports to maintain delivery discipline and ensure alignment with target deadlines.
- Resource utilization data shows how team capacity is distributed across tasks and projects. Project management dashboards show workload balance, staffing levels, and potential overload risks. Project management dashboards support smarter allocation decisions, improving productivity while preventing burnout.
Benefits of using project status dashboards
Project status dashboards improve visibility, accuracy, and responsiveness across teams. By centralizing real-time data, they shift organizations from reactive reporting to . Well-designed project dashboards support faster decisions and stronger alignment.
- Improved reporting accuracy: Project dashboards reduce manual data entry and reporting inconsistencies. Project management dashboards sync directly with task and financial systems to maintain reliable data. This automation builds trust and minimizes costly reporting errors.
- Real-time decision making: Project status dashboards provide immediate access to updated metrics. Project management dashboards enable leaders to respond quickly to delays or budget changes. Real-time visibility improves agility and execution speed.
- Better stakeholder visibility: Project management dashboards deliver customized views for different roles. Project dashboards summarize key KPIs while preserving operational detail. Shared visibility strengthens communication and alignment.
- Risk identification across workflows: Project status dashboards highlight bottlenecks and performance deviations early. Dashboards use visual indicators to flag emerging risks. Early detection supports timely corrective action and reduces disruption.
Get real-time visibility into every phase of projects
Common types of dashboard project management
Dashboards and project management systems come in different formats to support varying levels of oversight. Each type of project dashboard serves a specific purpose, from daily tracking to strategic evaluation. Choosing the right structure ensures stakeholders receive relevant and actionable insights.
- Operational dashboards: Operational dashboards focus on day-to-day task execution and workflow progress. Project dashboards at this level display active assignments, deadlines, and metrics. Project management dashboards designed for operations help managers maintain efficiency and resolve immediate bottlenecks.
- Strategic dashboards: Strategic dashboards provide high-level visibility into long-term objectives and . Project status dashboards in this category highlight KPIs, financial outcomes, and goal alignment. Dashboards project management platforms tailor these views for executives and senior leadership.
- Analytical dashboards: Analytical dashboards examine trends, patterns, and historical data for deeper insight. Project management dashboards in this format support forecasting and performance analysis. Dashboards and project management tools help teams identify root causes and optimize future strategies.
- Project performance dashboards: Project performance dashboards combine operational and strategic metrics into a unified view. Project dashboards of this type track scope, schedule, cost, and quality simultaneously. Project management dashboards examples often showcase performance dashboards as the most comprehensive format for overall project oversight.
Project management dashboards examples by use case
Project management dashboards examples differ by industry and workflow needs. Teams rely on customized project dashboards to track the metrics most relevant to their goals. Dashboards project management systems adapt to sector-specific requirements while maintaining real-time visibility.
- : IT teams use project dashboards to monitor sprint progress, bug resolution rates, and deployment timelines. Project status dashboards often integrate with agile tracking systems for seamless updates. Jira dashboards for project management are commonly used to visualize backlog health and sprint performance across technical teams.
- Construction project planning: Construction teams depend on project dashboards to track budgets, contractor assignments, and milestone completion. Project management dashboards examples in construction frequently include cost tracking and schedule variance reports. Project status dashboards help managers identify delays early and maintain coordination across .
- Product development tracking: Product teams leverage project dashboards to monitor feature development, testing cycles, and release readiness. Project management dashboards examples in product environments often include roadmap progress and feedback metrics. Dashboards project management tools ensure cross-functional alignment from ideation to launch.
Turn complex data into clear, actionable project roadmaps
Ready-to-use project dashboard templates
Ready-to-use templates simplify deployment and help teams adopt proven project management dashboard structures immediately. These dashboards and accelerate setup while maintaining flexibility for customization:
Project management template
This template provides a centralized workspace for , milestones, and deliverables across teams. It feeds real-time updates directly into project dashboards, ensuring consistent visibility into progress. Project management dashboards built from this template support deadline tracking and workload balancing. It is ideal for teams seeking structured oversight without complex configuration.
Base project management template
Designed for data-driven teams, this template uses base tables as the engine behind advanced project dashboards. It aggregates task, resource, and budget data into interactive views for deeper insight. Project management dashboards created with this template support multi-dimensional reporting. This structure strengthens dashboard project management systems by centralizing operational data.
Kanban board template
This template focuses on visual workflow tracking using drag-and-drop task management. Updates on the automatically synchronize with connected project dashboards. Project status dashboards benefit from real-time status changes reflected in visual reports. It enhances transparency and improves daily task coordination.
4x4 Risk assessment template
Risk tracking is essential for maintaining accurate project dashboards. This template categorizes risks by impact and likelihood for structured evaluation. Project management dashboards integrate these insights to highlight potential threats early. Dashboards project management systems using this template promote proactive mitigation planning.
Business analysis with a dashboard template
This template combines analytical reporting with operational tracking capabilities. It supports project management dashboards, examples that require and strategic evaluation. Dashboards project management systems built from this template provide performance summaries and trend analysis. It is well-suited for teams focused on continuous improvement and measurable outcomes.
Lark Base project management
This template provides a comprehensive digital headquarters for complex workflows, centralizing task assignments, resource tracking, and in a single source of truth. By utilizing multi-dimensional views like Gantt charts and Kanban boards, teams can seamlessly transition from high-level strategic planning to granular daily execution
Demand collection & management
Designed to bring order to the intake process, this template offers a structured, logical workflow for capturing, evaluating, and prioritizing incoming business or project requests. It leverages forms to standardize information collection from stakeholders, ensuring that every submission includes the data necessary for a thorough evaluation.
Task management: AI autofill task summary
This intelligent template leverages built-in AI to address information overload by automatically synthesizing detailed task updates into concise, readable summaries. It reduces the manual burden of status reporting, allowing projects to grasp the essence of multiple workstreams at a glance without digging through endless comment threads
Task management
This template provides a fundamental framework for project and , focusing on the logical progression of work from initial ideation to final completion. It features a highly customizable architecture that allows users to define specific priorities, set deadlines, and visualize workloads through intuitive calendar and status views.
Collaboration workflows across dashboards with Lark
Project dashboards are most effective when integrated directly into daily collaboration workflows. Instead of operating as standalone reporting tools, can connect communication, task execution, and real-time tracking in one workspace. Dashboards project management systems embedded within collaboration platforms like help teams reduce context switching and make faster, data-driven decisions.
Real-time dashboards with smart blocks
Lark Base dashboards serve as the data engine for the project. It allows you to aggregate data from multiple tables and visualize it using over 20 different chart types, including funnel charts, heatmaps, and combo charts. Unlike traditional spreadsheets, these dashboards update in real time as team members modify individual records in the underlying Base, ensuring that stakeholders always see the most up-to-date project health. 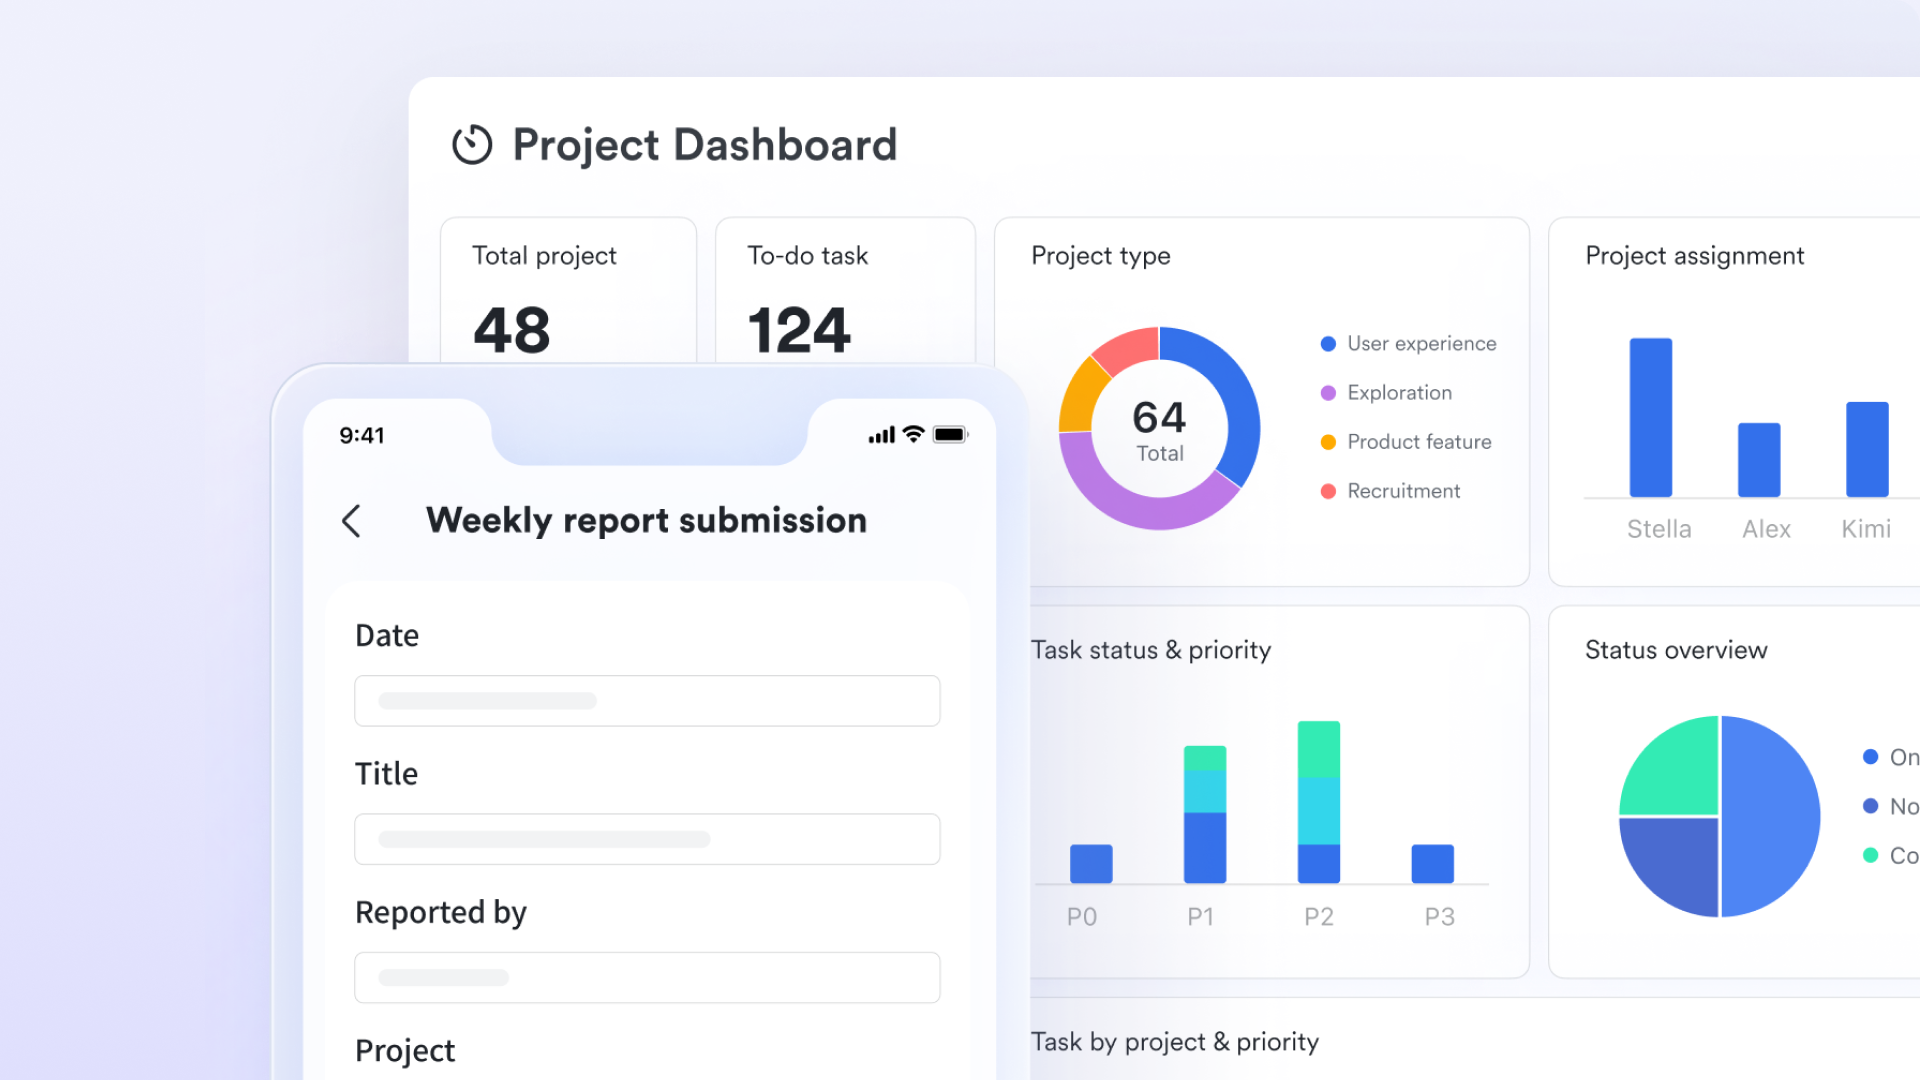
Cross-view synchronization
A core strength of Lark is maintaining a "single source of truth" across different visual formats. A technical team can manage daily tasks in a Kanban view, while the dashboard simultaneously pulls that same data into a Gantt view for leadership to track timeline dependencies. This feature eliminates the need for manual data duplication between different project management styles. 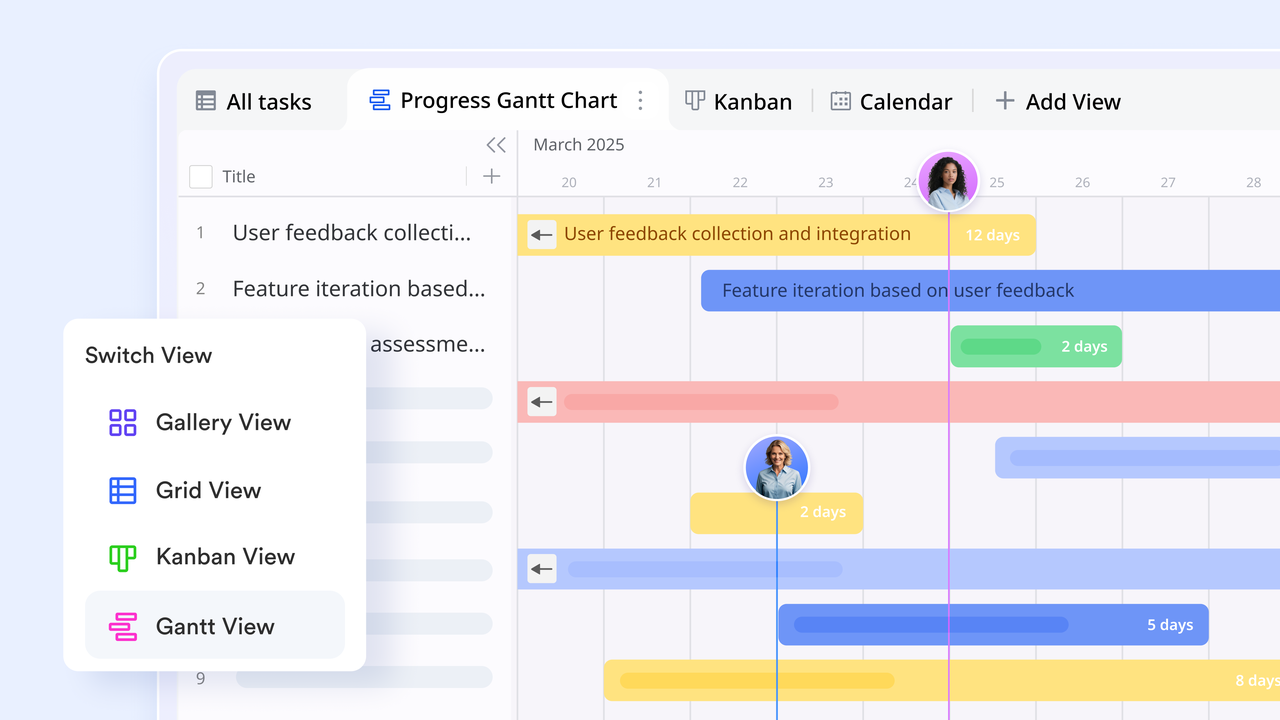
Automated dashboard "Push" notifications
Using the Lark Base workflow engine, you can set up automations that "push" dashboard insights directly to where the team is working. For example, you can configure a trigger to send a weekly sales report or project summary report to a specific Lark Messenger group. This ensures the dashboard stays top-of-mind and that team members don't have to hunt for the data. 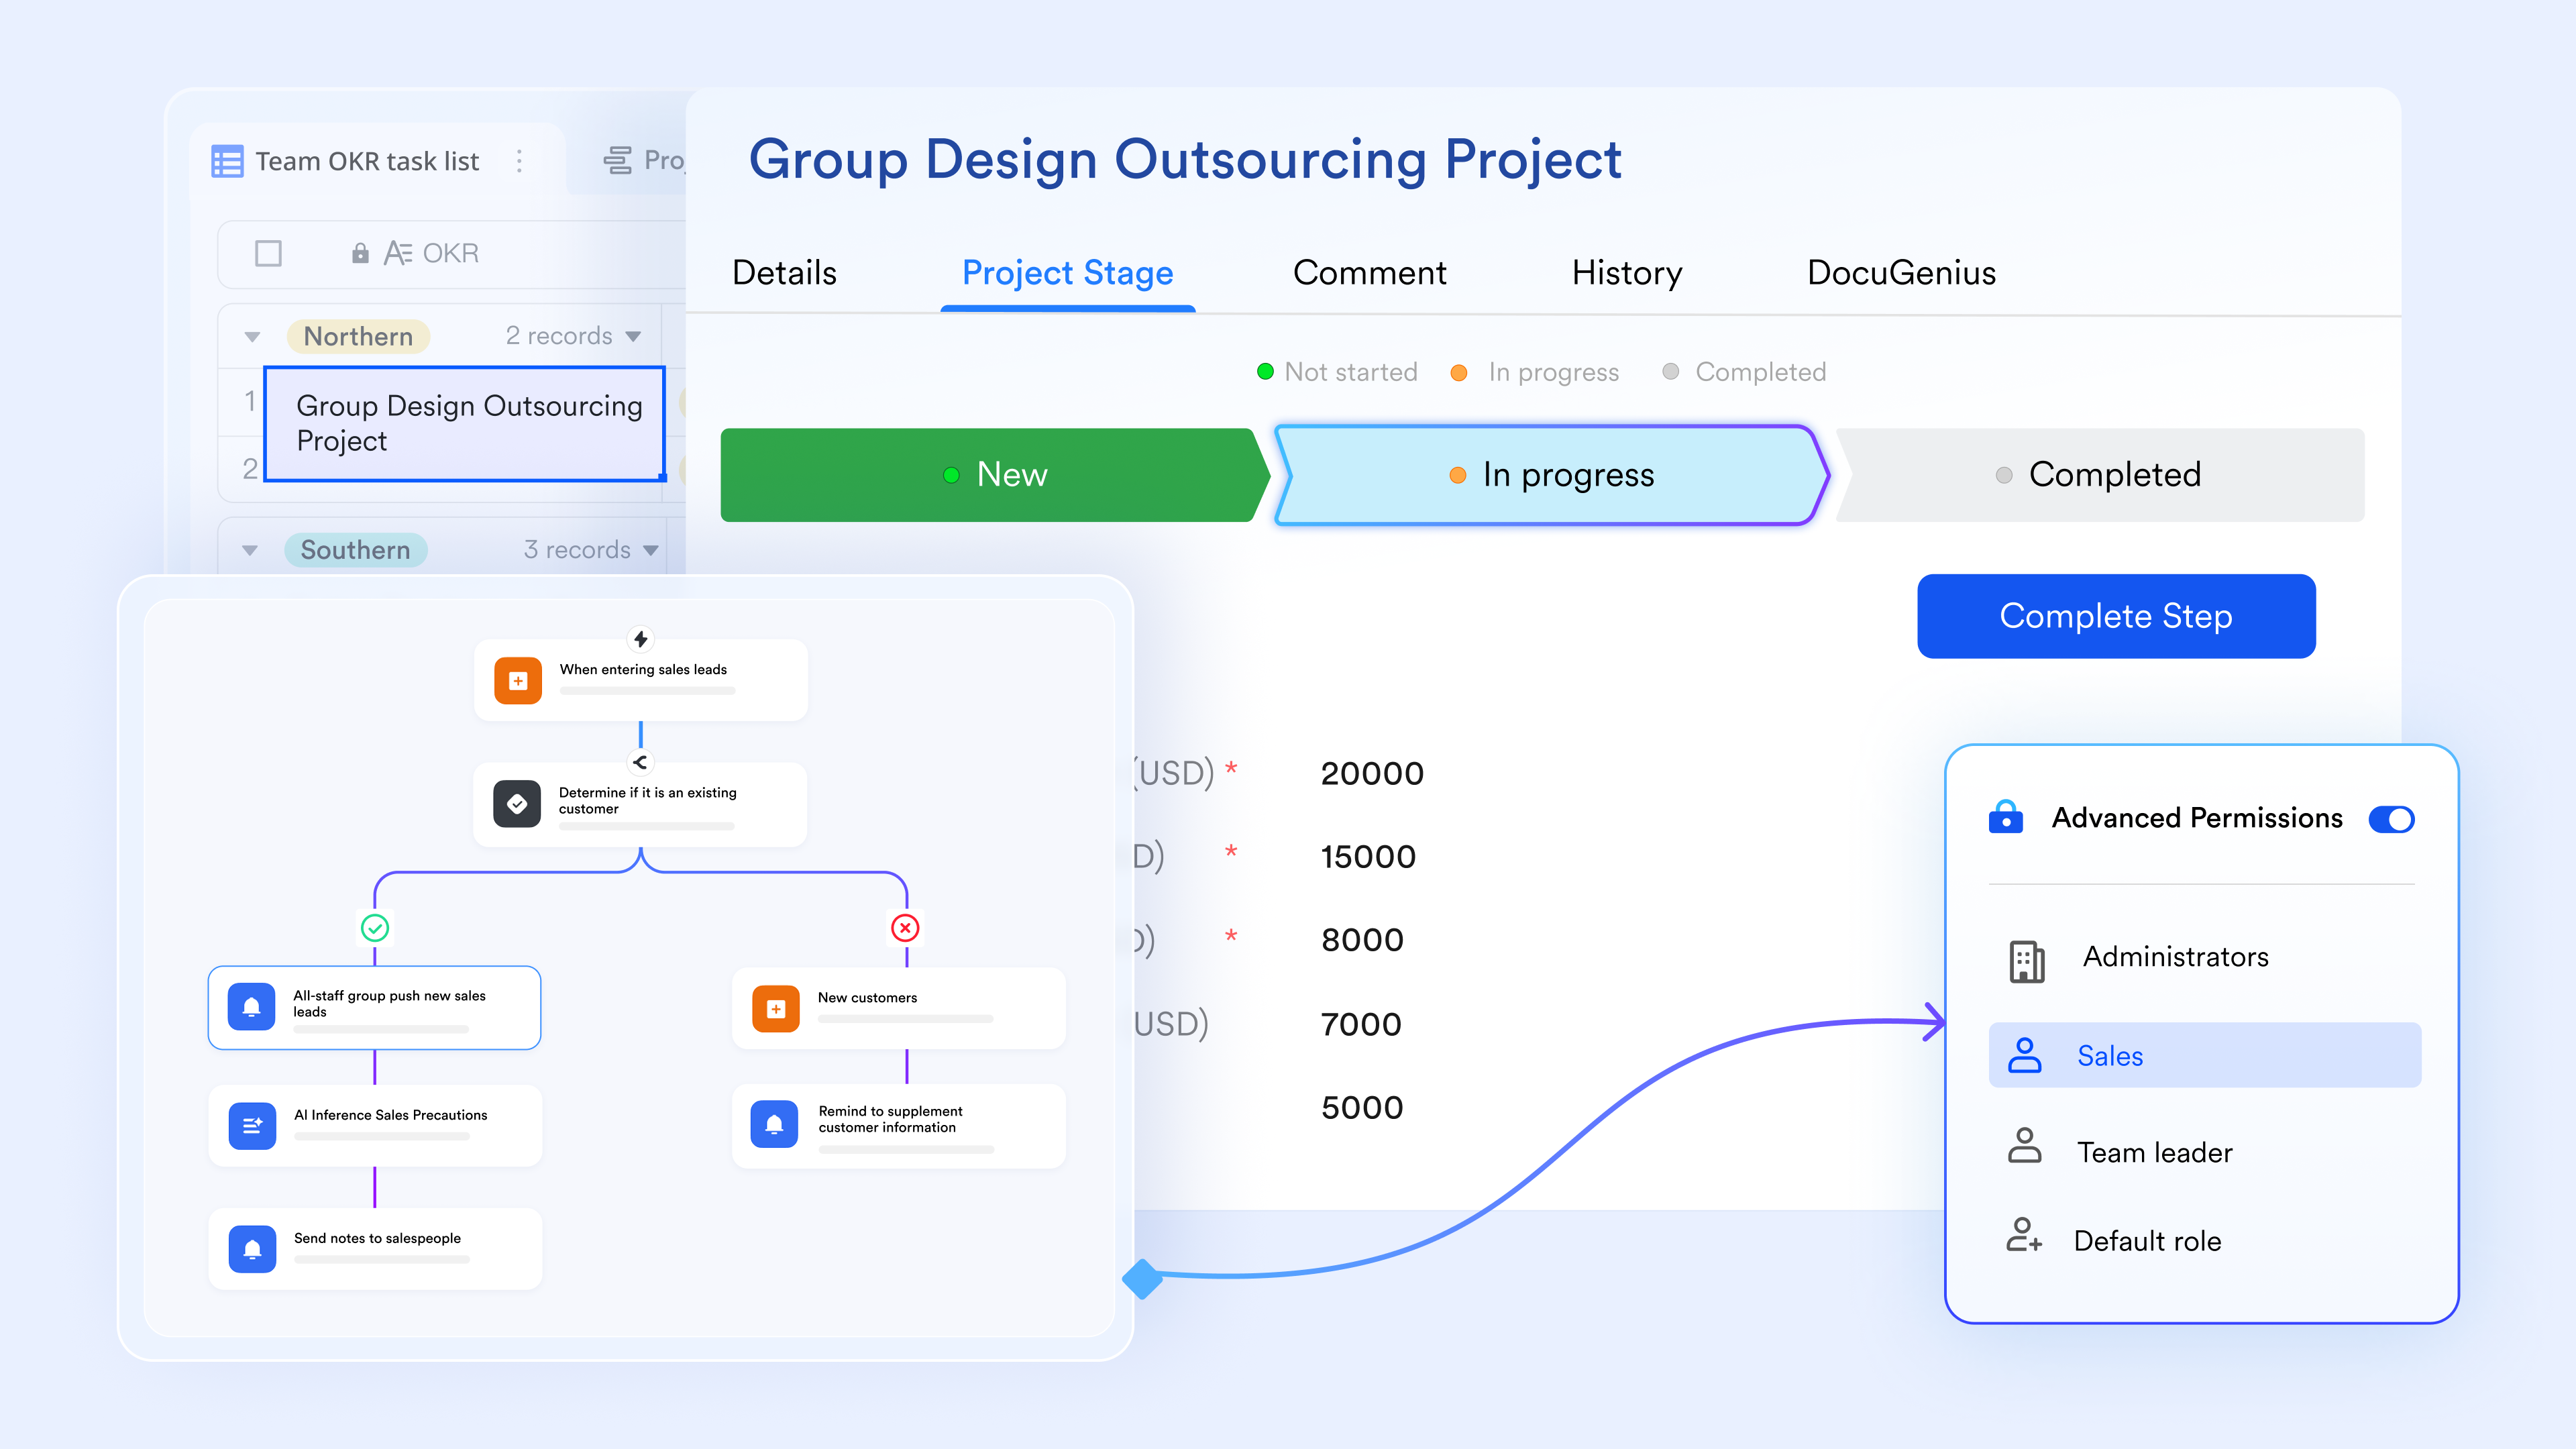
Granular advanced permissions
To maintain data security across cross-functional teams, Lark offers advanced permissions within Base. This function allows project managers to control visibility down to the formula field or record level. You can configure a dashboard so that external contractors only see their specific project metrics, while internal executives can view the entire portfolio's financial and resource data. 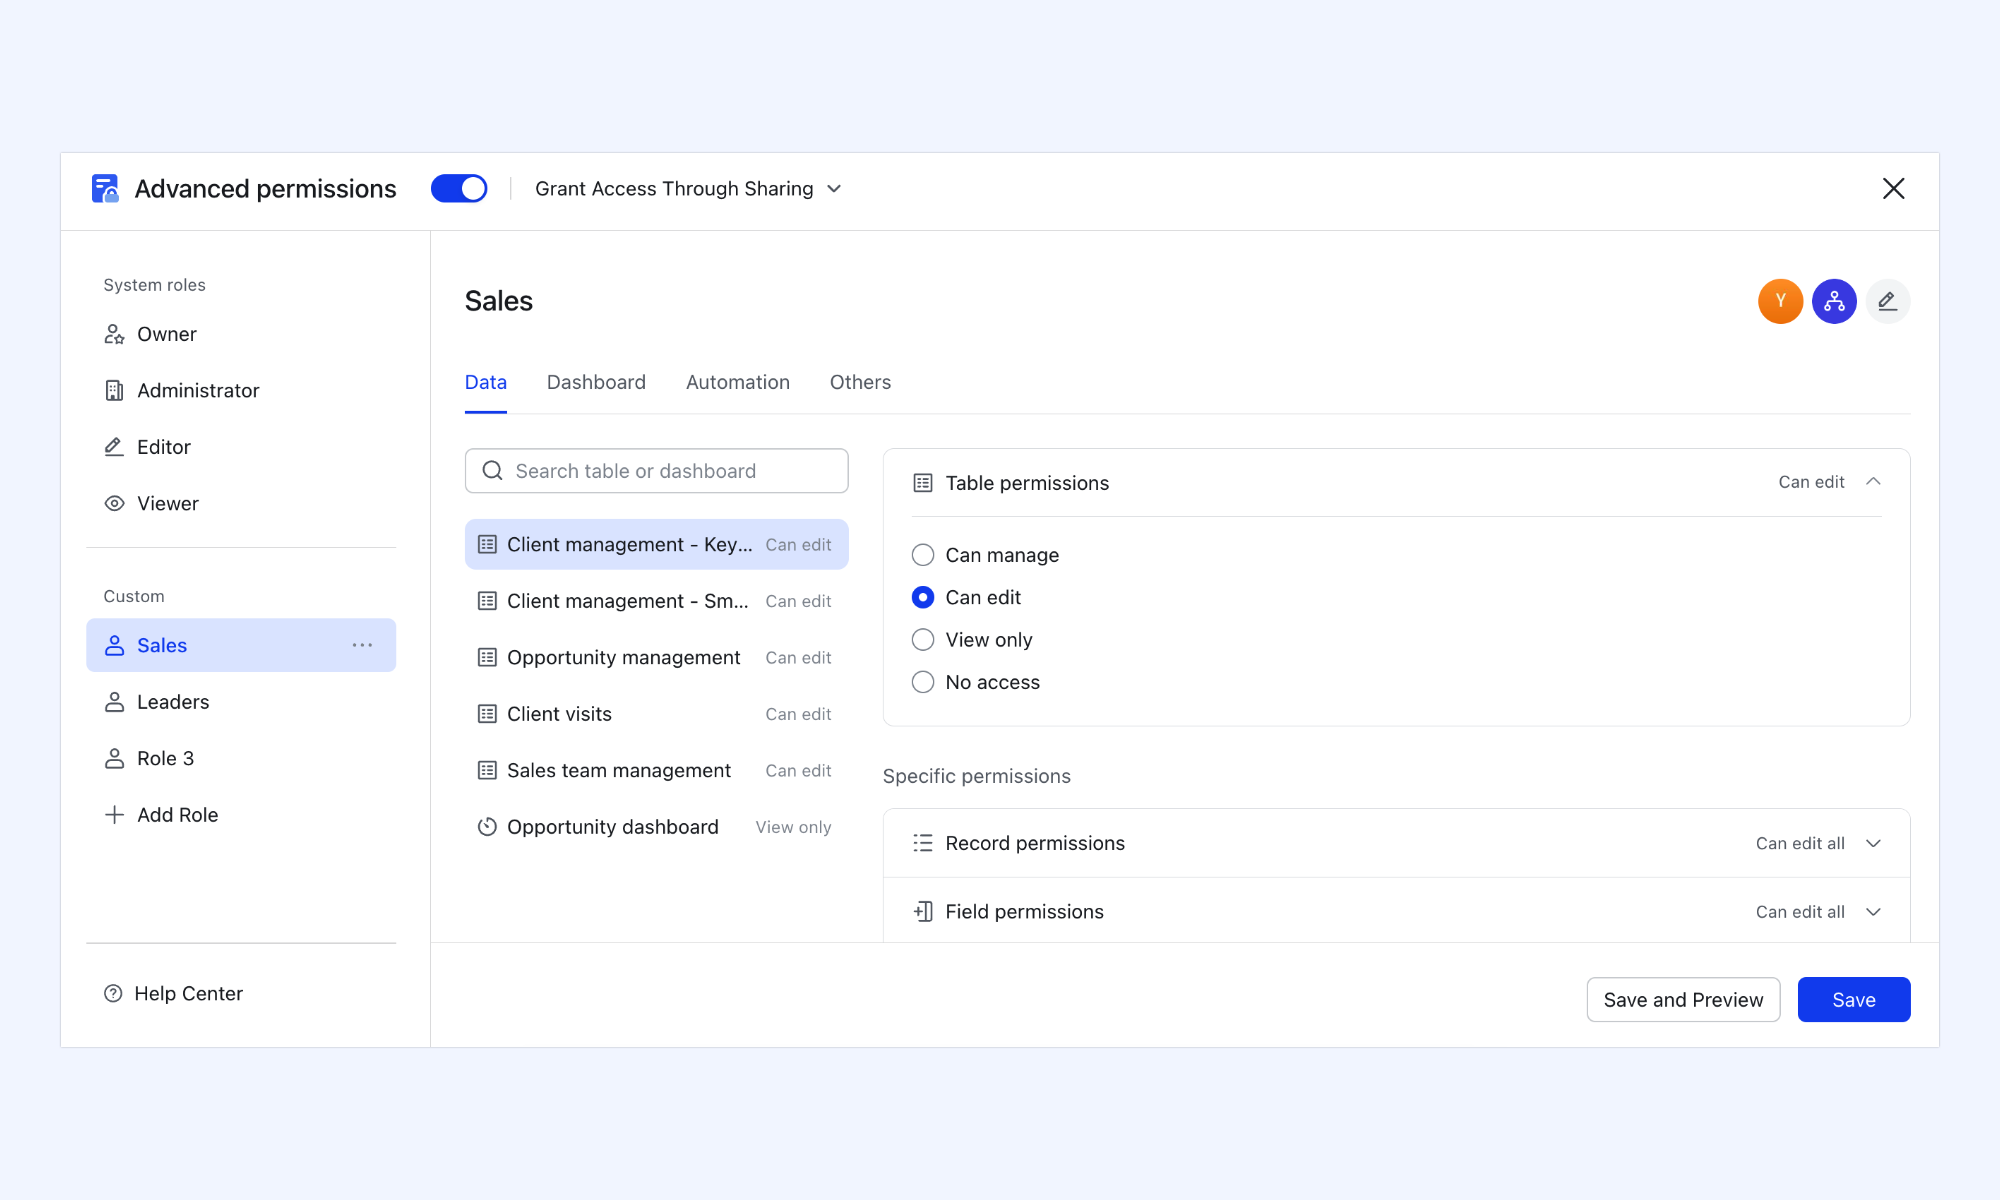
:
- Starter plan: Free forever plan that includes 11 powerful tools for up to 20 users. It also comes with 100GB of storage, 1000 automation runs, AI translations, and more.
- Pro plan: $12/user/month (billed annually) for up to 500 users. It includes everything in Starter plus group calling for up to 500 attendees, 15TB of storage, 50,000 automation runs, and more.
- Enterprise plan: for custom pricing. Supports unlimited users and includes even more automation runs and advanced security, compliance, and management features.
For small teams with simple communication needs

18 months message history
1000 Base automation runs/month
2000 rows per table in Base
Most POPULAR
For companies with comprehensive collaboration and management needs
Unlimited message history
500-participant video meetings
50k Base automation runs/month
20k rows per table in Base
For large companies with advanced security and organizational management needs
Get a personalized demo and pricing
Unlimited message history
500-participant video meetings
15 TB storage + 30 GB storage/user
500k Base automation runs/month
50k Base automation runs/month
Most POPULAR
For companies with comprehensive collaboration and management needs
Unlimited message history
500-participant video meetings
50k Base automation runs/month
20k rows per table in Base
Best practices for project dashboard design
Well-designed project dashboards are not just collections of charts, but strategic tools that guide decision-making and performance tracking. The effectiveness of project management dashboards depends heavily on thoughtful structure, clear metrics, and user-focused design. By applying proven design principles, dashboard project management systems can deliver accurate insights, improve usability, and support long-term operational success.
- Define clear objectives before selecting metrics: Every effective project dashboard framework starts with a clear purpose. Identify whether the dashboard supports operational tracking, executive oversight, or analytical review. Project management dashboards should focus only on metrics that directly influence decisions. Clear objectives prevent clutter and ensure relevance.
- Prioritize clarity over visual complexity: Dashboard project management systems should simplify data, not overwhelm users. Use clean layouts, consistent , and limited color variations to enhance readability. Project status dashboards must allow stakeholders to interpret information within seconds. Simplicity improves usability and adoption.
- Customize views for different stakeholders: Different roles require different insights from project dashboards. Executives may need strategic , while managers focus on daily execution metrics. Project management dashboards examples show that role-based customization improves alignment. Tailored views enhance focus and decision efficiency.
- Ensure real-time data integration: Manual updates reduce the effectiveness of project dashboards. Project management dashboards should integrate directly with task, financial, and resource systems for automatic updates. Dashboards are project management platforms that sync in real time, maintain accuracy, and trust. Automation eliminates reporting delays.
- Continuously review and optimize dashboard performance: Project dashboards should evolve as project scope and priorities change. Regularly assess whether metrics remain aligned with business objectives. Project management dashboards examples demonstrate that iterative refinement improves long-term value. Ongoing optimization ensures dashboards and project management systems remain actionable and impactful.
Conclusion
Project dashboards have evolved from static reporting tools into dynamic decision platforms. By consolidating timelines, budgets, resources, and risks into a unified interface, they empower teams to maintain visibility and control across complex initiatives. Organizations that adopt project management dashboards benefit from improved transparency, faster response times, and stronger strategic alignment.
As collaboration environments continue to modernize, integrated dashboards and project management systems are becoming the standard. Platforms like demonstrate how embedding dashboards directly into communication and workflow tools enhances both execution and leadership oversight. By combining automation, visualization, and secure collaboration, teams gain a powerful framework for sustained .
Deliver every project on time with integrated dashboards
FAQs
What metrics should be included in project dashboards?
Project dashboards should track task completion, milestones, budgets, resource utilization, and risk indicators. Project management dashboards may also include ROI or strategic KPIs, depending on scope. The goal is to keep metrics clear and decision-focused. like Lark helps centralize these insights into one workspace.
How do project status dashboards improve team reporting?
Project status dashboards automate data collection and reduce manual reporting errors. They provide real-time visibility, ensuring rely on consistent information. Dashboards project management systems create a single source of truth for teams. This process becomes more efficient with collaborative tools like Lark.
Can Jira dashboards support large project teams?
Jira dashboards for project management are widely used for agile tracking and sprint management. They allow large teams to customize views by role and responsibility. These dashboards support scalable reporting across projects. When combined with like Lark, communication improves further.
What industries use project management dashboards most?
IT, construction, healthcare, finance, and product development commonly use project management dashboards with examples tailored to their workflows. Project dashboards help manage timelines, budgets, and risks effectively. Dashboards project management systems support both operational and strategic oversight. Adoption continues to grow with platforms like Lark.
How often should dashboards be updated?
Project dashboards should update automatically in real time through system integrations. Manual updates can reduce accuracy and reliability. Project management dashboards with automated syncing maintain consistent visibility. Real-time updates work best within connected environments like Lark.
Related reading





























