As project managers, we often seek tools to visualize our plans and keep teams on track. For many, a Smartsheet Gantt Chart Template is a familiar starting point, offering a structured way to outline project phases. However, in today's rapidly evolving work landscape, relying solely on static templates can hinder agility and collaboration. This article will explore the enduring value of Gantt charts, acknowledge the strengths of tools like Smartsheet, and then dive into the inherent limitations of static template-based approaches. We'll then introduce how a unified, dynamic platform like Lark offers a more integrated and collaborative alternative for managing project timelines to empower modern teams.
The foundational role of Gantt Charts in project management
Before exploring the dynamic alternatives available today, it is crucial to understand the roots of project visualization. For decades, project managers have relied on specific methodologies to bring order to project chaos, and one tool has consistently stood the test of time as the cornerstone of planning. To fully appreciate why modern solutions are evolving, we must first look at the core mechanics of this traditional approach.
What is a Gantt Chart and why is it indispensable?
A Gantt chart is a that maps tasks, timelines, dependencies, and milestones for effective planning and tracking. Imagine a horizontal bar chart where each bar represents a task, its length indicating duration, and its position on a timeline showing its start and end dates. This simple yet powerful visualization allows project managers to transform complex plans into clear, actionable visuals. My experience tells me that it's indispensable because it provides an immediate, top-line perspective of a project, helping both workers and managers and . They are crucial for simplifying complex projects and allowing teams to understand task sequences and timelines at a glance.
The persistent need for visual project planning
The human brain processes visual information far more efficiently than text. This is why visual project planning remains essential. , cater to this fundamental need by offering a clear graphical overview that aids in understanding project scope, progress, and resource allocation. This visual clarity fosters a common understanding among teams, ensuring everyone is literally on the same page. When a complex project with numerous moving parts is distilled into a single, comprehensible timeline, it drastically improves communication and helps to prevent misunderstandings, making the visual aspect truly crucial for successful project execution.
Smartsheet Gantt Chart Templates: A closer look at their strengths
A powerful tool for Gantt Chart visualization
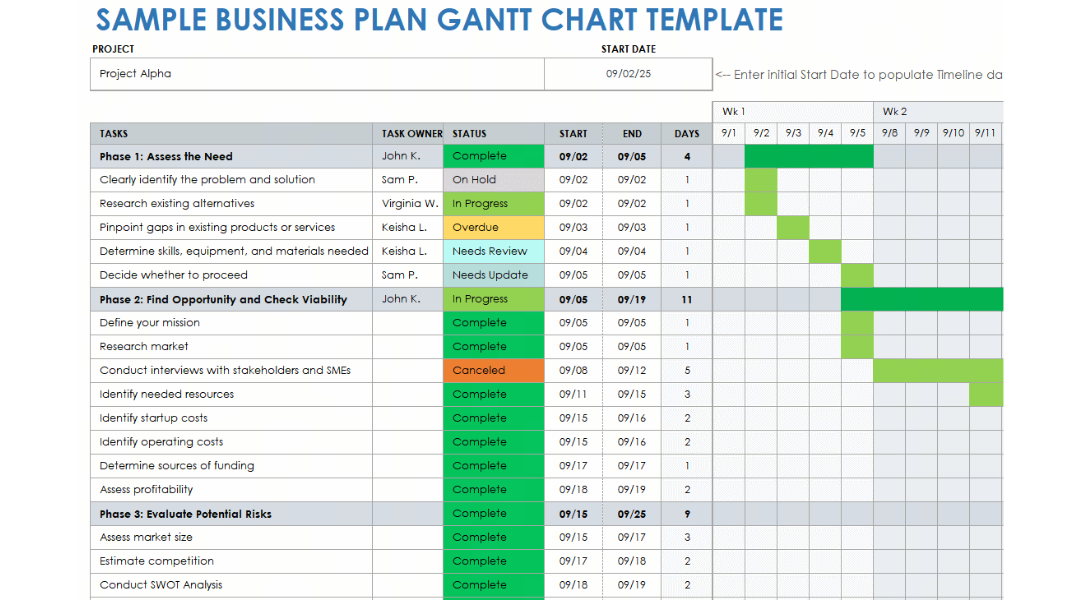
Image source: smartsheet.com
has established itself as a robust platform for project management, and its Gantt chart capabilities are a testament to that. When you're looking for a Smartsheet Gantt Chart Template, you're often seeking a solution that helps visualize project timelines, manage tasks, and streamline collaboration. From my perspective, are a powerful tool because they are designed to save hours on planning and reporting with automated timelines, real-time updates (within the Smartsheet environment), and simple drag-and-drop editing. This functionality allows project managers to efficiently track tasks and organize complex project plans with clear visual charts. Smartsheet further enhances this by offering various views, including grid, card, Gantt, or calendar, providing flexibility in how you interact with your data. For instance, a can quickly outline key deliverables for a new product campaign, assign tasks, and set deadlines. The drag-and-drop functionality then allows for easy adjustments to the timeline when, say, a content review takes longer than expected, making the initial setup and basic adjustments quite intuitive.
Diverse templates for various project needs
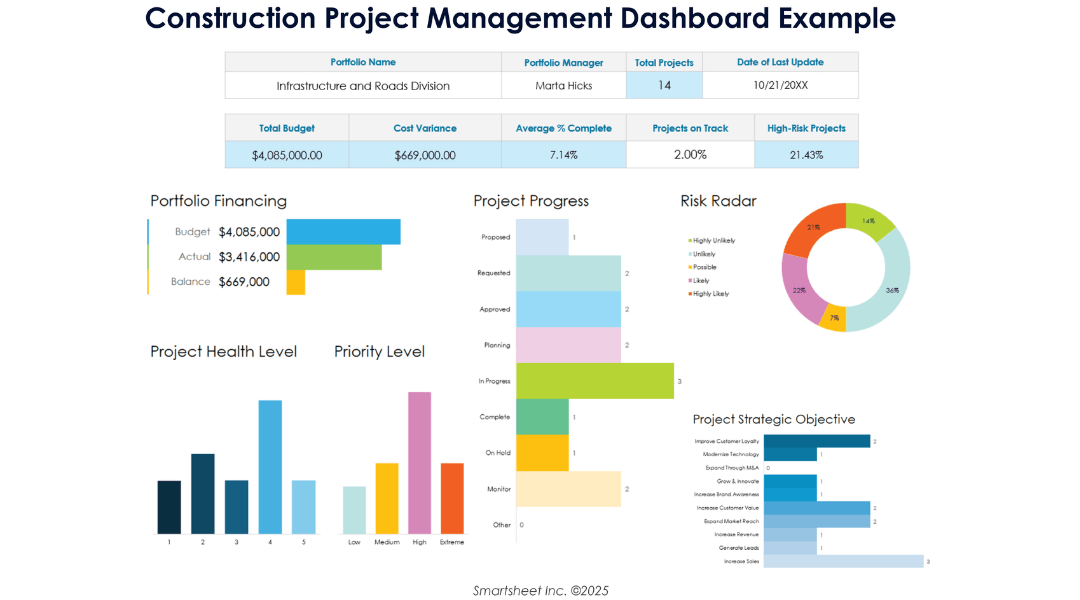
Image source: smartsheet.com
One of Smartsheet's strengths lies in the sheer variety of Gantt Chart Template options it provides. Whether you're a seasoned project manager or just starting, you can find a Smartsheet gantt template tailored to different use cases. Teams in specific industries, for example, might be searching for a construction Gantt Chart Template or an excel Gantt Chart Templateadapted for their specific workflows. Smartsheet often provides these, covering areas like task timelines, schedules, budgets, resources, and risk tracking. This wide array of predefined frameworks acts as a powerful starting point, saving valuable time and ensuring that even complex projects can begin with a well-structured plan. An engineering team embarking on a new software development sprint could utilize a Smartsheet gantt template designed for , finding a useful framework to start plotting their complex phases, user stories, and critical milestones. This pre-built structure helps them quickly allocate resources and manage dependencies without starting from scratch.
The hidden downsides of relying on smartsheet Gantt Chart Templates for comprehensive project management
The fragmentation challenge: When your timeline is separate from your team
While the visual appeal and structure of a Smartsheet Gantt Chart Template are undeniable, a critical limitation arises when this powerful visualization operates in isolation. In my experience, a Gantt chart, no matter how well-designed, can become a silo if the essential workflows of , detailed , and happen in other tools. This fragmentation leads to . Imagine your team members needing to leave the Gantt chart to discuss a task in a chat application, then move to a document for specifications, and finally to an email for approval. Each switch breaks focus, reduces efficiency, and introduces the risk of information getting lost or miscommunicated. The pain of constantly jumping between applications to get a complete picture of project status ultimately hinders true collaboration and can significantly delay decision-making.
Real-time collaboration beyond the chart: Keeping everyone in sync
Modern projects demand . While a Smartsheet Gantt Chart can update dynamically within its own environment, the flow of collaboration often extends beyond the chart itself. Discussions about unforeseen roadblocks, immediate decisions on task reassignment, or the nuanced details of a project deliverable frequently occur in conversations that are separate from the Gantt view. This means that even if the chart is technically "real-time" in its updates, the context and decisions surrounding those updates might not be immediately available to everyone viewing the chart. Information lags and a loss of holistic context can occur, especially when team members aren't continuously engaging with the same platform where the Gantt lives. For a truly synced team, all project-related activities – from brainstorming to final approvals – need to be seamlessly connected for genuine real-time synchronization, which a standalone Gantt Chart Template often struggles to provide.
Adapting to change: Flexibility vs. template structure
Project plans are rarely static; they evolve. While Smartsheet Gantt Chart solutions offer flexibility for drag-and-drop adjustments, the primary focus on a template structure—even a dynamic one—can still pose challenges for truly rapid adaptation if the larger project ecosystem isn't equally dynamic. Here is why relying on a standalone template structure can become a bottleneck:
- The challenge of sudden pivots: The inherent structure of any Gantt Chart Template provides a solid initial framework. However, when unexpected changes arise—such as a sudden client pivot, an unforeseen resource constraint, or a critical dependency shift—the ability to quickly re-plan and get buy-in across all relevant project elements (documents, communications, approvals) becomes paramount.
- Flexibility beyond the timeline: The need for adaptability extends beyond just tweaking the bars on a chart. True agility requires an environment where changes propagate intuitively through communication channels and related documents. This minimizes administrative overhead and ensures everyone stays aligned with the revised plan without manual cross-referencing.
- The cost of fragmented updates: Consider a software development project midway through its cycle when a crucial third-party API announces a breaking change, requiring a significant re-architecture. While the project manager can easily adjust the Smartsheet Gantt Chart to reflect new timelines, the real challenge lies elsewhere. Updating the requirements documents, communicating the scope change to stakeholders, getting new design approvals, and re-allocating developer resources are all managed in different systems. This fragmented process often introduces delays and confusion, despite the chart itself being updated.
Moving beyond static templates: Lark's unified approach to dynamic project management
Having explored the inherent limitations of static templates, even a sophisticated smartsheet gantt template, we now turn our attention to how redefines dynamic through its unified platform. My perspective is that the modern project environment demands a comprehensive, integrated workspace that intrinsically addresses the pain points of fragmented tools and fosters true agility.
The unified workspace: Beyond fragmented tools
Lark embodies a truly , where project management is not just about a standalone chart but an integral part of a larger, connected environment. Unlike the disconnected experience of juggling a Gantt Chart template excel with separate chat apps, document editors, and approval systems, integrates , , , , and into a singular ecosystem. This comprehensive approach eliminates the need for constant context switching, creating a cohesive environment where all aspects of project work reside and interact, thereby fostering seamless collaboration across all facets of your team's work.
Native Gantt Charts for flexible and agile planning
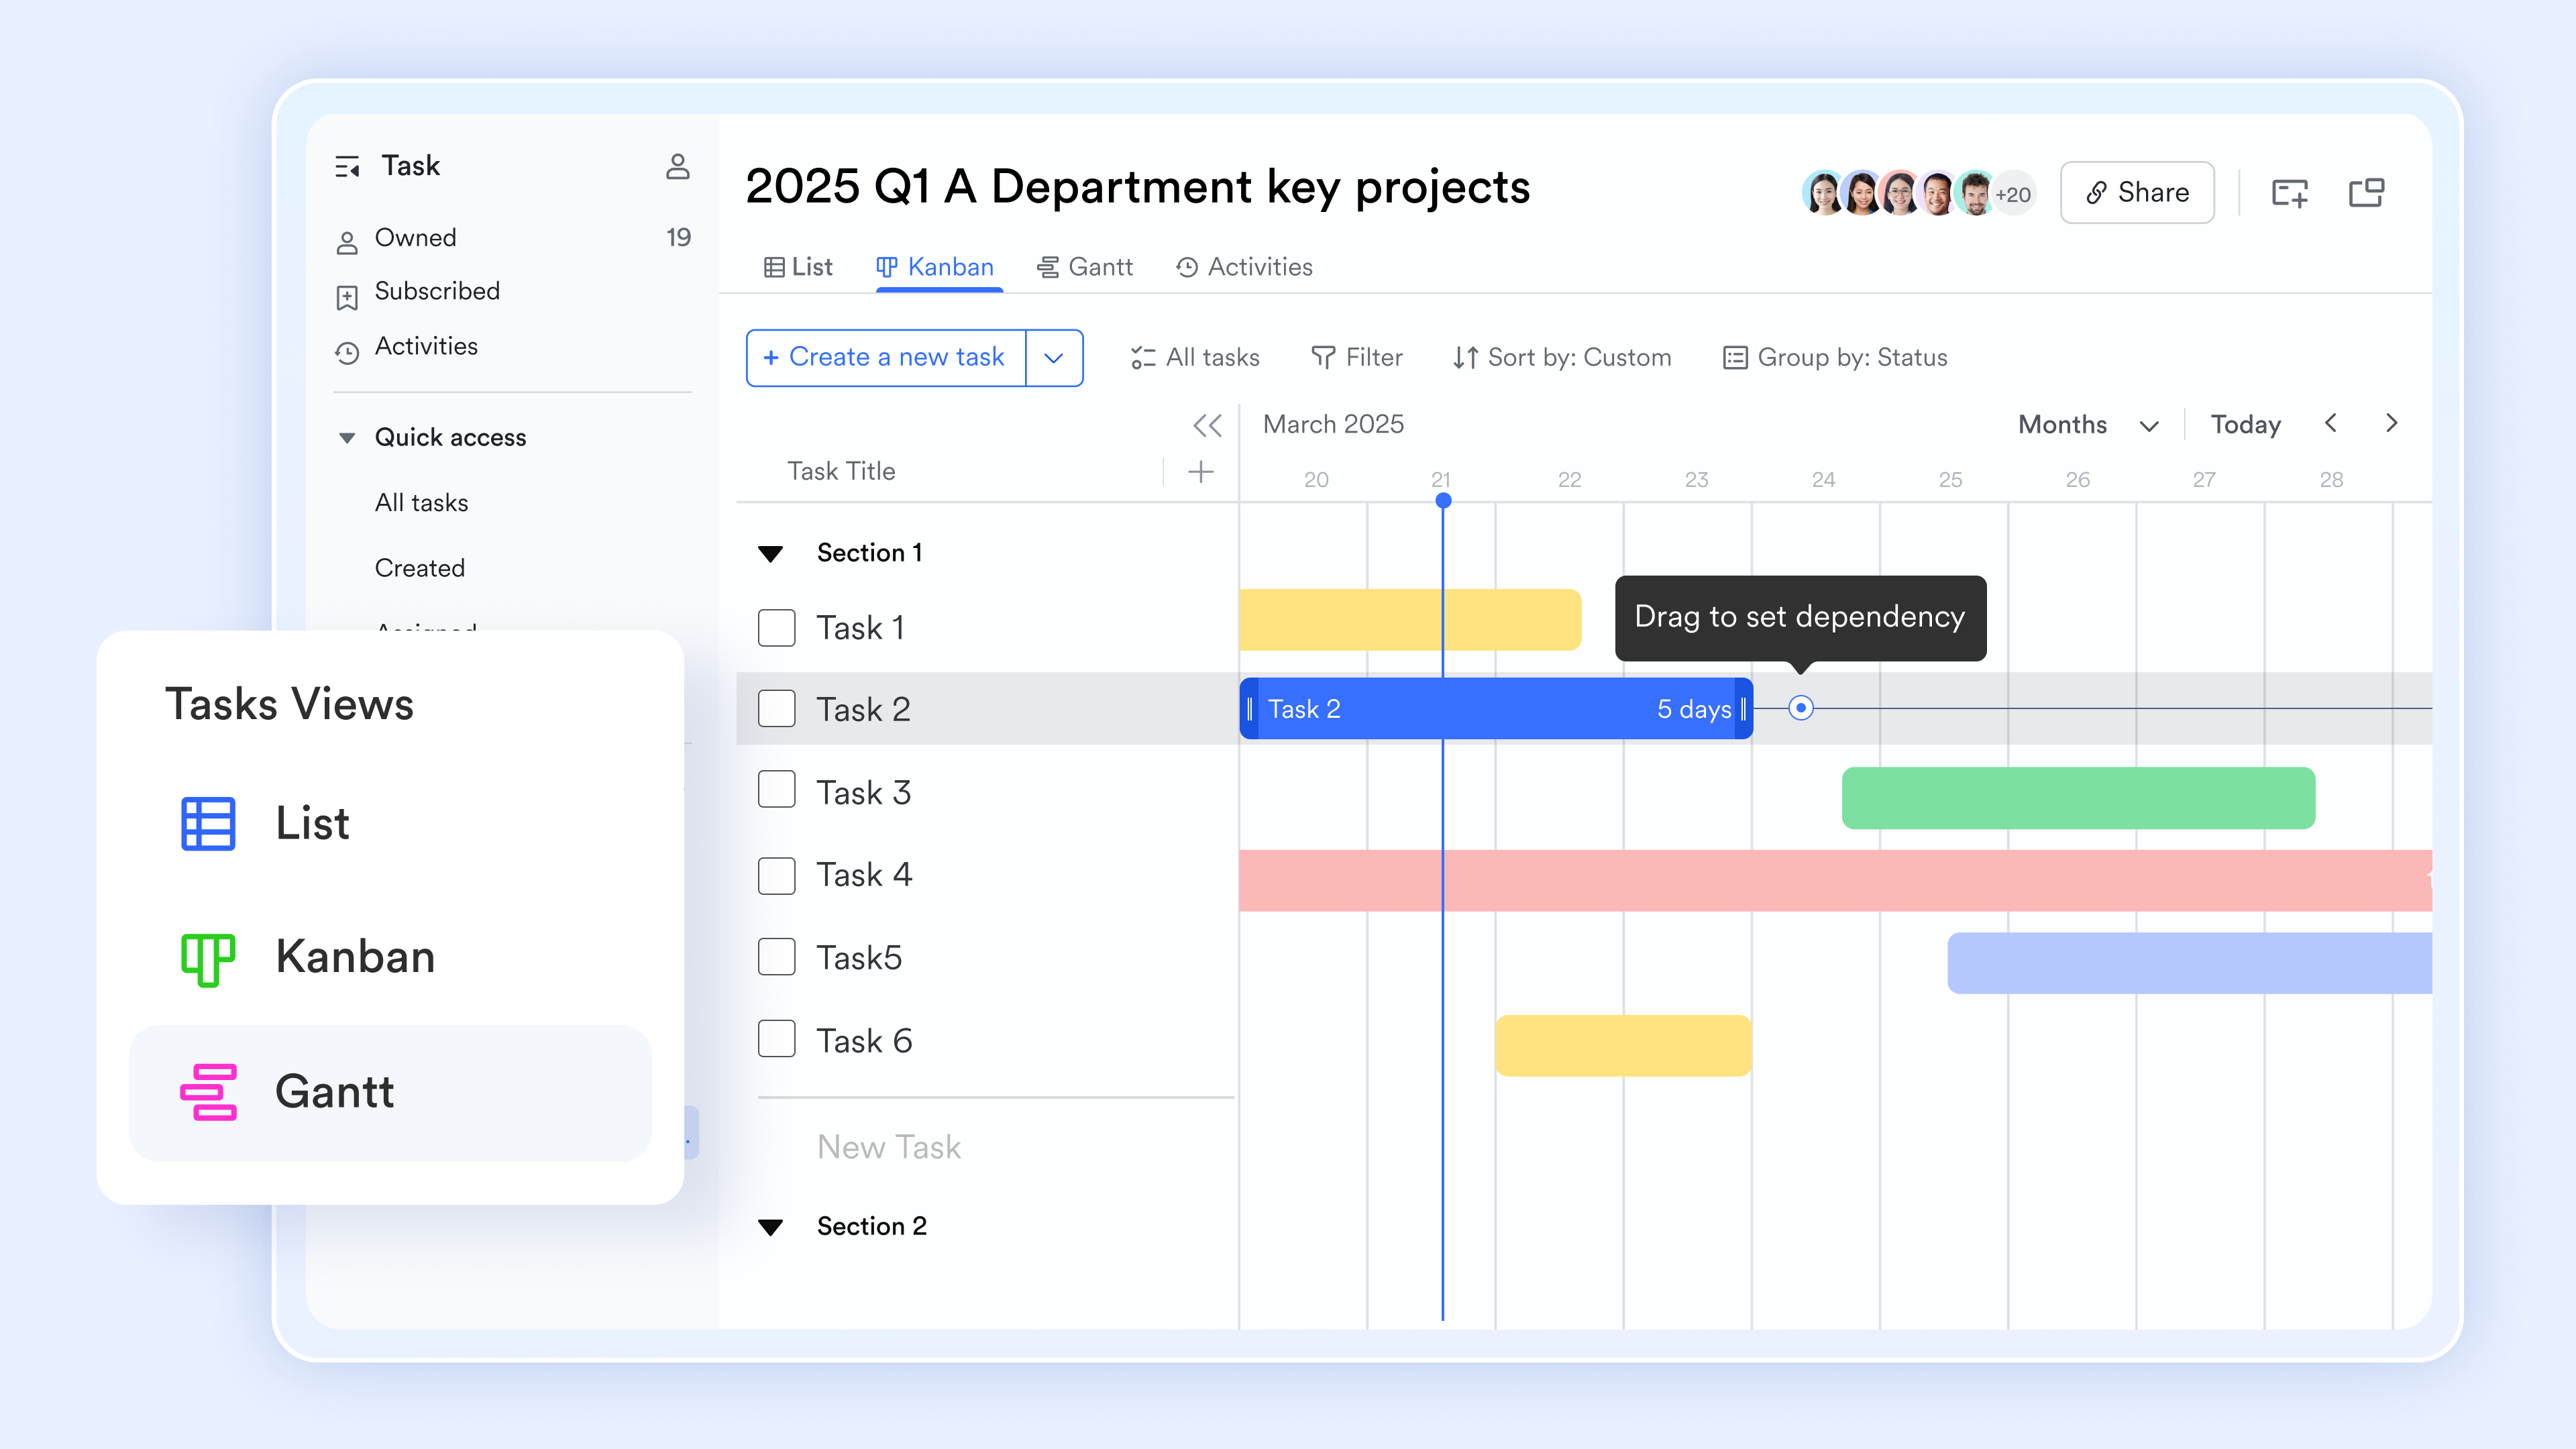
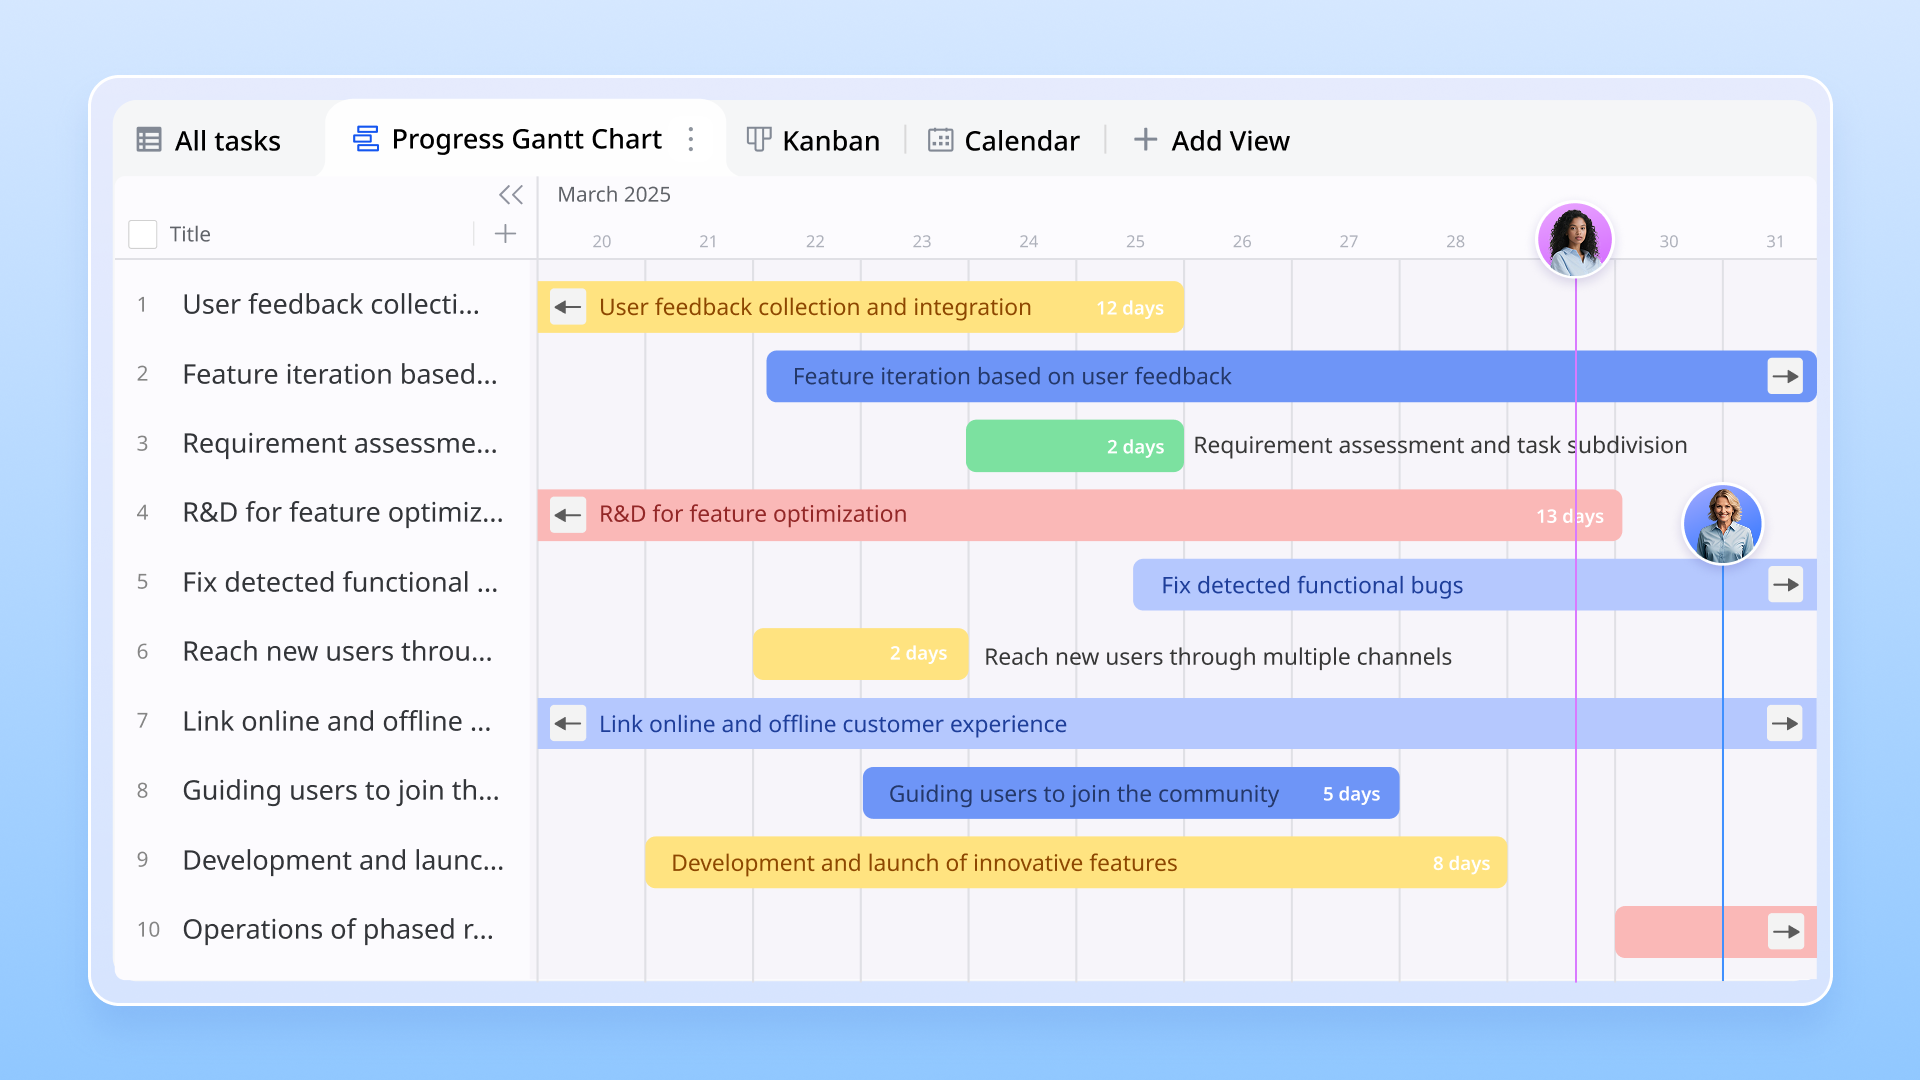
provides the power and flexibility to create fully functional, customizable directly within its , moving beyond merely "Gantt-like" views. serves as a highly collaborative and customizable database-like tool. You can structure columns for essential project data—Task Name, Start Date, End Date, Duration, Assigned To, Status, and Dependencies—and then leverage Lark's native Gantt views to visualize progress. This means you can toggle between a standard spreadsheet Grid and a dynamic Gantt chart in one click, and even drag and drop time bars directly on the Gantt chart to instantly update underlying data. This adaptability goes beyond what a fixed smartsheet gantt chart template can offer, allowing for real-time adaptation to changes. When deadlines shift or tasks are re-prioritized, the Gantt chart in instantly reflects these updates across and , ensuring everyone is aligned with the new plan and supporting greater project agility.
Real-Time collaboration & automated efficiency
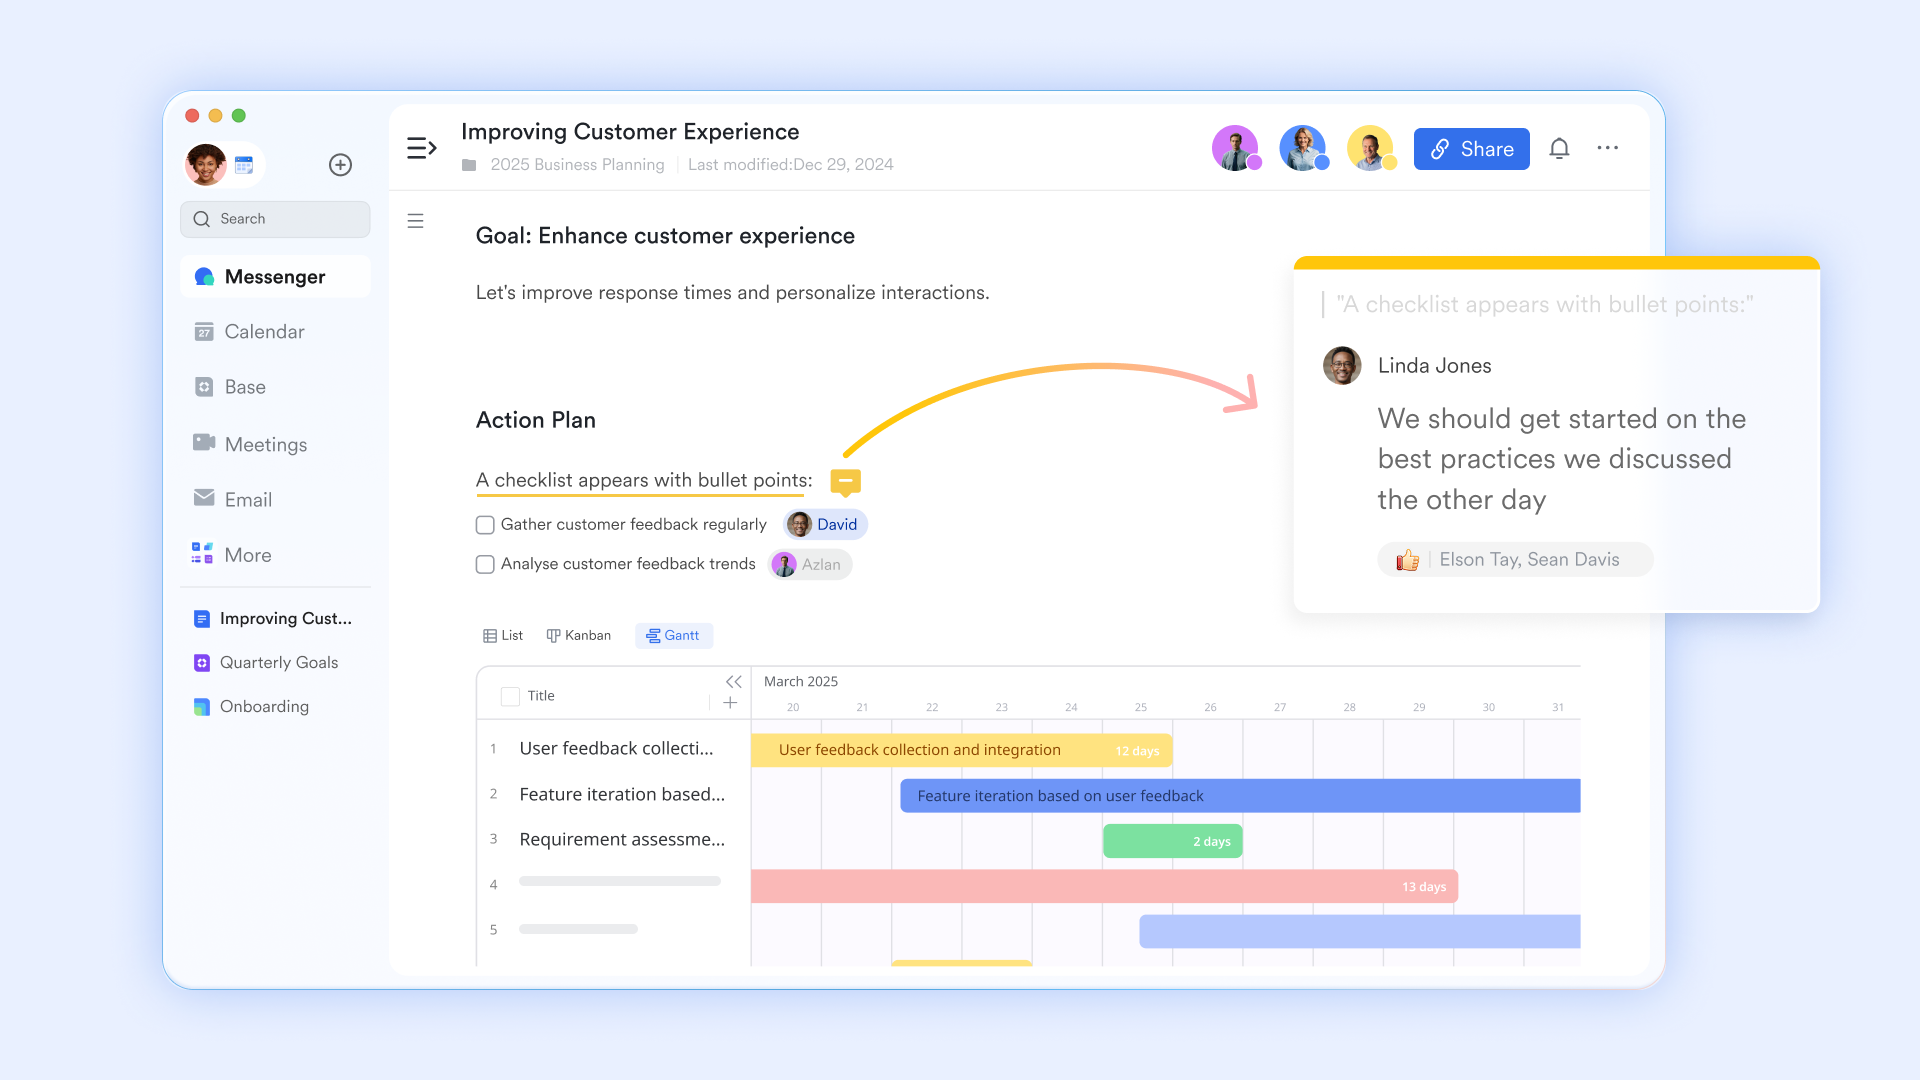
One of Lark's significant advantages is embedding real-time collaboration and communication directly into your project timeline. Unlike a standalone smartsheet Gantt Chart where discussions might occur in separate channels, Lark centralizes interaction. Integrated messaging, video meetings, and inline comments are directly linked to tasks and projects within and its Gantt Charts. This ensures all communication and decisions happen in context, dramatically reducing miscommunication. Beyond collaboration, Lark elevates project management through . You can notify team leads when a critical task changes status, send reminders as deadlines approach, or trigger approval workflows upon phase completion. These capabilities, deeply integrated with your Gantt charts, ensure proactive management and timely execution, going well beyond basic alerts of template-based solutions.
Explore Lark's dynamic Gantt Chart Template features.
Practical applications: Designing your dynamic project timeline in Lark
Step-by-step: Crafting a Gantt Chart timeline
Building a dynamic Gantt chart timeline in is a straightforward process that offers immense flexibility, far exceeding the constraints of a traditional Gantt Chart Template excel or a fixed construction Gantt Chart Template. Here's a conceptual guide to get you started:
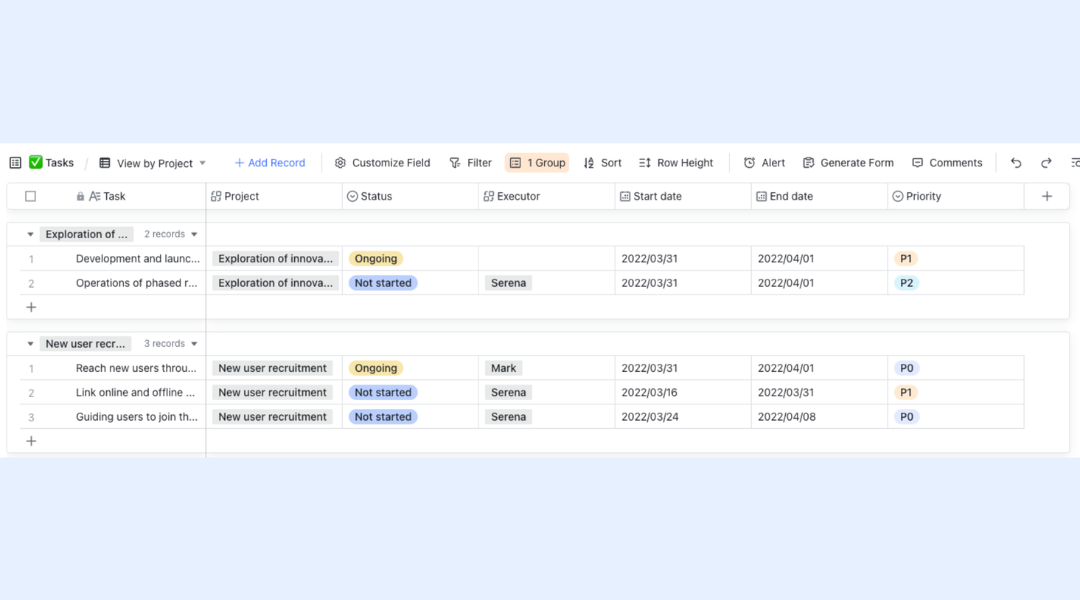
1. Define your data structure: Begin by creating a new Sheet in Lark. Set up columns that are essential for any project timeline: "Task Name," "Start Date," "End Date," "Duration" (calculated automatically), "Assigned To," and "Status" (e.g., Not Started, In Progress, Completed, Blocked). For dependencies, you can add a "Predecessor" column where you reference the row number or task ID of a preceding task. This simple yet robust structure forms the backbone of your dynamic timeline.
2. Visualize progress with Lark's native Gantt view: To transform your data into a visual Gantt Chart representation, leverage ' native Gantt view. You can:
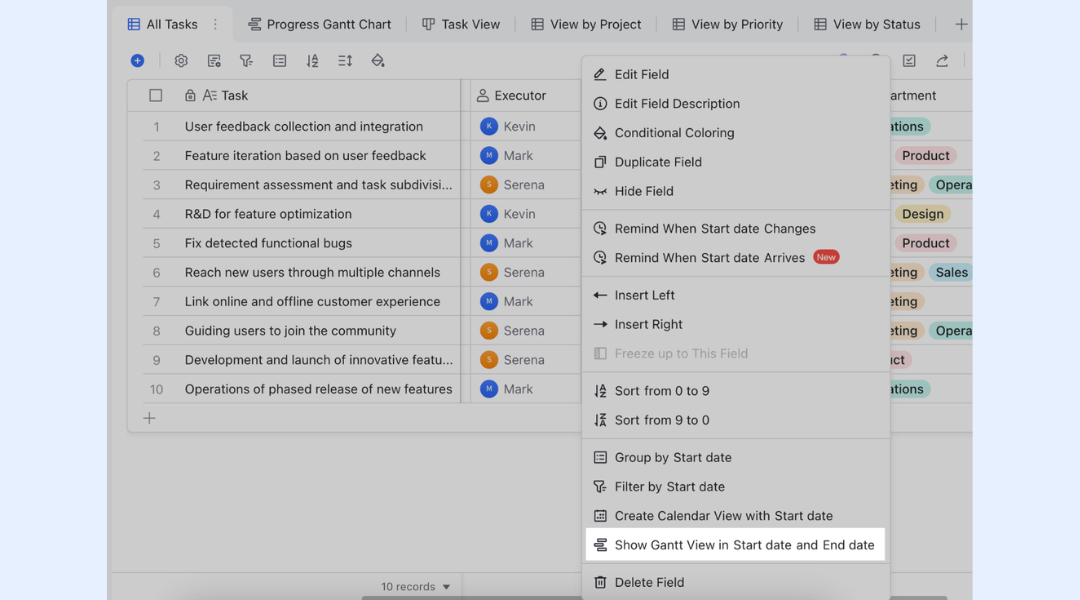
- Toggle between your Grid view and the Gantt view with a single click.
- Drag and drop the time bars directly in the Gantt view to extend durations or shift dates, and these changes will instantly update the underlying data across all other views.
- Apply conditional formatting to your data (e.g., color-coding cells based on "Status") which will be reflected in the Gantt view, providing instant visual cues of task advancement. This helps quickly identify bottlenecks or tasks falling behind, just like a traditional Smartsheet Gantt Chart would.
3. Leverage different views for comprehensive oversight: One of 's powerful features is its ability to present the same underlying data in various views, offering flexibility that complements the Gantt Chart.
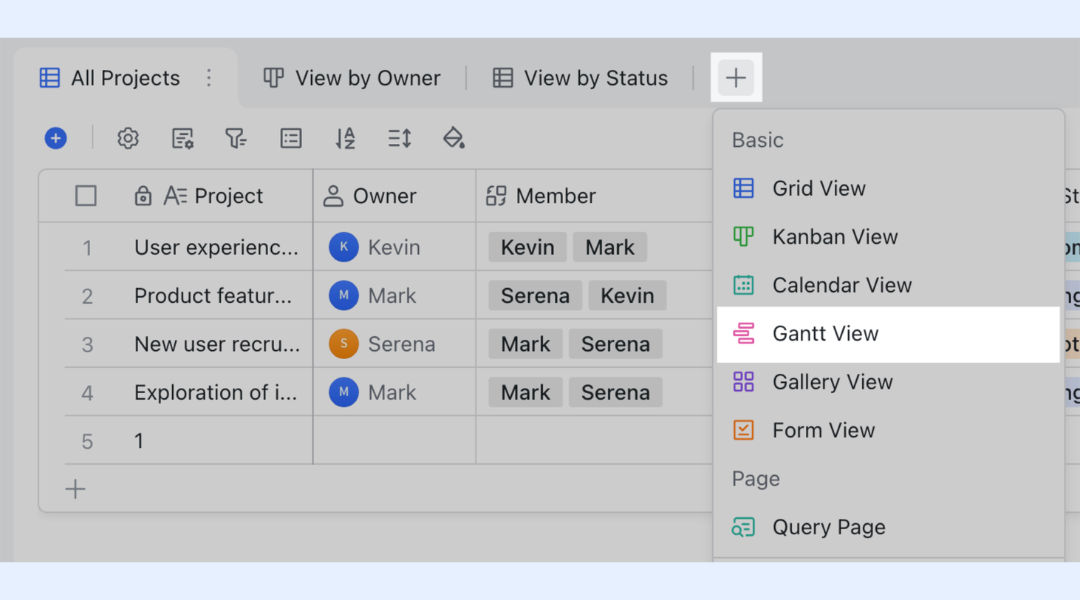
- Grid View: This is your default, where you input and manage all task details.
- Kanban View: Convert your sheet to a Kanban board to visualize tasks by "Status" or "Assigned To," perfect for agile teams managing task flow.
- Calendar View: For date-driven projects, switch to a Calendar view to see tasks laid out by their start and end dates, providing a clear overview of upcoming deadlines and milestones. This multi-faceted approach ensures you have all the necessary perspectives for project management, moving beyond the limitations of a single, rigid Gantt Chart Template display.
Getting started with Lark: Value and accessibility
After seeing how Lark can transform project management by unifying your workflows and enhancing collaboration, the natural next step is to explore how to begin leveraging these powerful tools. Lark understands that every team has unique needs and growth trajectories. That's why we offer a range of plans designed to scale with your organization, ensuring that the full power of an integrated workspace is accessible to you. We aim to provide clear pathways for teams to experience a truly dynamic project management environment, moving beyond the limitations often encountered with a static gantt chart template.
Driving cost-efficiency and streamlined operations
Adopting a unified platform like also brings significant cost savings and streamlined workflows. Many organizations manage multiple specialized subscriptions (e.g., a Smartsheet Gantt Chart, a separate , ), which can be costly. By consolidating these functions into Lark, businesses can reduce software subscription costs and simplify vendor management. Beyond direct savings, the elimination of context switching and efficiencies gained from integrated workflows translate into increased team productivity and reduced operational overhead. This offers a compelling value proposition, helping teams deliver projects more efficiently and contributing to the bottom line.
Flexible plans tailored for every team size
provides flexible plans to match your team's needs, ensuring you invest only in what you require. From startups to large enterprises, you can find a plan that scales with your growth. Our tiered approach is designed to evolve with your team, offering increasing levels of storage, automation runs, and advanced features as your project management needs grow.
- Starter plan: Free forever plan with 11 powerful tools for up to 20 users, 100GB storage, 1,000 automation runs, AI translations, and more. No credit card needed.
- Basic plan: $6/user/month (billed annually) for up to 500 users. Includes everything in Starter plus unlimited message history, 5TB storage, 1,000 automation runs, and more. Some users may need to to purchase.
- Pro plan: $12/user/month (billed annually) for up to 500 users. Includes everything in Basic plus group calling for up to 500 attendees, 15TB storage, 50,000 automation runs, and more.
- Enterprise plan: for custom pricing. Supports unlimited users and includes advanced automation, security, compliance, and management features.
For small teams with simple communication needs

18 months message history
1000 Base automation runs/month
2000 rows per table in Base
Most POPULAR
For companies with comprehensive collaboration and management needs
Unlimited message history
500-participant video meetings
50k Base automation runs/month
20k rows per table in Base
For large companies with advanced security and organizational management needs
Get a personalized demo and pricing
Unlimited message history
500-participant video meetings
15 TB storage + 30 GB storage/user
500k Base automation runs/month
50k Base automation runs/month
Most POPULAR
For companies with comprehensive collaboration and management needs
Unlimited message history
500-participant video meetings
50k Base automation runs/month
20k rows per table in Base
This clear and flexible pricing structure makes Lark an efficient and adaptable solution for businesses of all sizes, allowing you to choose the level of integration and functionality that best suits your current and future needs.
Conclusion
While the Smartsheet Gantt Chart Template and similar resources provide a valuable starting point for project visualization, modern teams increasingly need more than static templates can offer. The challenges of fragmentation, real-time synchronization, and adapting to constant change often overshadow the initial benefits of a standalone Gantt Chart Template. stands out as a superior alternative by offering an all-in-one, dynamic workspace that integrates project timelines, communication, and collaboration into a single, cohesive ecosystem. This approach fosters true team alignment, enhances agility, and drives significant cost-efficiency, representing a more efficient and future-proof strategy for effective project management in today's complex world.
Transform your project Gantt Chart planning with Lark now.
FAQs
What is a Gantt Chart and why is it important for project management?
A Gantt chart is a visual project management tool that illustrates tasks, timelines, dependencies, and milestones. It transforms complex plans into clear, actionable visuals, helping project managers and teams understand project scope, progress, and resource allocation at a glance. It's indispensable for simplifying complex projects and ensuring everyone is aligned on task sequences and timelines.
What are the main strengths of Smartsheet Gantt Chart Templates?
Smartsheet Gantt charts are powerful for visualizing project timelines, managing tasks, and streamlining collaboration within the Smartsheet environment. They offer automated timelines, real-time updates (within the platform), and intuitive drag-and-drop editing. Smartsheet also provides diverse templates for various project needs, such as construction or agile development, serving as a robust starting point.
What are the limitations of relying solely on static or template-based Gantt charts like those from Smartsheet?
While useful, static or template-based Gantt charts can lead to fragmentation if communication, detailed documentation, and approvals happen in separate tools. This causes constant context switching, reduces efficiency, and risks information loss. Such solutions can also struggle with true real-time collaboration that extends beyond the chart, leading to information lags. Their inherent structure may also hinder rapid adaptation to unexpected changes across all project elements.
How does Lark address the limitations of static Gantt chart templates?
Lark provides a unified workspace that integrates project timelines, communication (messaging, video meetings), documents, email, and approval workflows into a single ecosystem. This eliminates context switching and ensures real-time collaboration. Lark's native Gantt charts (within Lark Base) are dynamic, allowing users to instantly update data by dragging and dropping time bars, with changes reflecting across all related documents and communications.
Can Lark provide different views for project oversight beyond a Gantt chart?
Yes, Lark Base allows you to present the same underlying project data in various views, offering comprehensive oversight. Besides the dynamic Gantt view, you can switch to a Grid View for detailed task management, a Kanban View for visualizing tasks by status or assignee, and a Calendar View for date-driven project planning and milestones.
What are the cost-efficiency benefits of using Lark for project management?
Lark consolidates multiple specialized tools (like a Gantt chart, communication platform, and document tools) into one unified platform. This reduces software subscription costs and simplifies vendor management. Beyond direct savings, the elimination of context switching and the efficiencies gained from integrated workflows lead to increased team productivity and reduced operational overhead.
Does Lark offer flexible pricing plans for different team sizes?
Yes, Lark provides flexible plans designed to scale with your organization, from startups to large enterprises. They offer a free Starter plan for up to 20 users, and tiered Basic, Pro, and Enterprise plans with increasing levels of storage, automation runs, and advanced features. You can find more details on their official pricing page.
Related reading